REVISION DATE: 14-Feb-2020 09:23:52
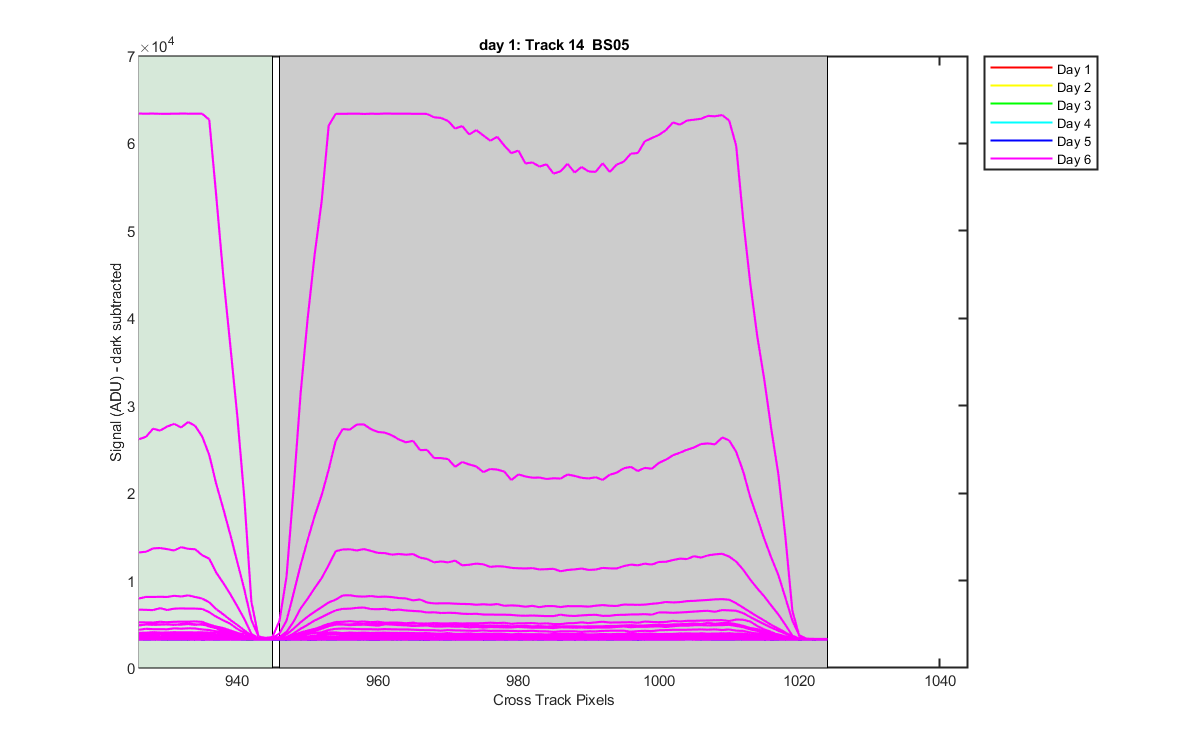
The graphs below show how I defined the tracks. Grey/green patches are what is averaged for each track.
This includes laser data and broadband data. You will notice that on day 5 some of the lines are way outside the tracks. These are the laser data from 342, 344, 346 and 348 which Mike notices the 2nd order peak is outside the track for the 355 nm laser data. In this graph you can see it here because the laser peak is off the array and so my program is finding the 2nd order peak and plotting it. On day 6 Mike added some broad band source data for all the tracks to see if any other tracks moved.
Track pixels:
Track:  1       2       3       4       5       6       7       8       9      10      11      12      13      14
Left:   1      79     152     225     297     369     441     514     586     658     729     801     873     946
Right:  78     151     224     296     368     440     513     585     657     728     800     872     945    1024
Figure 1
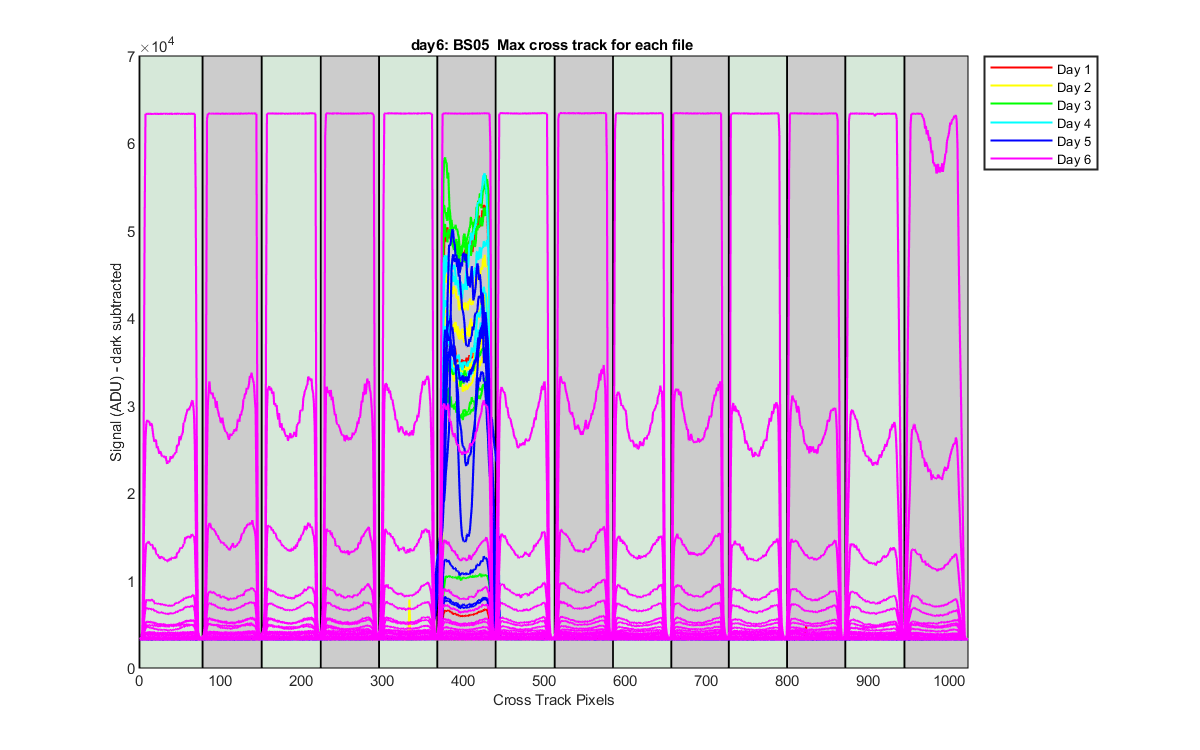
Figure 2
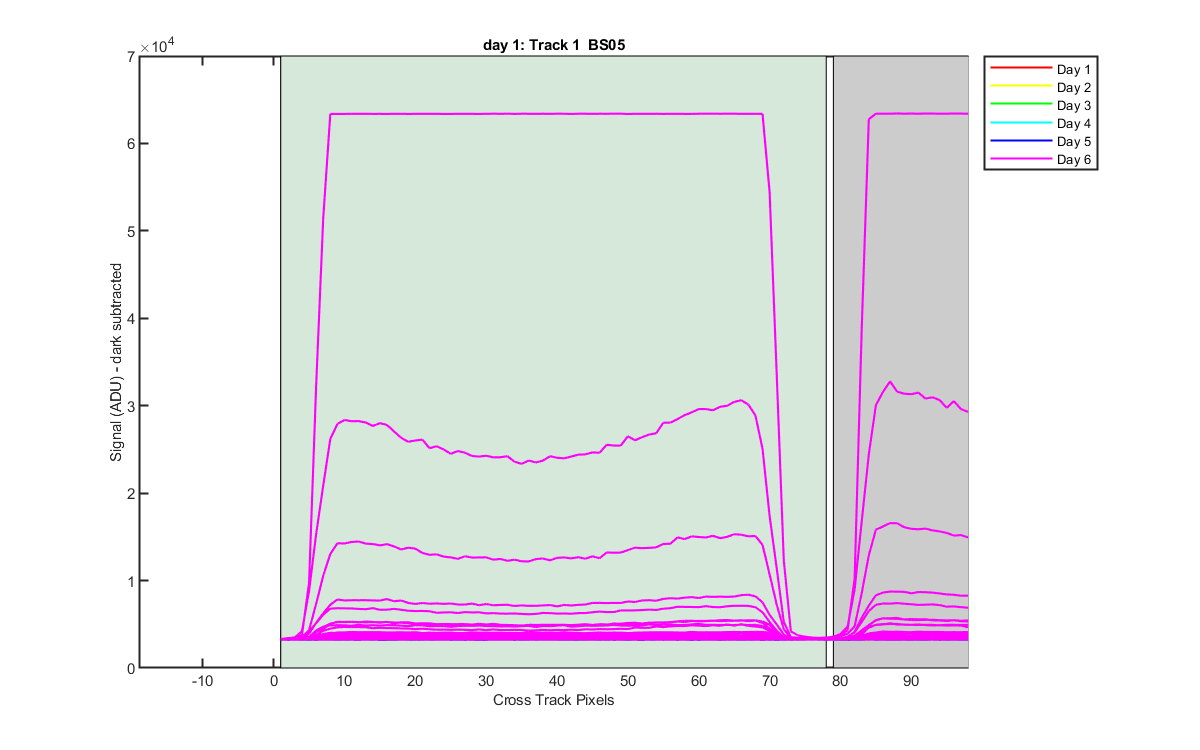
Figure 3

Figure 4
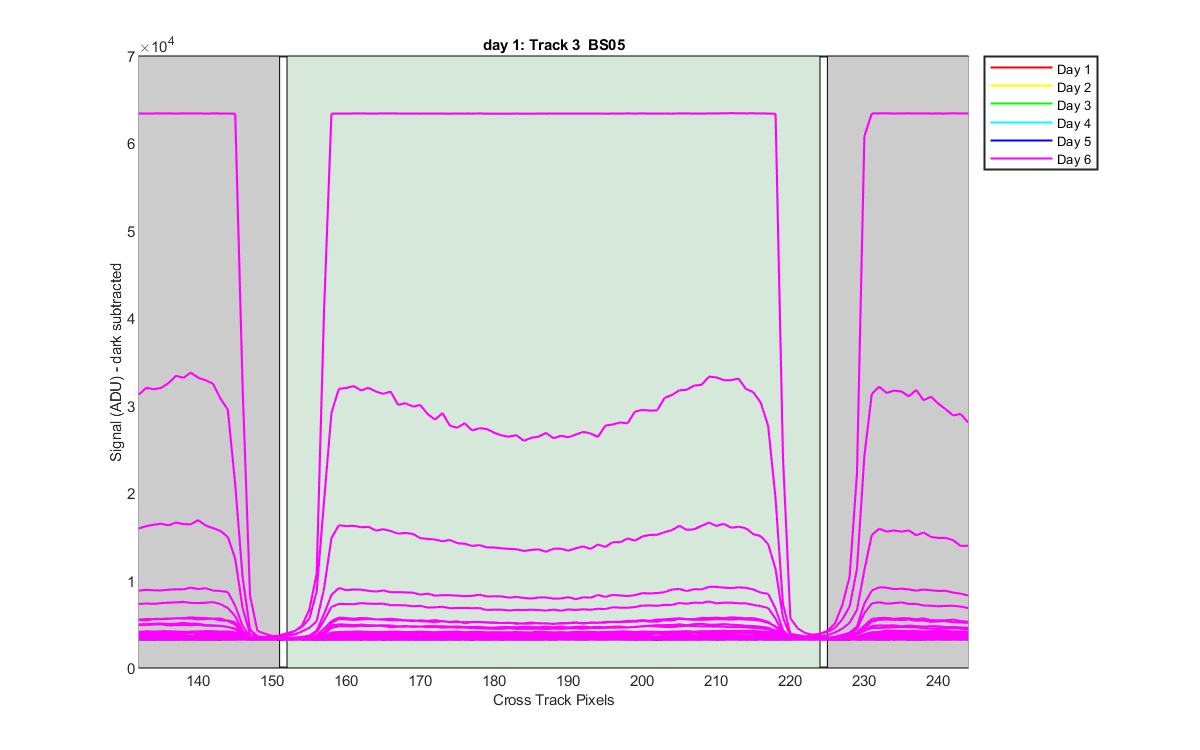
Figure 5
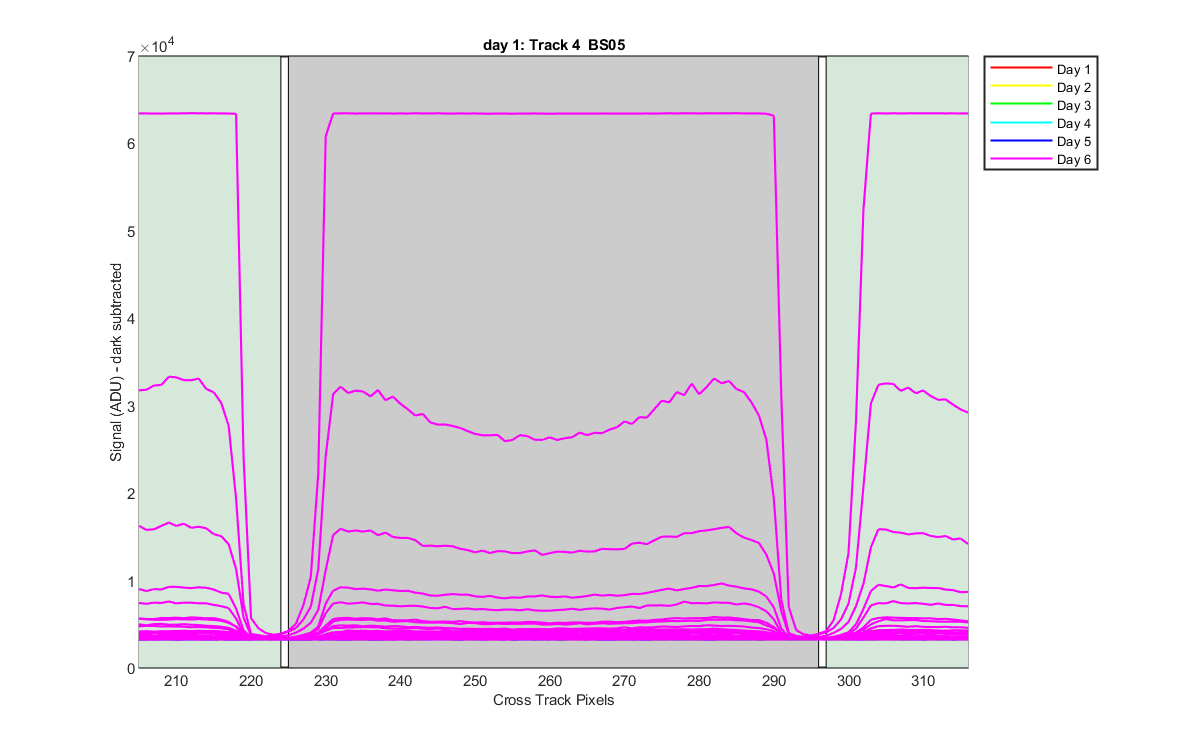
Figure 6
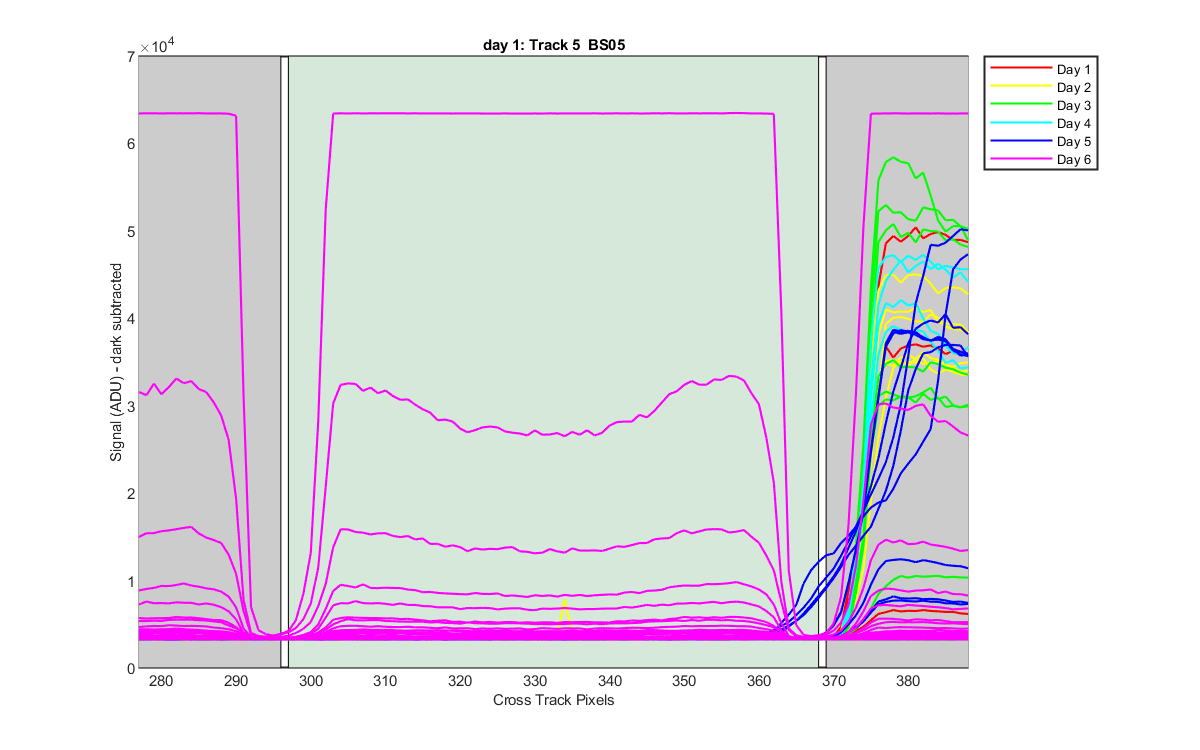
Figure 7
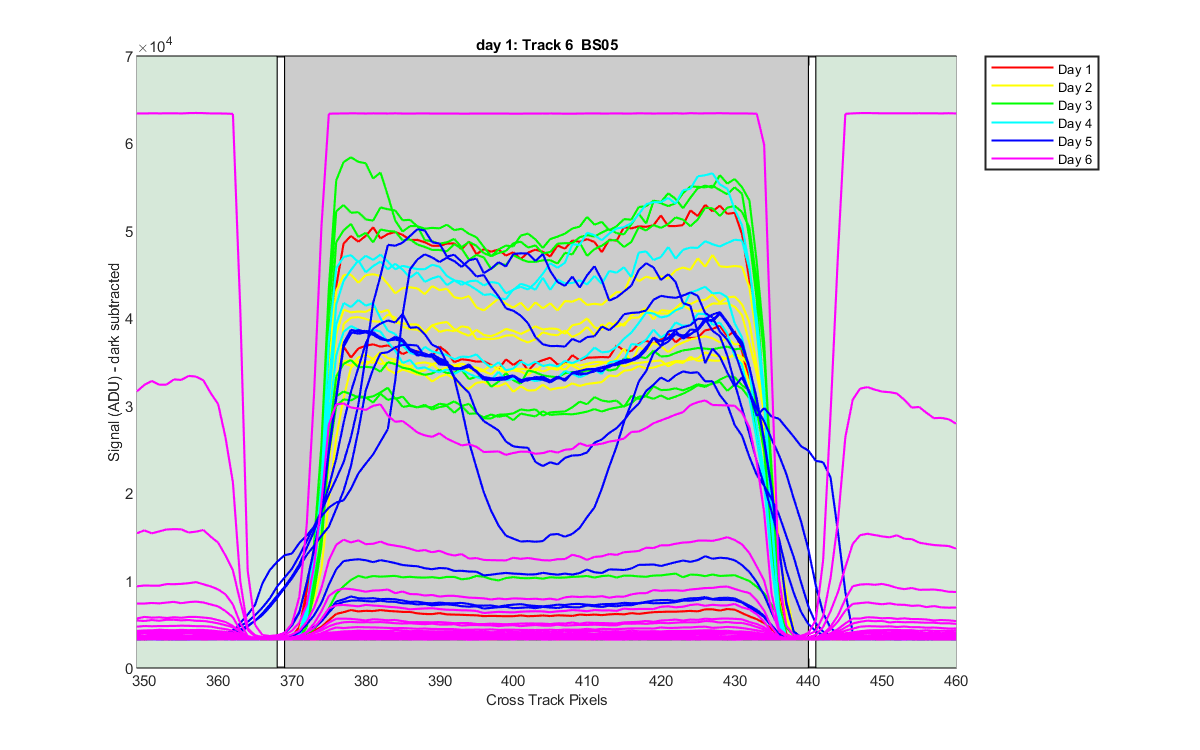
Figure 8
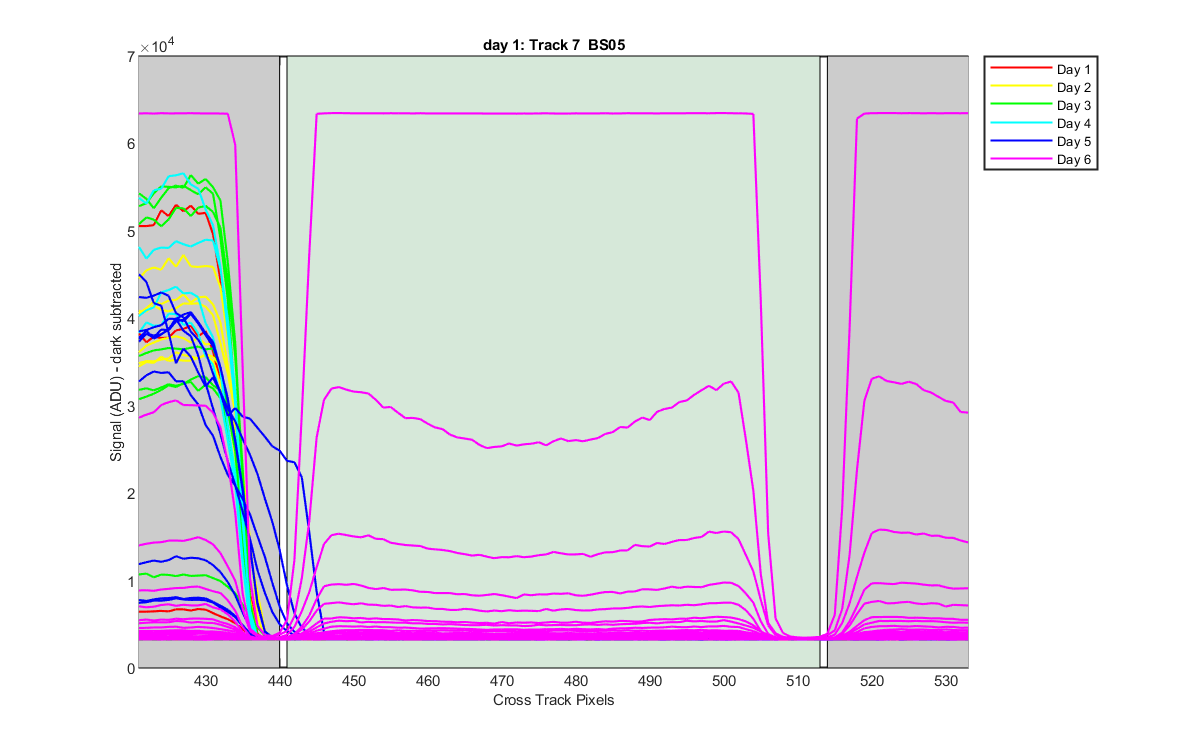
Figure 9
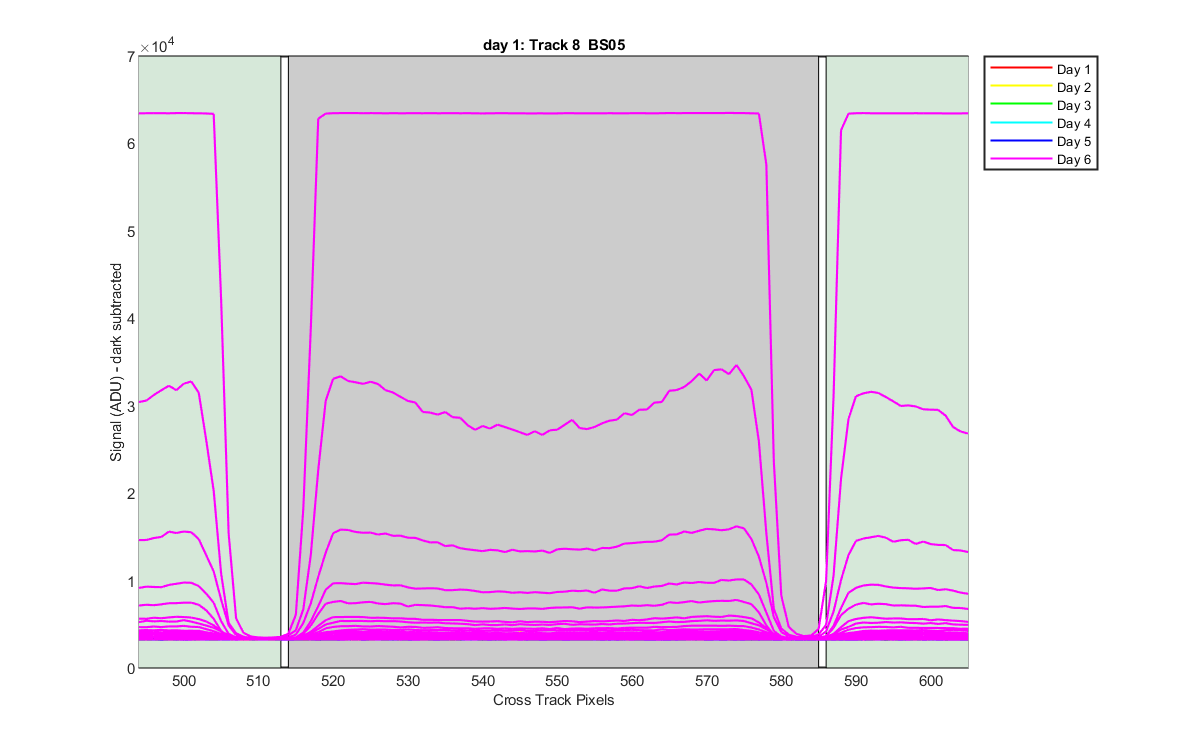
Figure 10

Figure 11
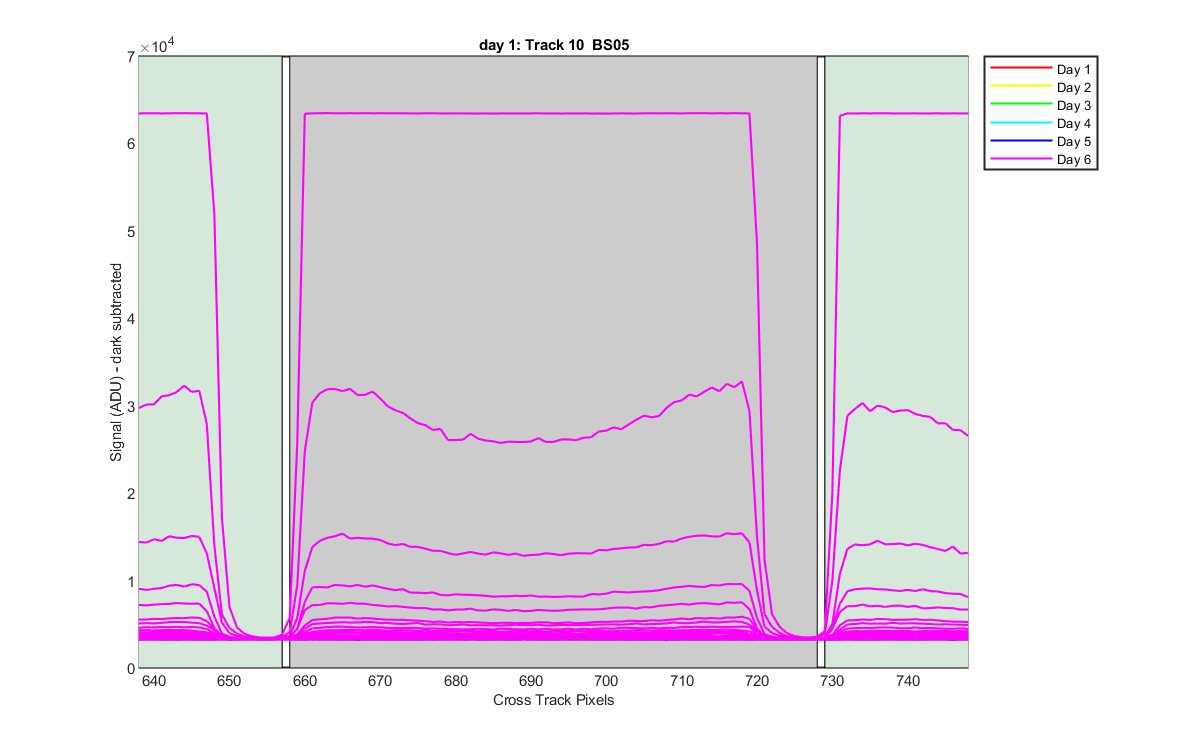
Figure 12

Figure 13
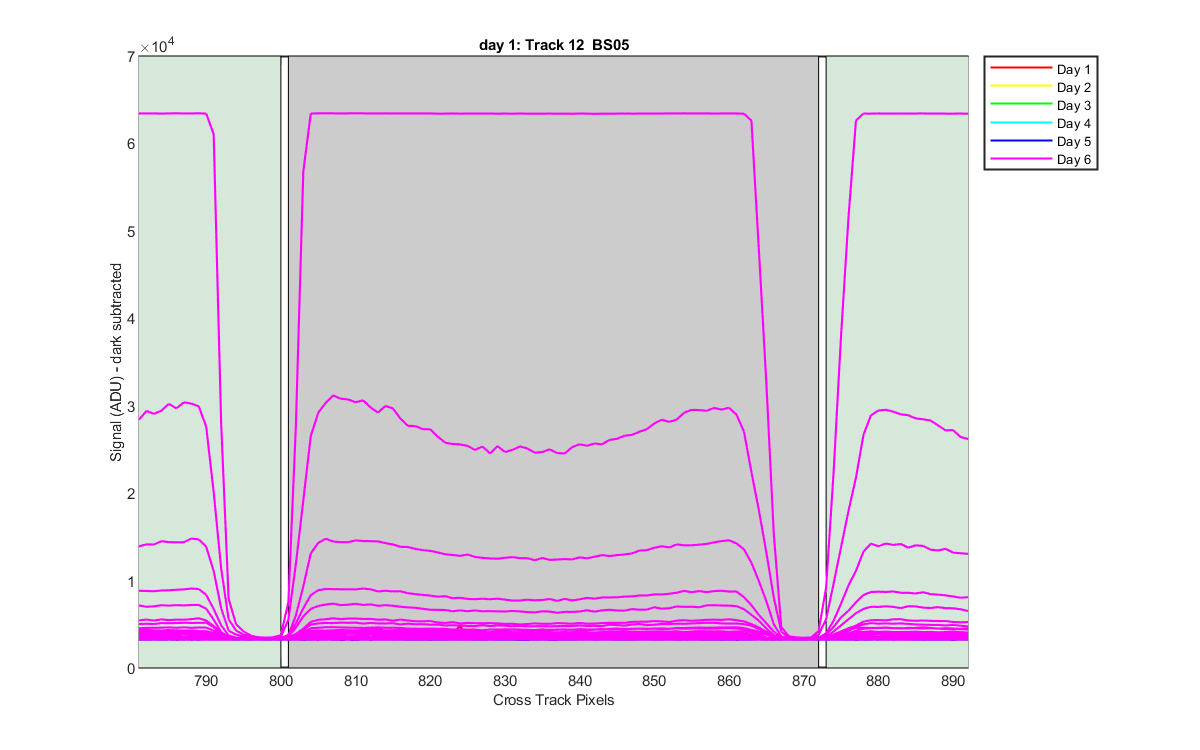
Figure 14
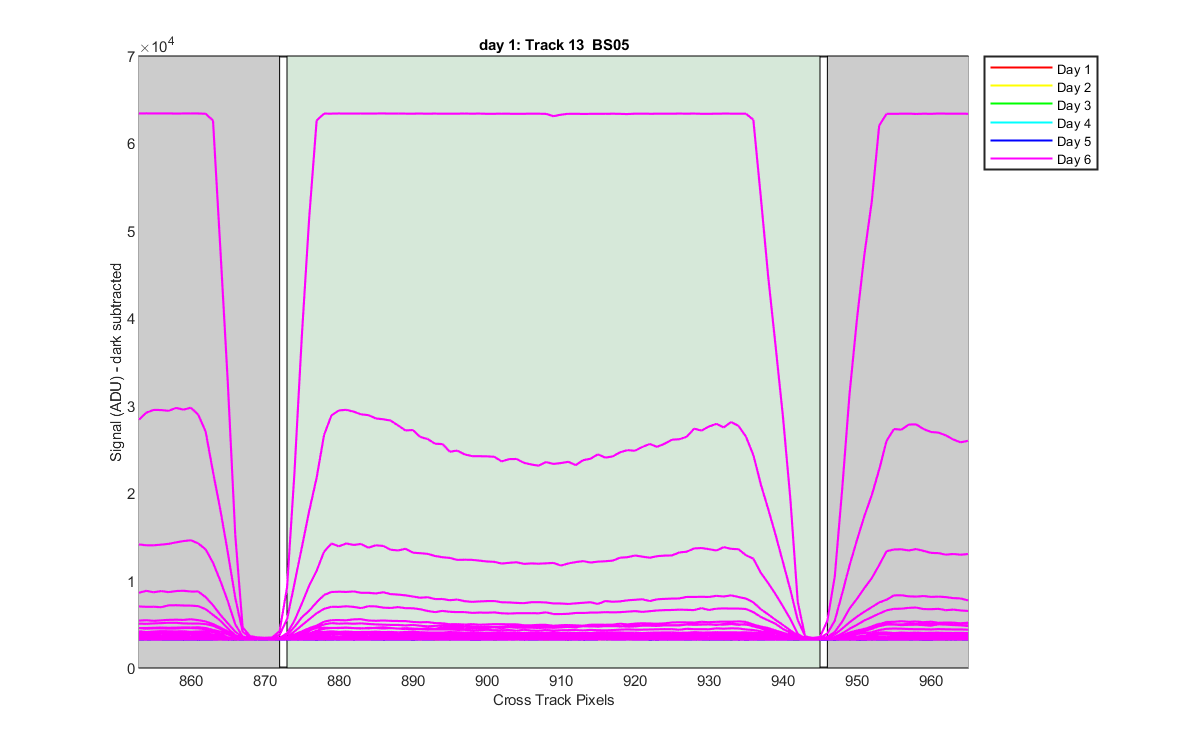
Figure 15