REVISION DATE: 14-Feb-2020 08:56:14
Exerimental BS or RS data starting to put data into new Vaux setup.
| Dataset# | Filename / Fit# | Type | file creation date | Total Exposure Time | Tracks on | Temperature | Pre Amplifier Gain | Matrix Max (ADU) | Matrix Mean (ADU) | Matrix % std |
|---|---|---|---|---|---|---|---|---|---|---|
| 1 | BS_20200214_051909_raw01 / 001 | Background | 14-Feb-2020 05:19:09 | 0.1 | 1 2 3 4 5 6 7 8 9 10 11 12 13 14 | -60 | 4 | 3285 | 3250.1088 | 0.22256 |
| 1 | BS_20200214_051909_raw01 / 002 | Background | 14-Feb-2020 05:19:46 | 0.1 | 1 2 3 4 5 6 7 8 9 10 11 12 13 14 | -60 | 4 | 3282 | 3249.1191 | 0.2228 |
| 1 | BS_20200214_051909_raw01 / 001 | Lite | 14-Feb-2020 05:19:56 | 0.1 | 1 2 3 4 5 6 7 8 9 10 11 12 13 14 | -60 | 4 | 63491 | 5138.8414 | 101.086 |
| 1 | BS_20200214_051909_raw01 / 002 | Lite | 14-Feb-2020 05:20:13 | 0.1 | 1 2 3 4 5 6 7 8 9 10 11 12 13 14 | -60 | 4 | 63495 | 5129.9616 | 100.9071 |
| 1 | BS_20200214_051909_raw01 / 003 | Lite | 14-Feb-2020 05:20:24 | 0.1 | 1 2 3 4 5 6 7 8 9 10 11 12 13 14 | -60 | 4 | 63497 | 5138.0589 | 101.0878 |
| 1 | BS_20200214_051909_raw01 / 004 | Lite | 14-Feb-2020 05:20:34 | 0.1 | 1 2 3 4 5 6 7 8 9 10 11 12 13 14 | -60 | 4 | 63499 | 5175.818 | 101.9262 |
| 1 | BS_20200214_051909_raw01 / 003 | Background | 14-Feb-2020 05:20:44 | 0.1 | 1 2 3 4 5 6 7 8 9 10 11 12 13 14 | -60 | 4 | 3281 | 3247.7884 | 0.22277 |
| 1 | BS_20200214_051909_raw01 / 004 | Background | 14-Feb-2020 05:20:53 | 0.1 | 1 2 3 4 5 6 7 8 9 10 11 12 13 14 | -60 | 4 | 3283 | 3247.7399 | 0.22309 |
Graphs below are of the Nets for a dataset. A dataset is a group of dark-lite-dark files that Mike says in his logsheet are collected together. One net = darks before and after averaged then , lights averaged, then avg_lite-avg_dark and the avg_net divided by intergration time for each track.
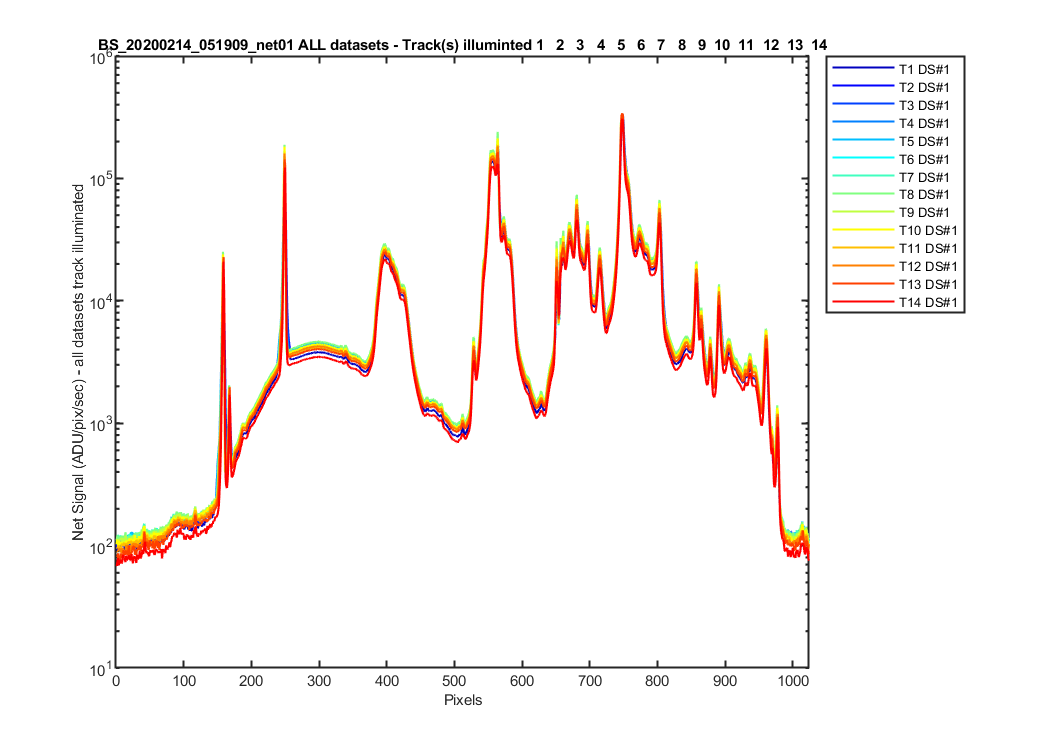
Figure 1 A: All the net data sets with a track illuminated. This shows ALL the net tracks with light on them.
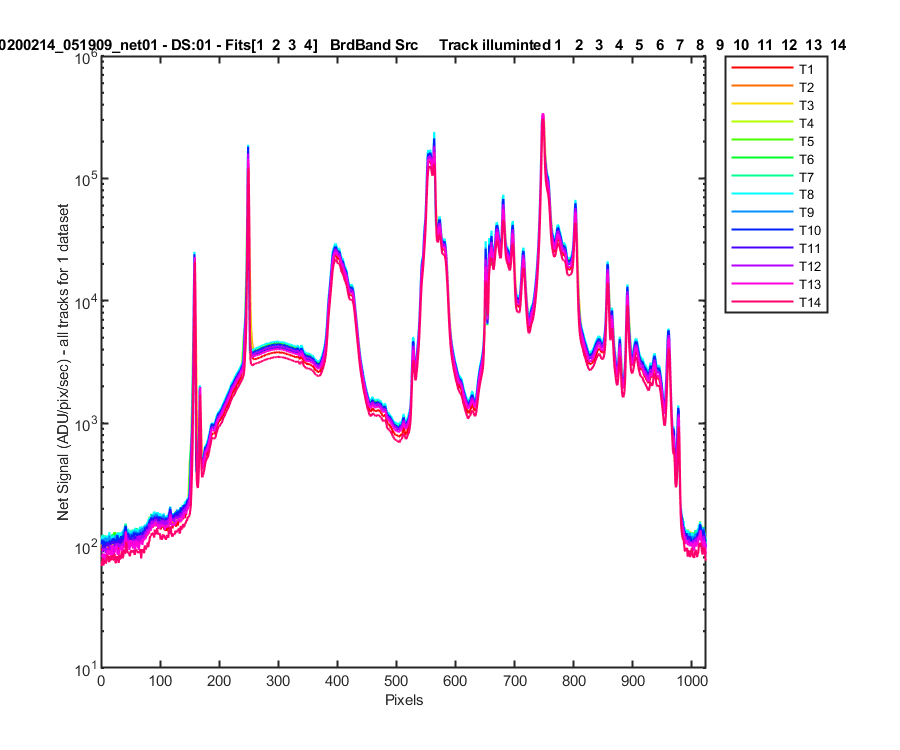
Figure 2 A: The net for one dataset (dark-lite-dark) for all tracks illuminated or not. This allows you to see the straylight on other tracks. The dataset number and fits files used to create this net are in the title of the figure.