REVISION DATE: 05-Apr-2018 12:51:37
Below are my graphs of the BIP file with only channel 7 illuminated. The file contains 20 images of the white light source. Over all it looks really stable and track definition looks good. See each graph below for more detail.
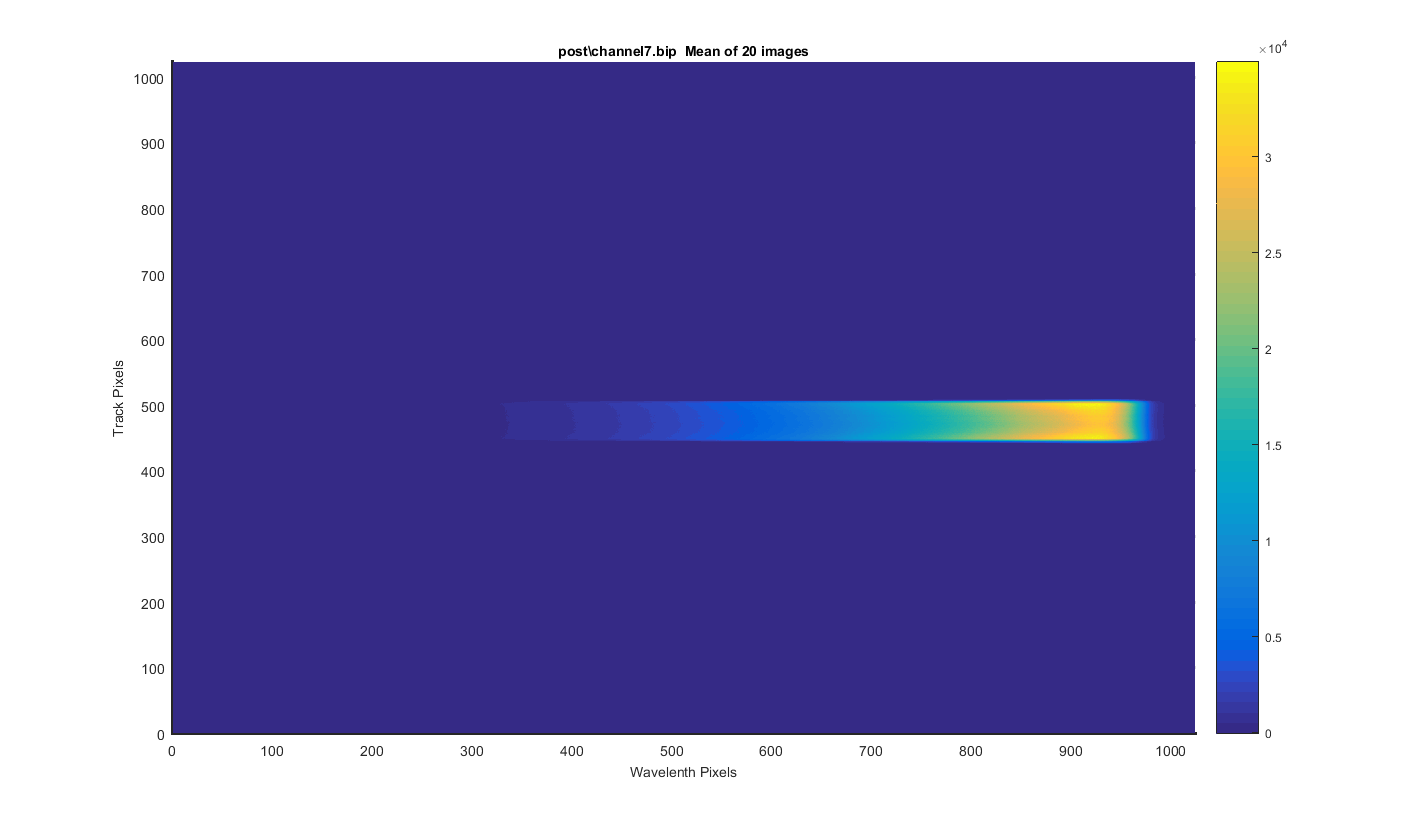
Figure 1
I took the 20 images and meaned them to get the surface plot below.
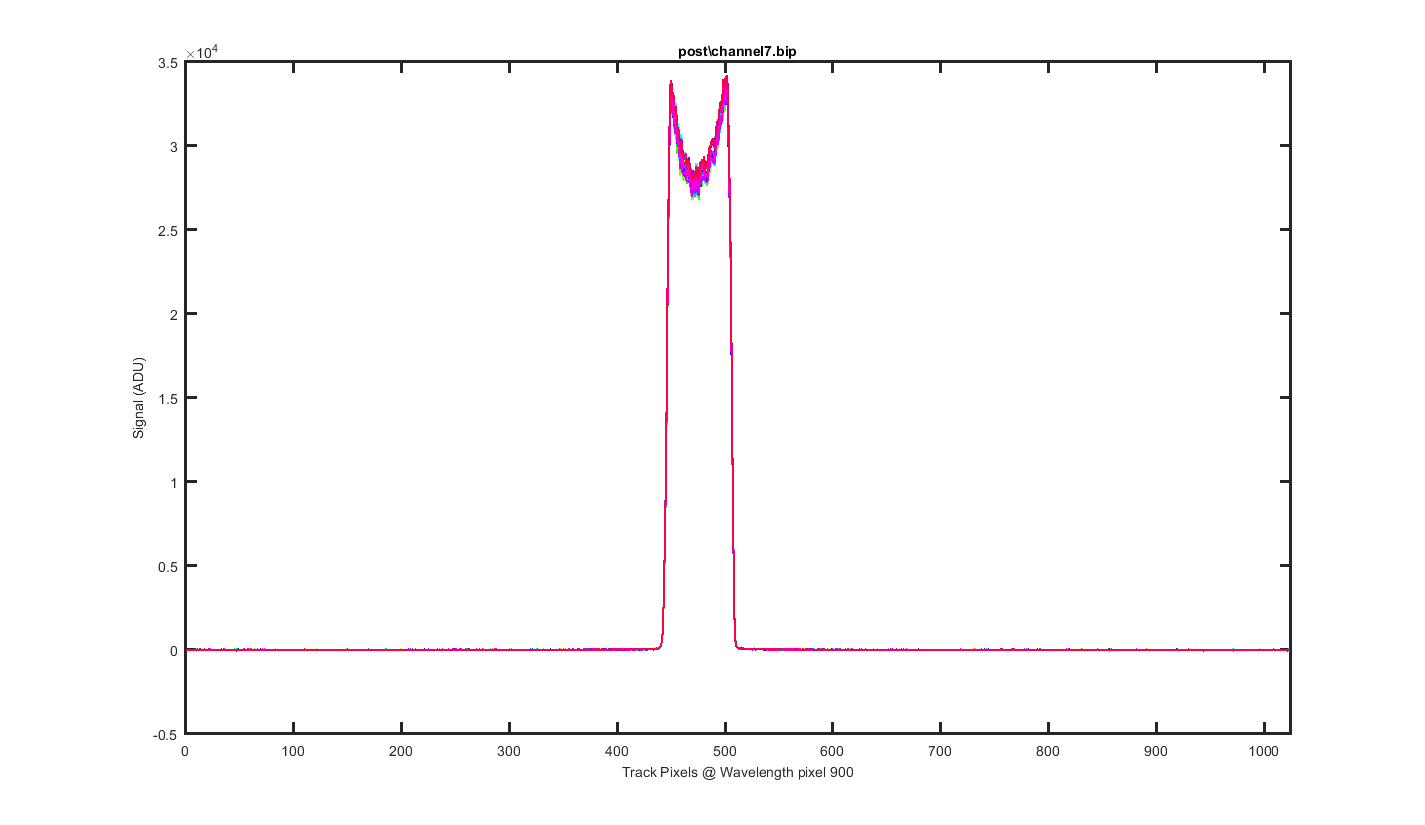
Figure 2
This is a cross section through the tracks at wavelength pixel 900, with one line for each of the 20 images.
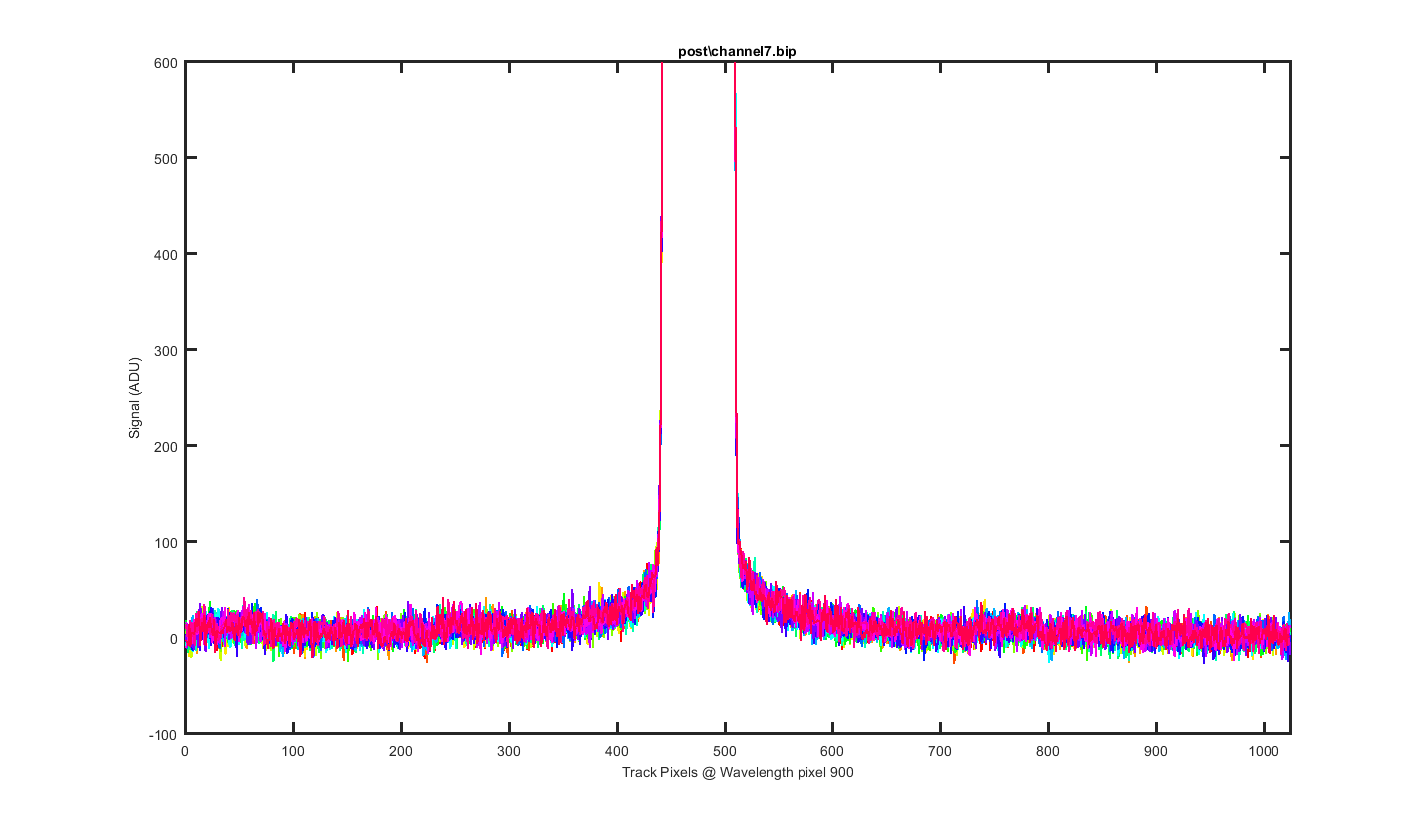
Figure 3
Same as the previous graph but zoomed into the bottom to see the level of the darks between the tracks.
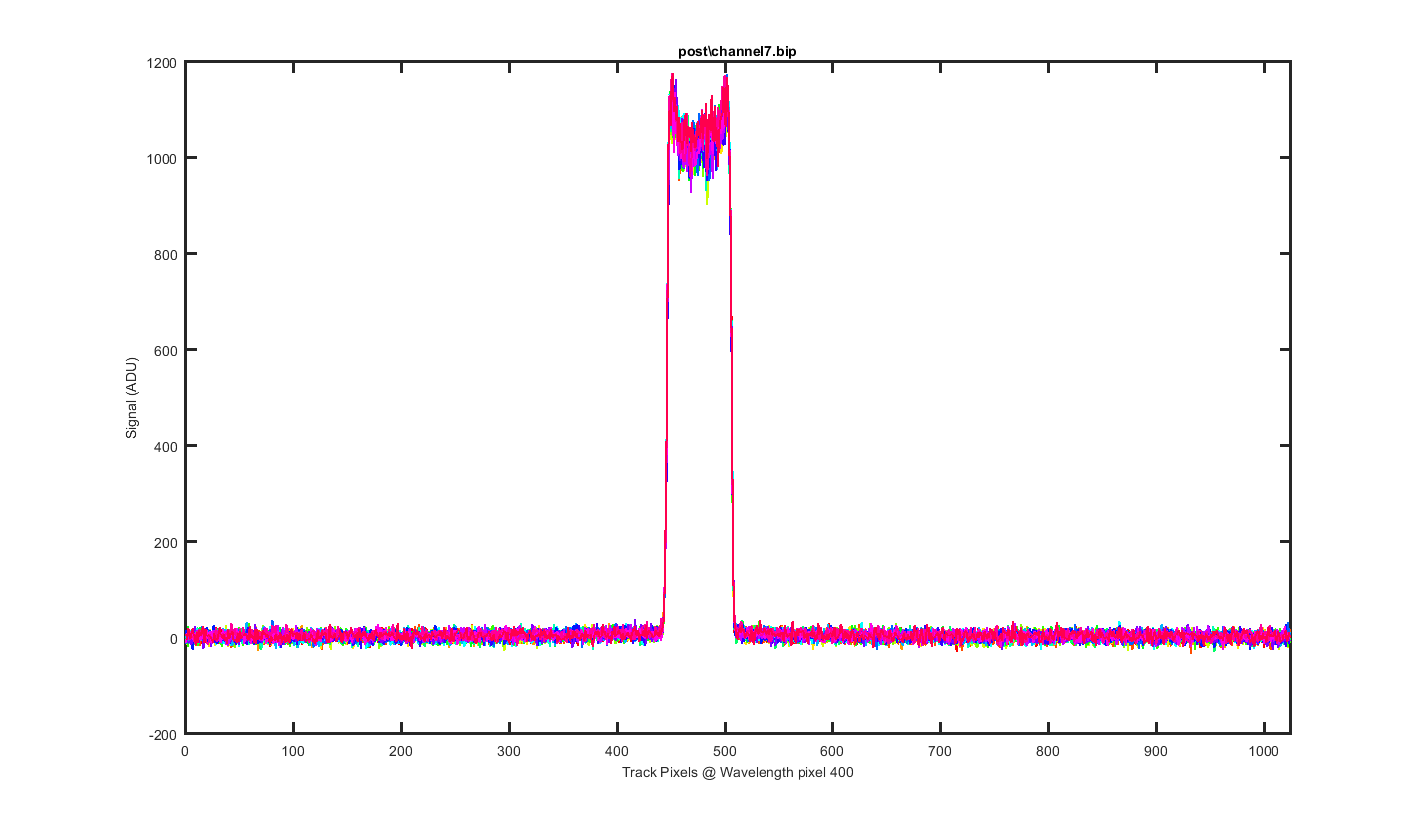
Figure 4
Same as figure 2 but for Wavelength pixel 400.
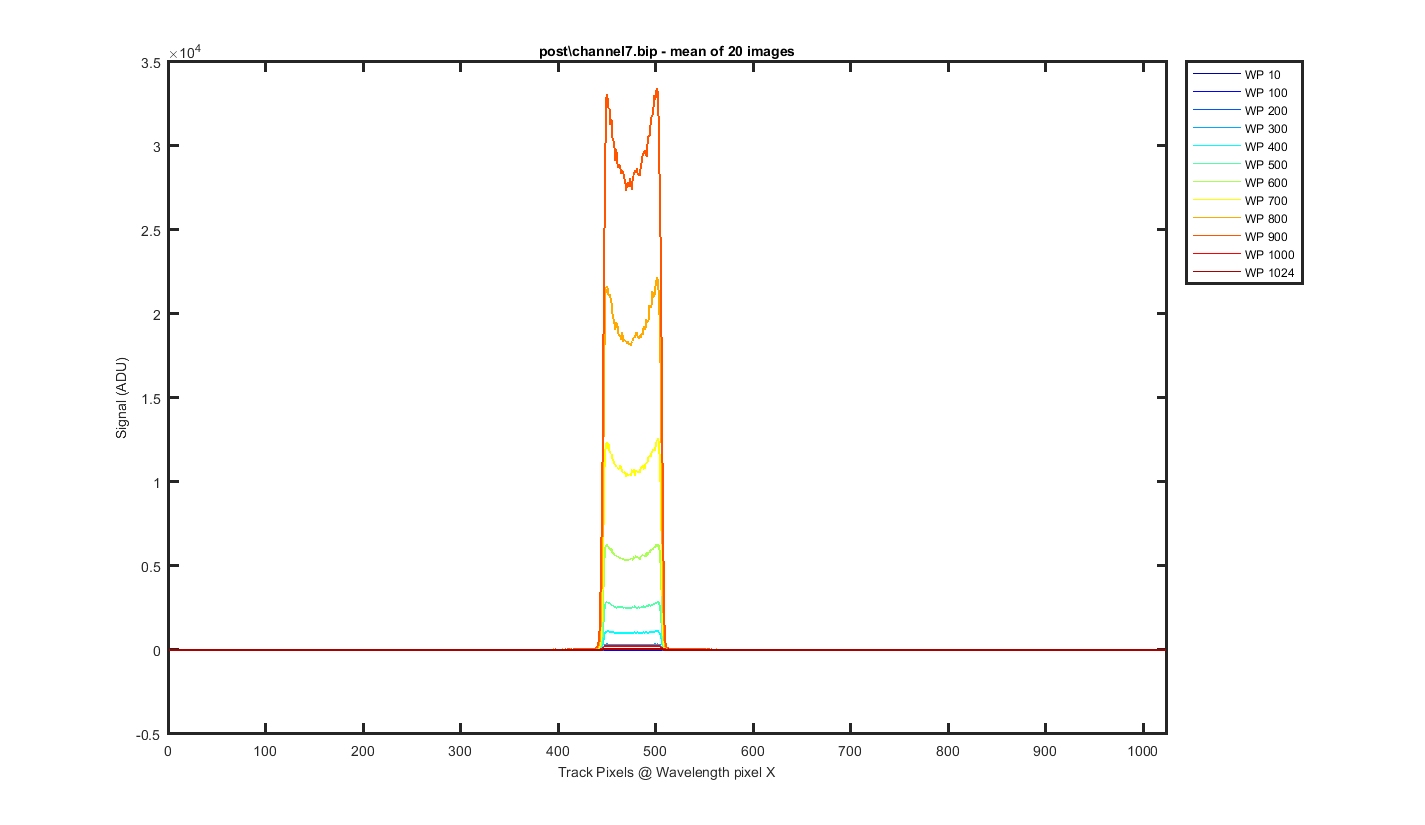
Figure 5
Again this is the mean image with slices thought the image at different wavelength pixels.
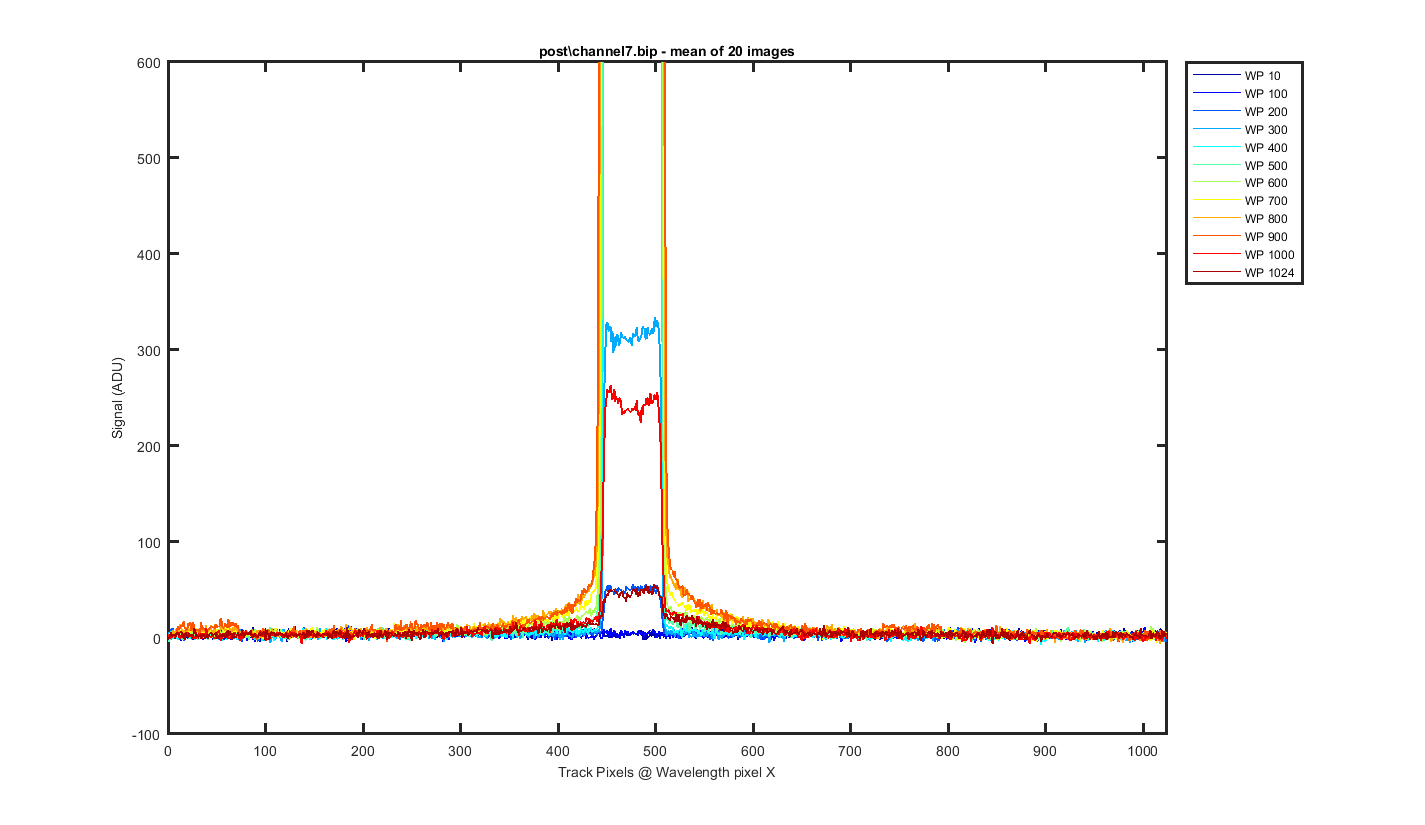
Figure 6
Same as figure 5 but zoomed to the bottom so you can see the darks between the tracks.
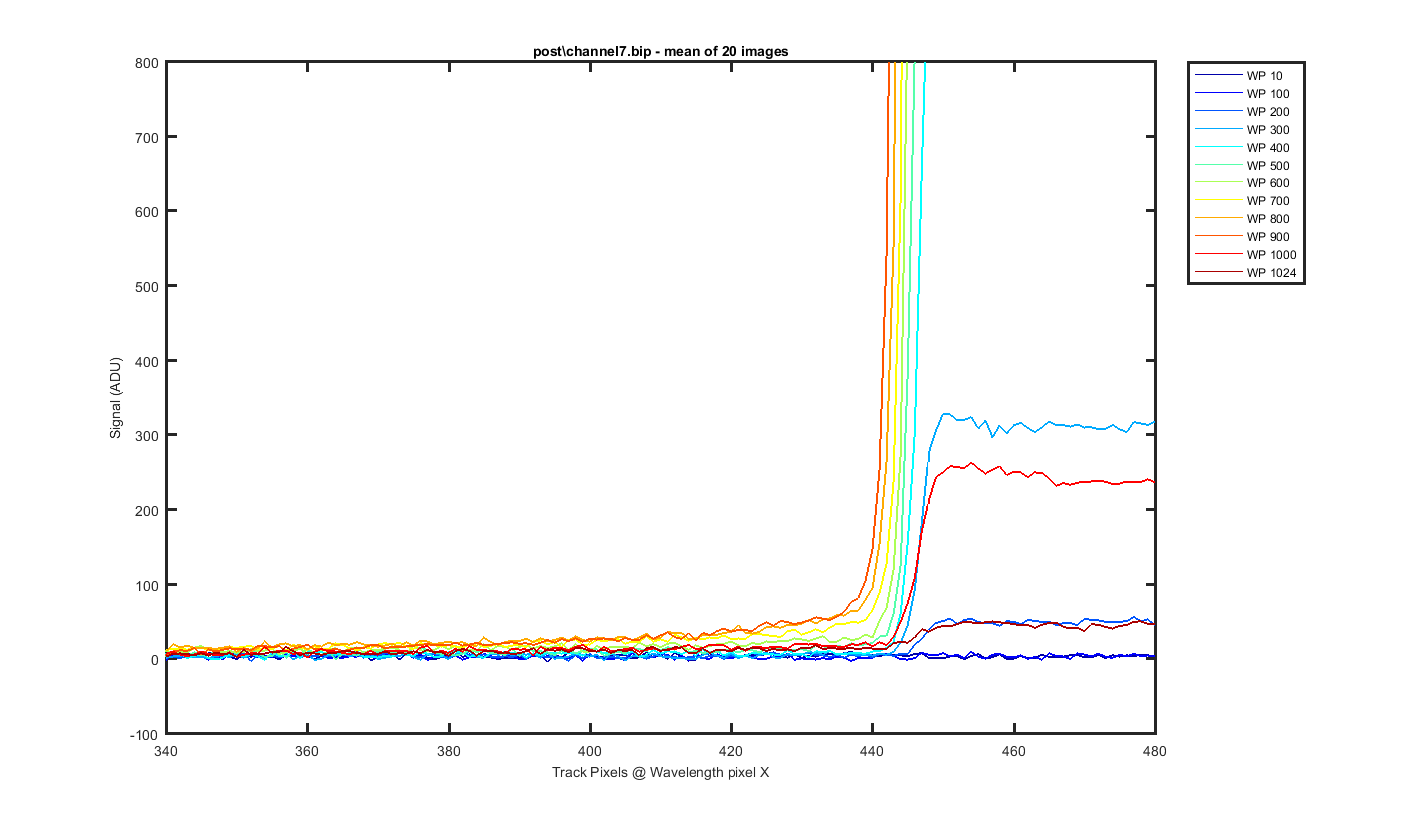
Figure 7
Same as figure 6 but zoomed to the dark space to the left of track 7
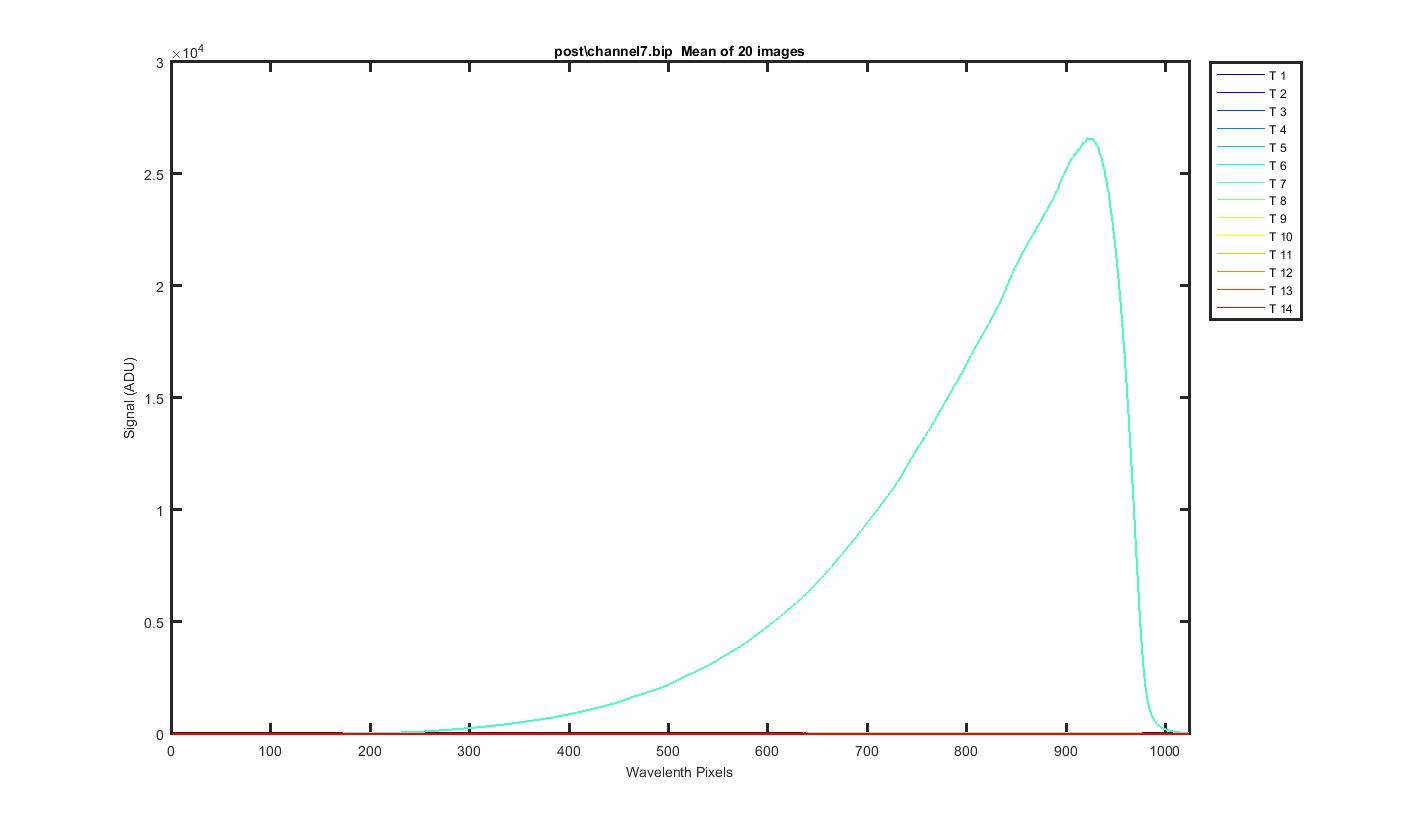
Figure 8
All the tracks with track 7 being the only one with light on it.
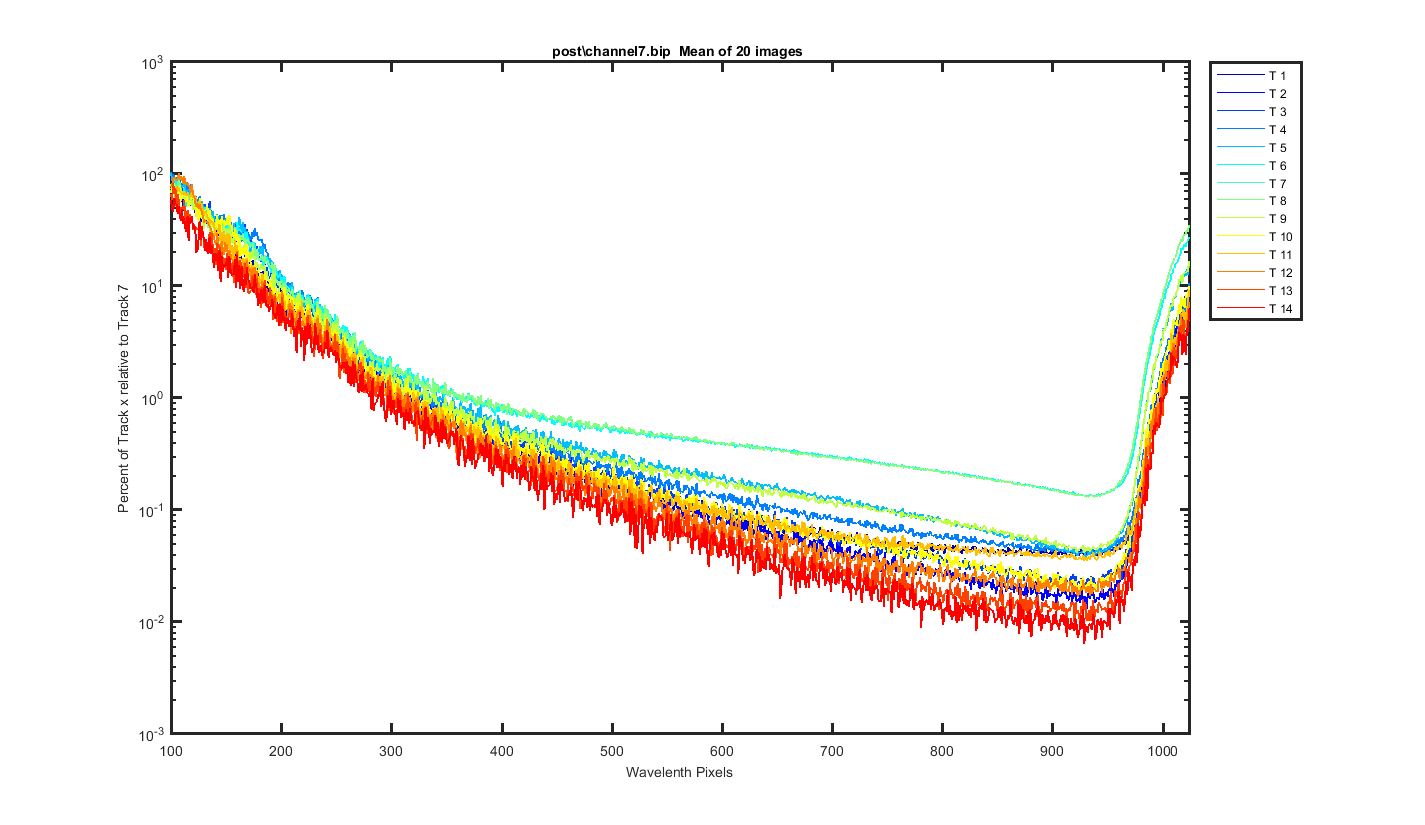
Figure 9
Each track was ratioed to track 7 so get an idea of the cross track light