REVISION DATE: 29-Mar-2018 15:33:35
Below is my analysis of the before and after shake test data. There are two data sets. The helium line data before and after shaking and lamp data for all 14 tracks.
For the helimum lines I found for each peak the max value. I then removed the peak data within +- 10 pixels of the peak. I subtracted the minimun and divded by the max to normalize the peaks. I then used a gaussian peak fitting program to find the peak for each helium line in the pre and post shake data and each track. The table and graphs show the change in the peak is much less than 0.1 pixel, very nice.
For the lamp data and looking at the track shift. I used one of the maximum pixel values for the lamp data (~850 pixel) to pull out a cross track line. I normalized each tracks cross-track line to the maximum value for each track pre and post shaking. I then interpolte the left and right edge of the tracks to 0.001 intervals data and find which pixel is closest to 0.50 (green line in the graphs) I save the sub-pixel value in a table. The Table in the Track movement section shows the pixel values and changes pre/post shaking. My values will differ from Resonon values since they use a different method. Also their Pre delivery doc gives a single value for all the tracks. I saw movement from of less than 0.1 for all tracks.
And EMail from Mike Kehoe explained it this way:
Spatial direction means the position of the individual fibers on the image plane. From what I am hearing, I think the thing that is moving mostly is the camera.
If so, it translated by two pixels in the direction parallel to the slit after the shake test. In that case, the positions of the spectrum lines on the camera
will remain unchanged as shown in Table 2. The position of each of the 14 fibers would move in one direction by two pixels.
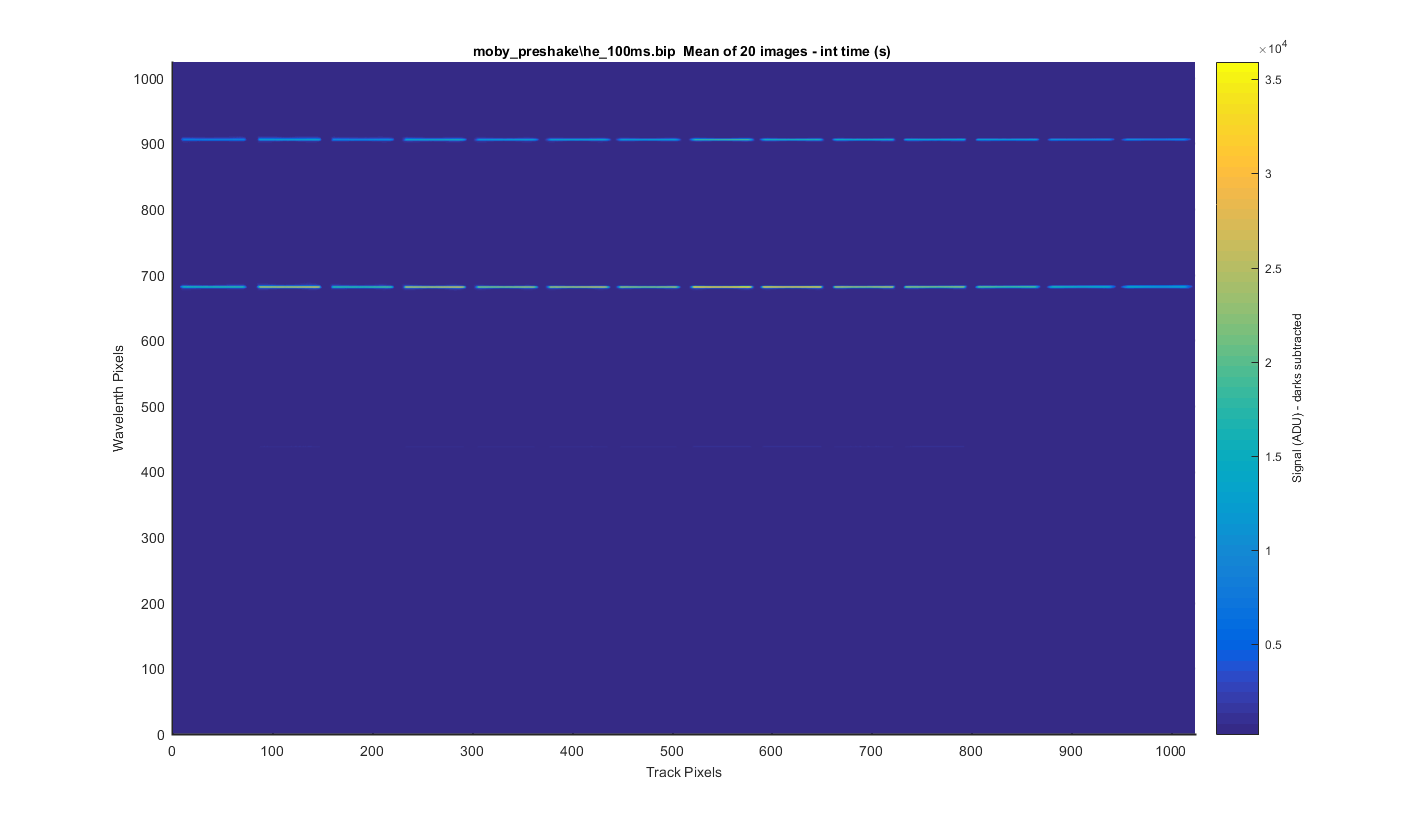
Figure 1 LOOKING AT WAVELENGTH MOVEMENT------------------------------------------------------------
Helium image before shacking, You can see the 4 helium lines. Each helium line is plotted in the graphs below for each track with the before and after shaking data.
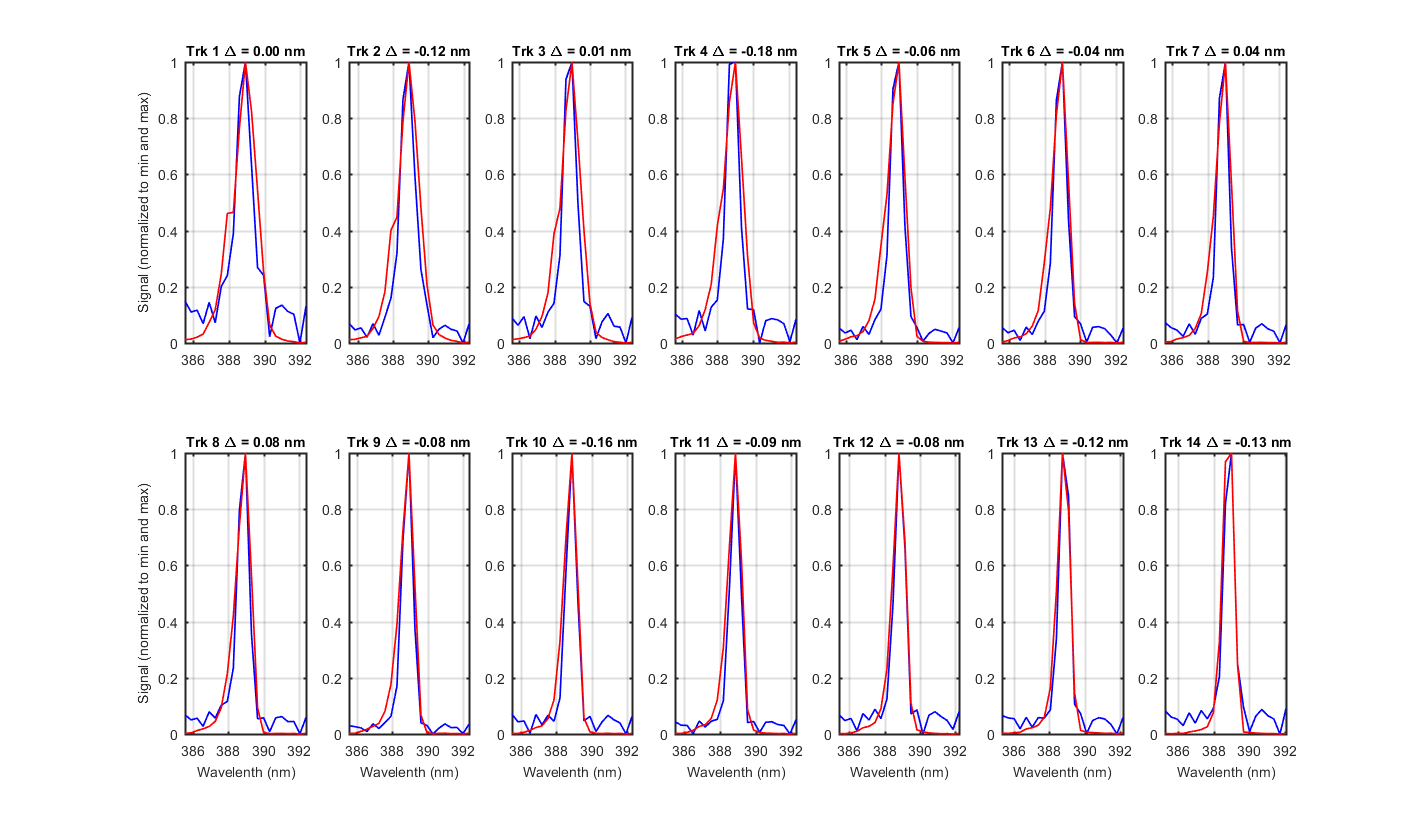
Figure 2
| Helium Line (nm) |
Helium Line (~pixel) |
Track | Pre-shaking pixel |
Post-shaking pixel |
Change (pix) |
|---|---|---|---|---|---|
| 388.86 | 112 | 1 | 111.68 | 111.68 | 0.00 |
| 388.86 | 112 | 2 | 111.87 | 111.75 | -0.12 |
| 388.86 | 112 | 3 | 111.66 | 111.67 | 0.01 |
| 388.86 | 112 | 4 | 111.53 | 111.36 | -0.18 |
| 388.86 | 112 | 5 | 111.60 | 111.54 | -0.06 |
| 388.86 | 112 | 6 | 111.65 | 111.61 | -0.04 |
| 388.86 | 112 | 7 | 111.61 | 111.64 | 0.04 |
| 388.86 | 112 | 8 | 111.63 | 111.71 | 0.08 |
| 388.86 | 112 | 9 | 111.77 | 111.69 | -0.08 |
| 388.86 | 112 | 10 | 111.92 | 111.76 | -0.16 |
| 388.86 | 112 | 11 | 111.98 | 111.90 | -0.09 |
| 388.86 | 112 | 12 | 112.15 | 112.07 | -0.08 |
| 388.86 | 112 | 13 | 112.37 | 112.25 | -0.12 |
| 388.86 | 112 | 14 | 112.56 | 112.43 | -0.13 |
| 447.15 | 282 | 1 | 281.47 | 281.58 | 0.10 |
| 447.15 | 282 | 2 | 281.48 | 281.55 | 0.08 |
| 447.15 | 282 | 3 | 281.37 | 281.43 | 0.06 |
| 447.15 | 282 | 4 | 281.27 | 281.25 | -0.01 |
| 447.15 | 282 | 5 | 281.28 | 281.22 | -0.06 |
| 447.15 | 282 | 6 | 281.32 | 281.27 | -0.05 |
| 447.15 | 282 | 7 | 281.31 | 281.36 | 0.05 |
| 447.15 | 282 | 8 | 281.33 | 281.40 | 0.07 |
| 447.15 | 282 | 9 | 281.45 | 281.41 | -0.04 |
| 447.15 | 282 | 10 | 281.47 | 281.47 | 0.00 |
| 447.15 | 282 | 11 | 281.55 | 281.57 | 0.01 |
| 447.15 | 282 | 12 | 281.71 | 281.75 | 0.05 |
| 447.15 | 282 | 13 | 281.88 | 281.89 | 0.02 |
| 447.15 | 282 | 14 | 282.10 | 282.13 | 0.04 |
| 501.57 | 438 | 1 | 437.39 | 437.49 | 0.10 |
| 501.57 | 438 | 2 | 437.33 | 437.43 | 0.10 |
| 501.57 | 438 | 3 | 437.25 | 437.35 | 0.11 |
| 501.57 | 438 | 4 | 437.17 | 437.27 | 0.10 |
| 501.57 | 438 | 5 | 437.21 | 437.28 | 0.07 |
| 501.57 | 438 | 6 | 437.24 | 437.31 | 0.07 |
| 501.57 | 438 | 7 | 437.23 | 437.31 | 0.08 |
| 501.57 | 438 | 8 | 437.28 | 437.36 | 0.08 |
| 501.57 | 438 | 9 | 437.35 | 437.42 | 0.07 |
| 501.57 | 438 | 10 | 437.38 | 437.47 | 0.09 |
| 501.57 | 438 | 11 | 437.45 | 437.50 | 0.05 |
| 501.57 | 438 | 12 | 437.57 | 437.62 | 0.05 |
| 501.57 | 438 | 13 | 437.72 | 437.77 | 0.04 |
| 501.57 | 438 | 14 | 437.88 | 437.96 | 0.08 |
| 587.56 | 681 | 1 | 680.71 | 680.80 | 0.09 |
| 587.56 | 681 | 2 | 680.66 | 680.75 | 0.10 |
| 587.56 | 681 | 3 | 680.59 | 680.69 | 0.09 |
| 587.56 | 681 | 4 | 680.54 | 680.63 | 0.09 |
| 587.56 | 681 | 5 | 680.55 | 680.63 | 0.08 |
| 587.56 | 681 | 6 | 680.55 | 680.65 | 0.10 |
| 587.56 | 681 | 7 | 680.54 | 680.65 | 0.10 |
| 587.56 | 681 | 8 | 680.56 | 680.67 | 0.12 |
| 587.56 | 681 | 9 | 680.61 | 680.72 | 0.11 |
| 587.56 | 681 | 10 | 680.65 | 680.76 | 0.10 |
| 587.56 | 681 | 11 | 680.71 | 680.79 | 0.08 |
| 587.56 | 681 | 12 | 680.78 | 680.82 | 0.04 |
| 587.56 | 681 | 13 | 680.87 | 680.93 | 0.06 |
| 587.56 | 681 | 14 | 681.01 | 681.10 | 0.09 |
Helium line 388.8648 nm @ pixel 112 for all 14 tracks The delta in the title is the number of nm a gaussian fit says the peak moved
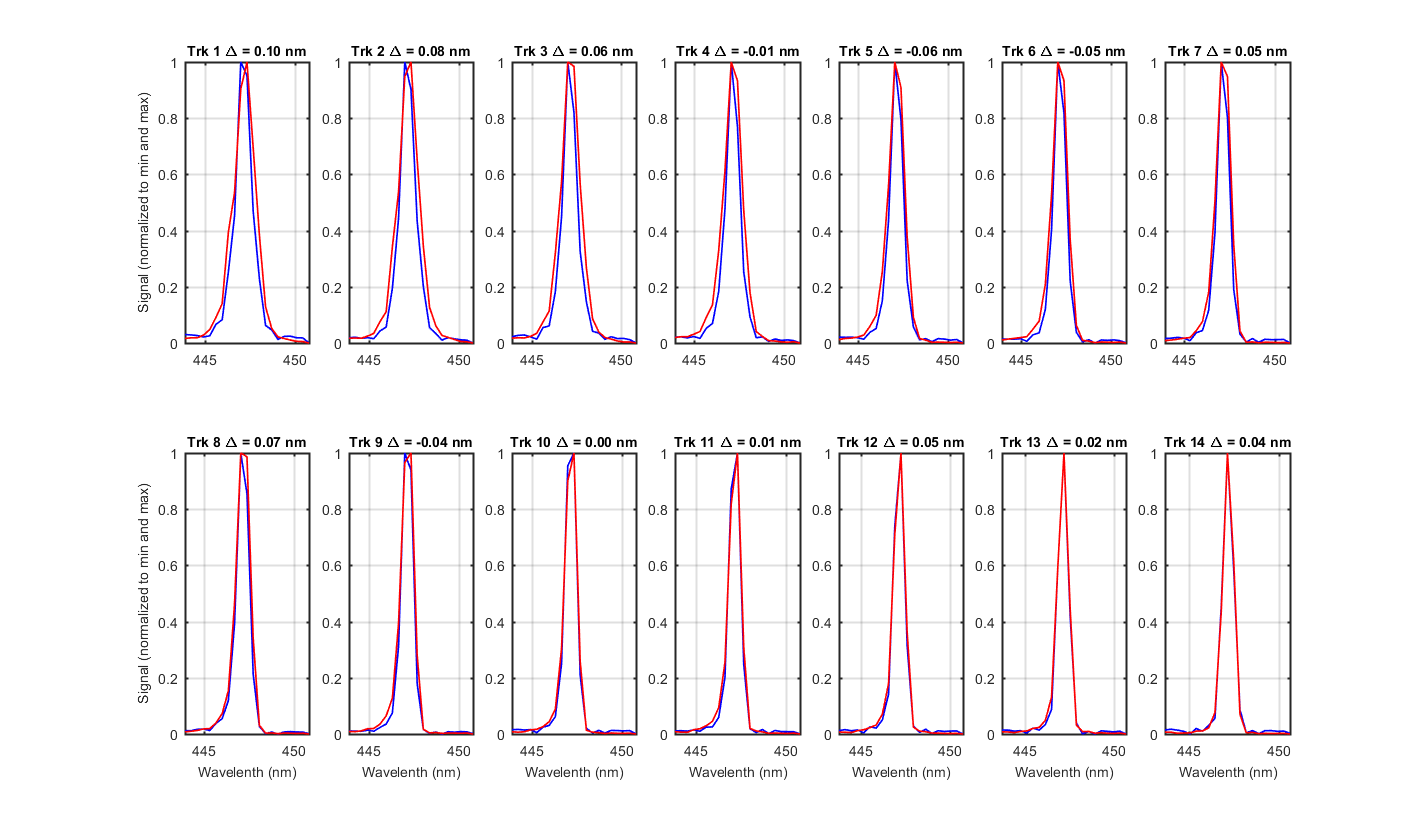
Figure 3 Helium line 447.148 nm @ pixel 282 for all 14 tracks The delta in the title is the number of nm a gaussian fit says the peak moved
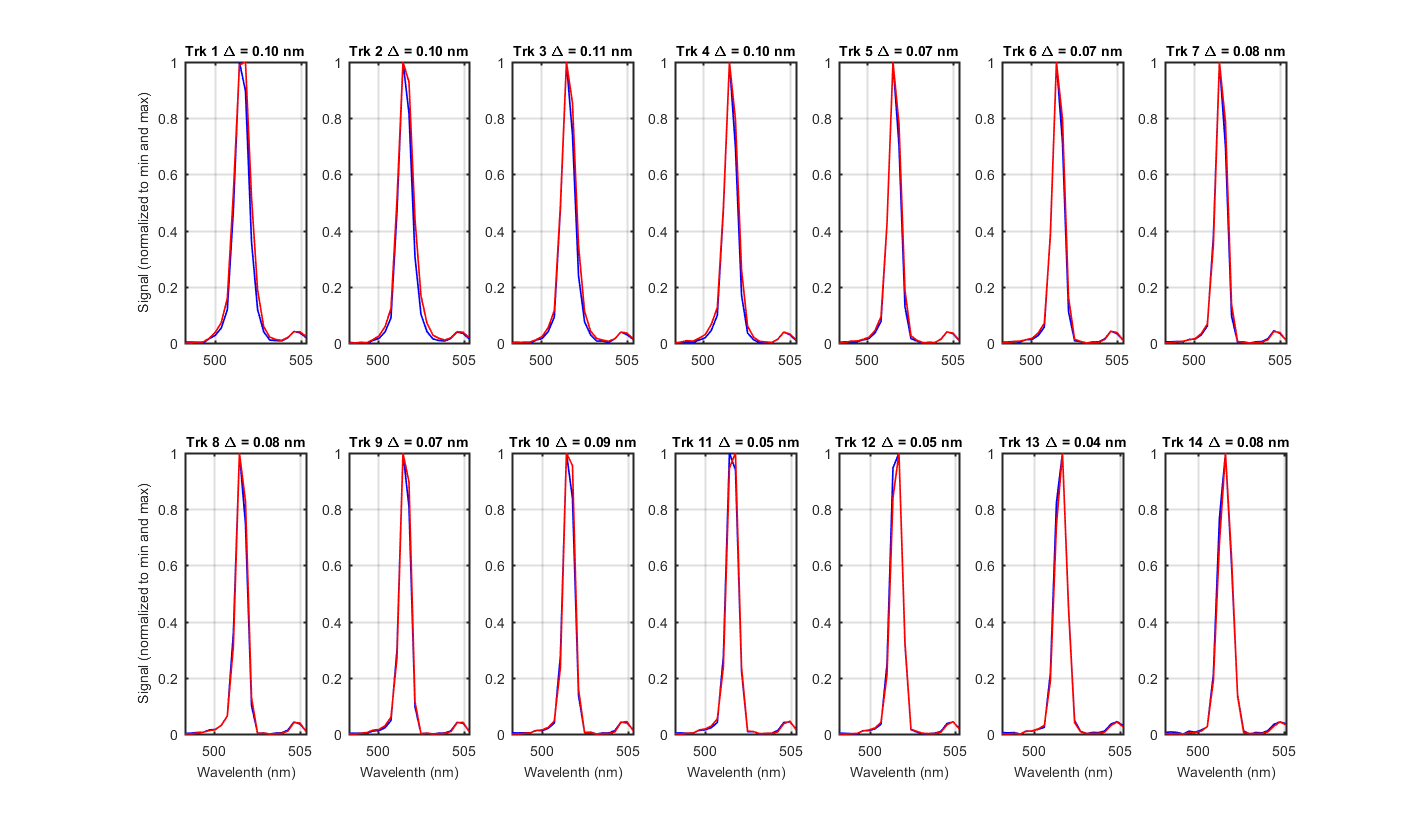
Figure 4 Helium line 501.5678 nm @ pixel 438 for all 14 tracks The delta in the title is the number of nm a gaussian fit says the peak moved
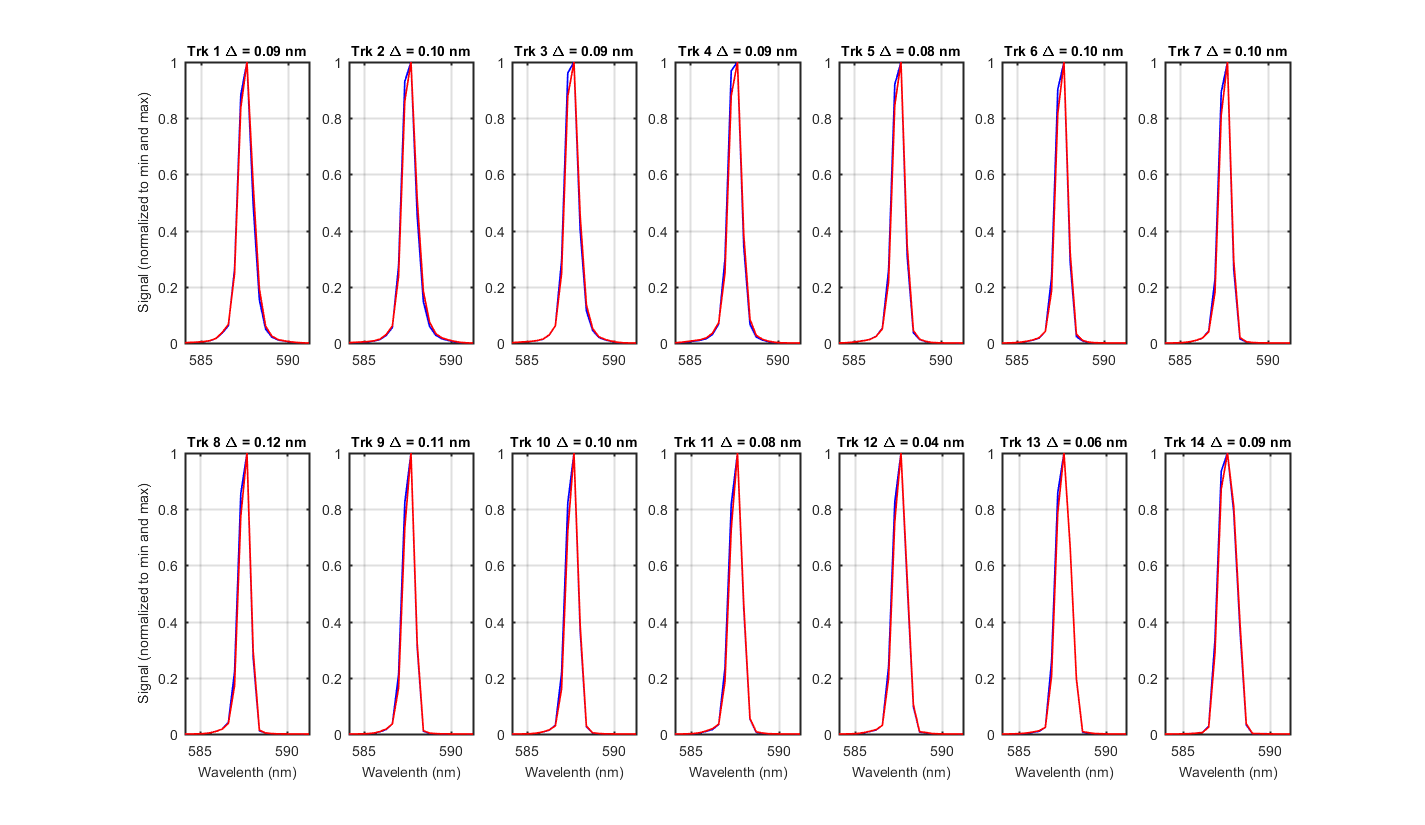
Figure 5 Helium line 587.56 nm @ pixel 681 for all 14 tracks The delta in the title is the number of nm a gaussian fit says the peak moved
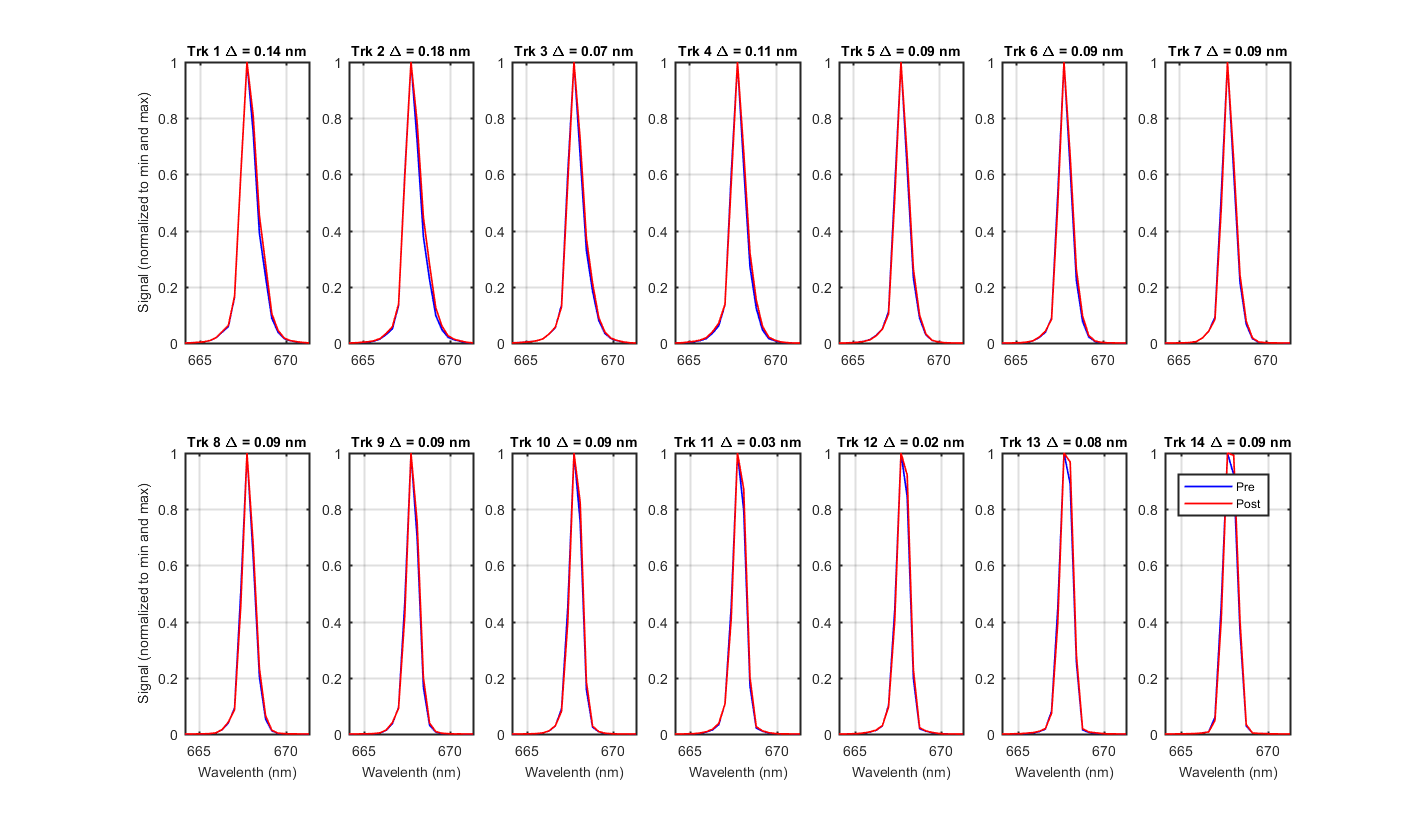
Figure 6
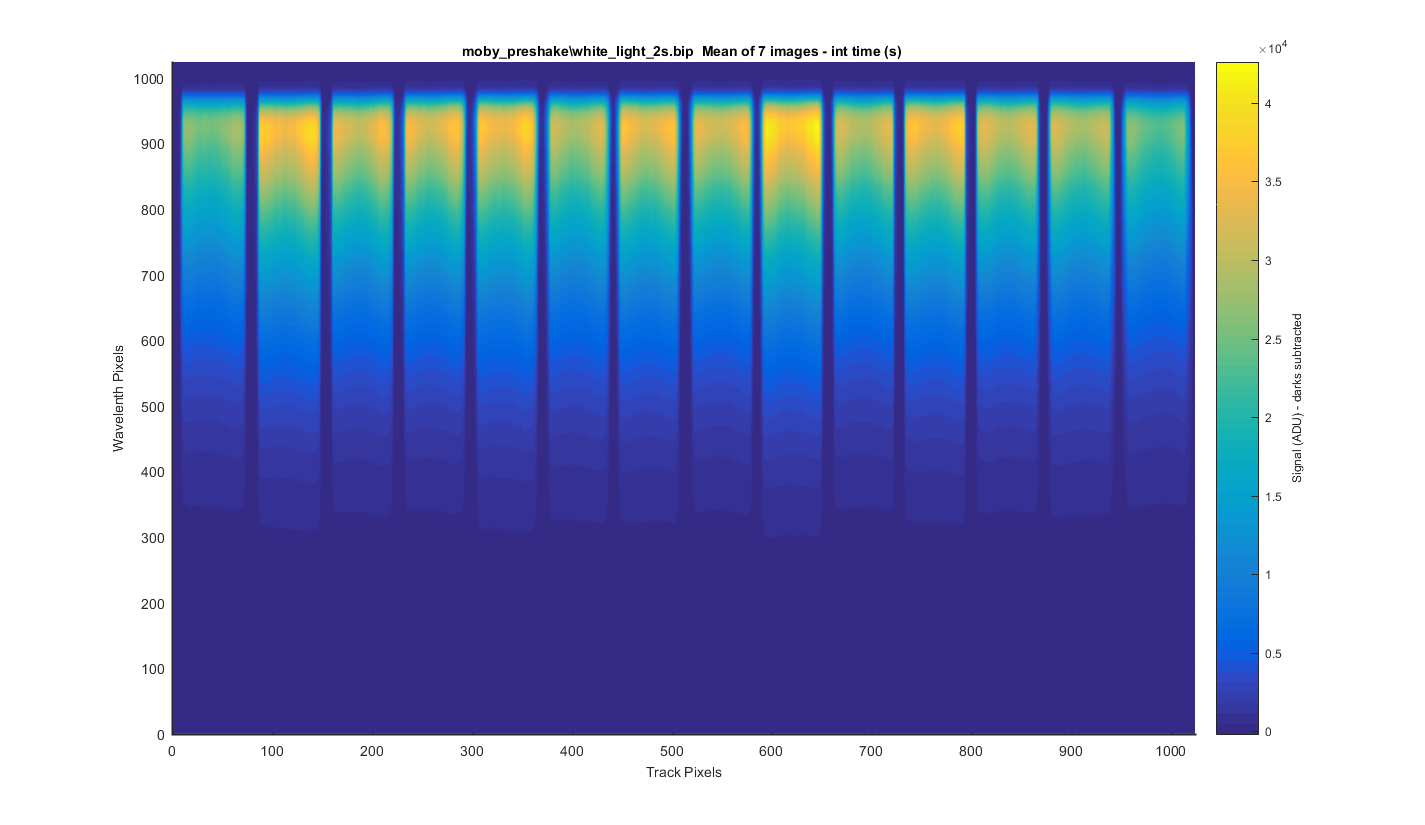
Figure 7
LOOKING AT TRACK MOVEMENT------------------------------------------------------------
Lamp data collected before shaking
| Track | Pre-shaking Left |
Post-shaking Left |
Pre-shaking Right |
Post-shaking Right |
Left Change (pix) | Right Change (pix) | Width Change (pix) |
|---|---|---|---|---|---|---|---|
| 1 | 9.55 | 9.33 | 72.86 | 72.73 | -0.22 | -0.14 | 0.086 |
| 2 | 86.16 | 85.85 | 147.91 | 147.79 | -0.31 | -0.12 | 0.186 |
| 3 | 159.78 | 159.51 | 220.66 | 220.58 | -0.27 | -0.09 | 0.188 |
| 4 | 232.37 | 232.12 | 292.61 | 292.57 | -0.25 | -0.04 | 0.211 |
| 5 | 304.53 | 304.23 | 364.65 | 364.79 | -0.29 | 0.14 | 0.433 |
| 6 | 376.37 | 376.21 | 436.48 | 436.52 | -0.16 | 0.04 | 0.201 |
| 7 | 446.72 | 446.61 | 506.73 | 506.79 | -0.12 | 0.06 | 0.177 |
| 8 | 520.22 | 520.06 | 580.18 | 580.30 | -0.16 | 0.13 | 0.289 |
| 9 | 590.25 | 590.15 | 650.17 | 650.34 | -0.09 | 0.16 | 0.256 |
| 10 | 661.94 | 661.94 | 722.13 | 722.26 | 0.00 | 0.13 | 0.129 |
| 11 | 732.92 | 732.89 | 793.53 | 793.67 | -0.03 | 0.14 | 0.169 |
| 12 | 804.88 | 804.98 | 866.41 | 866.48 | 0.09 | 0.07 | -0.023 |
| 13 | 877.84 | 877.80 | 940.85 | 940.58 | -0.04 | -0.27 | -0.229 |
| 14 | 952.49 | 952.34 | 1016.50 | 1016.28 | -0.16 | -0.22 | -0.067 |
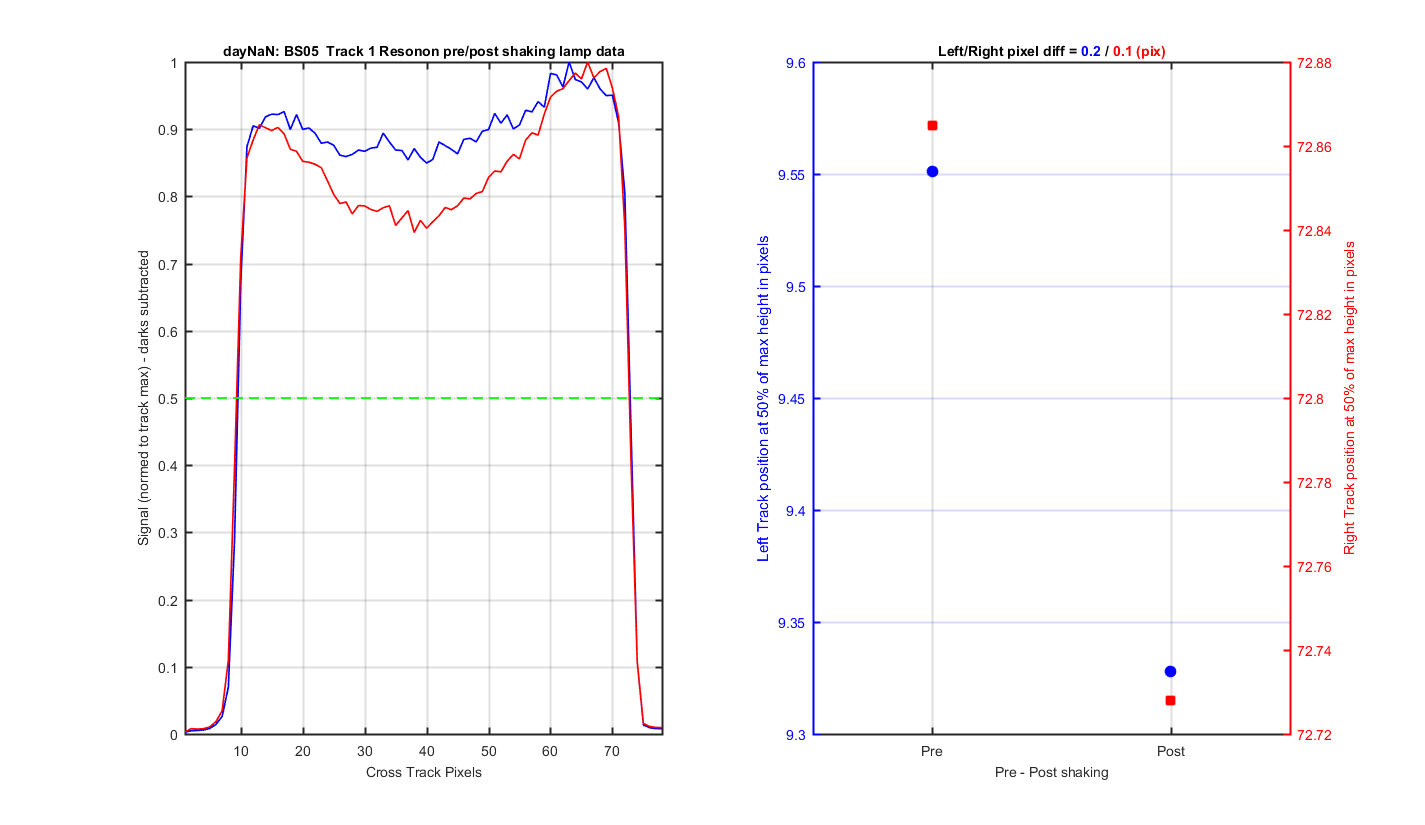
Figure 8
The track movement image for Track 1 from the lamp data.
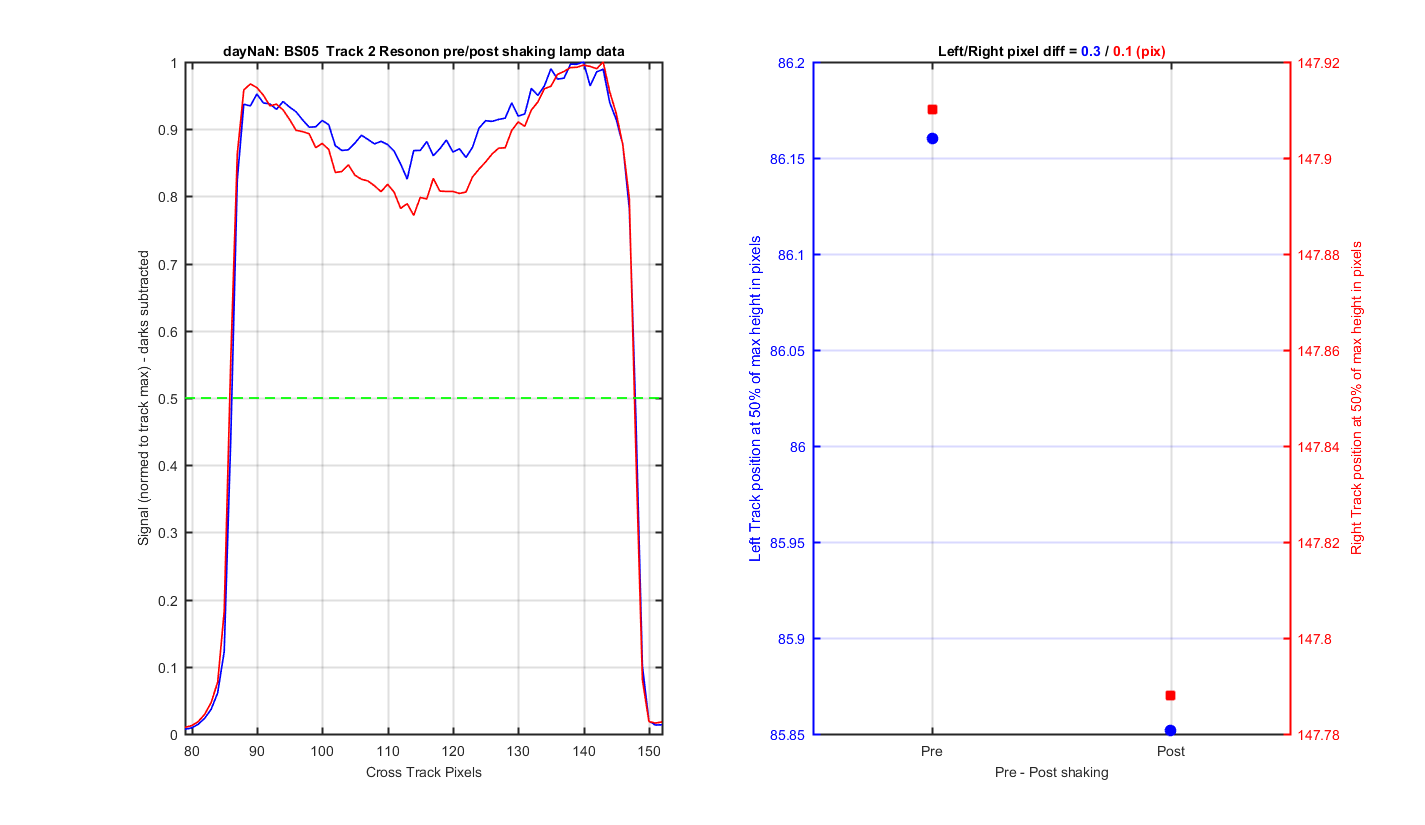
Figure 9
The track movement image for Track 2 from the lamp data.
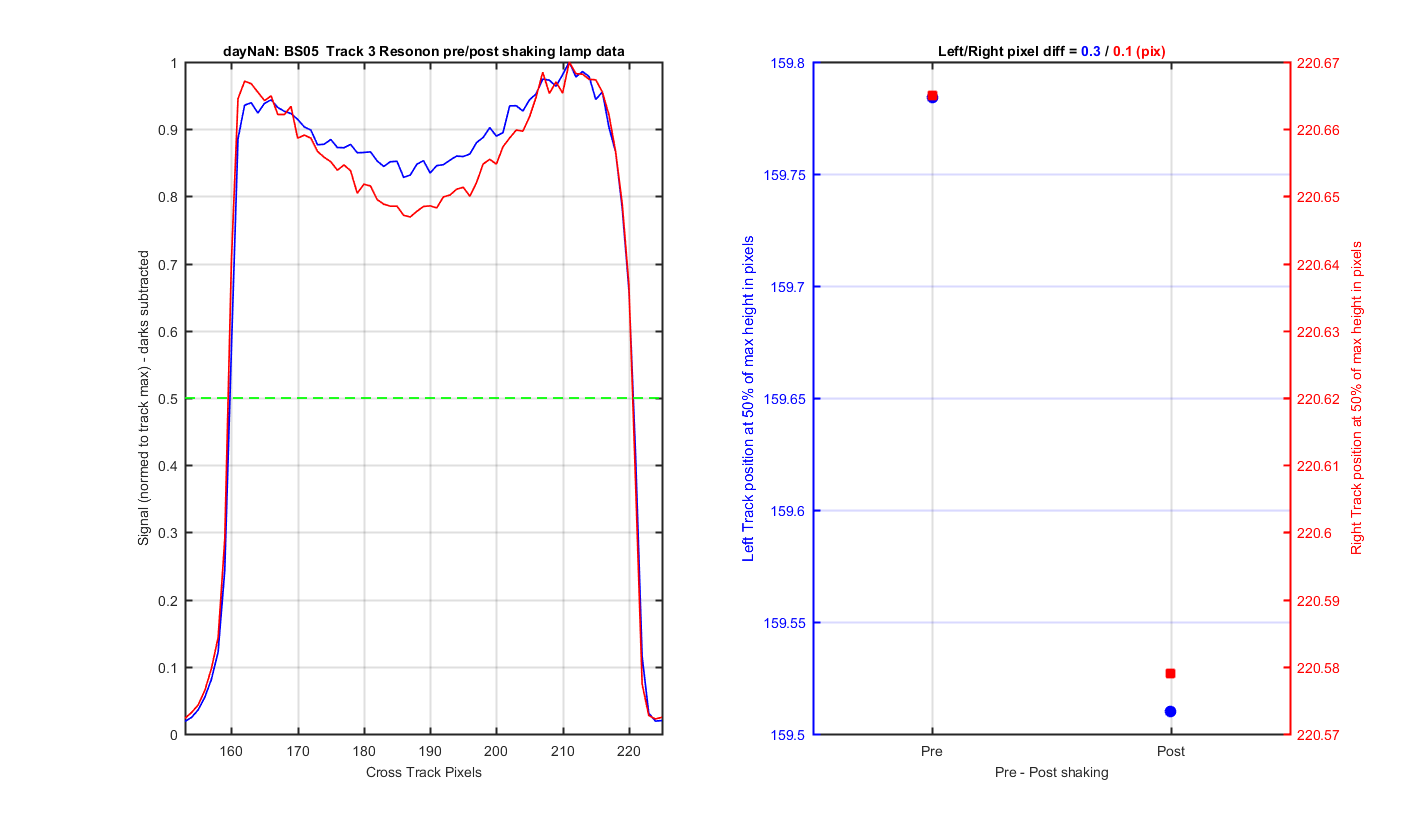
Figure 10
The track movement image for Track 3 from the lamp data.
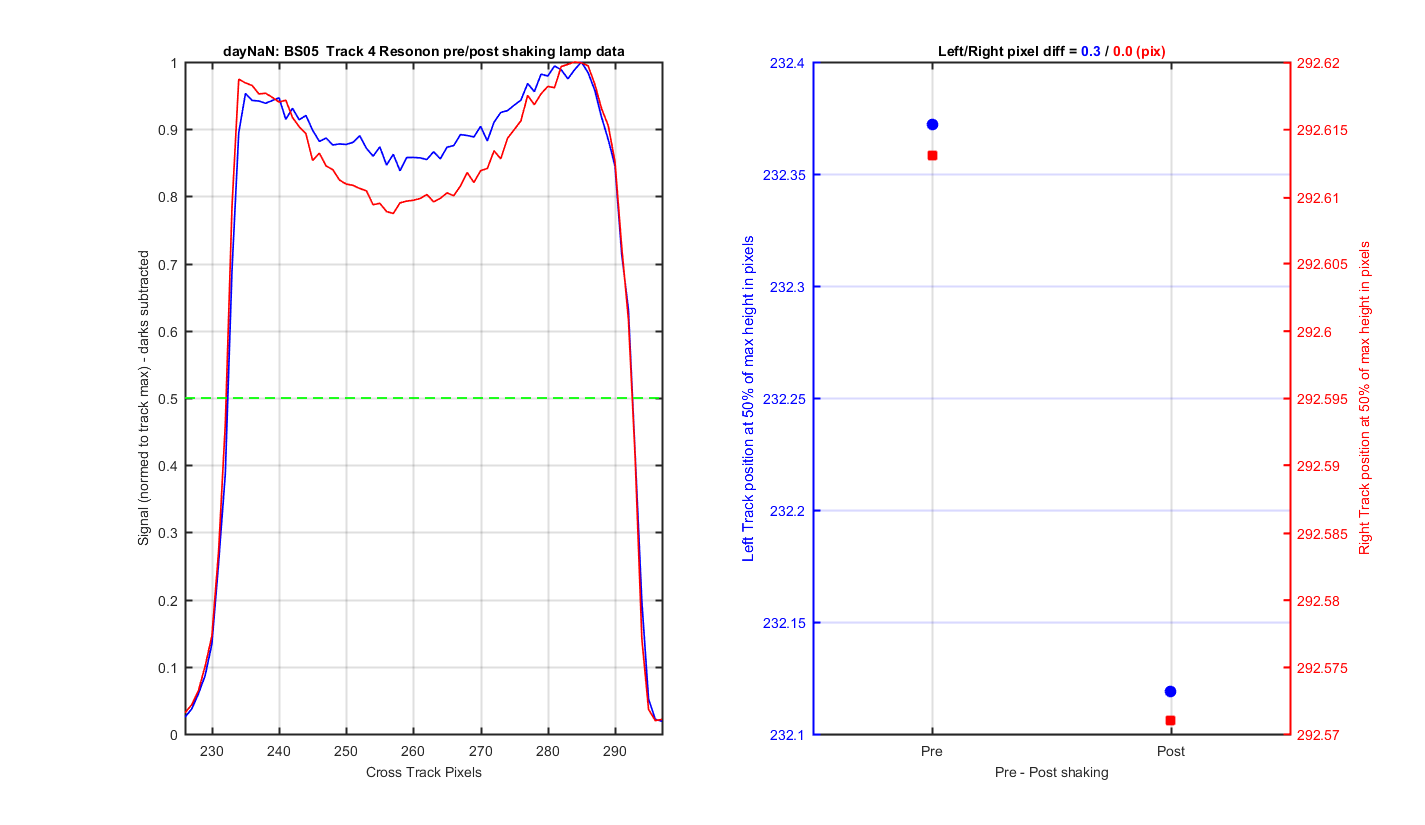
Figure 11
The track movement image for Track 4 from the lamp data.
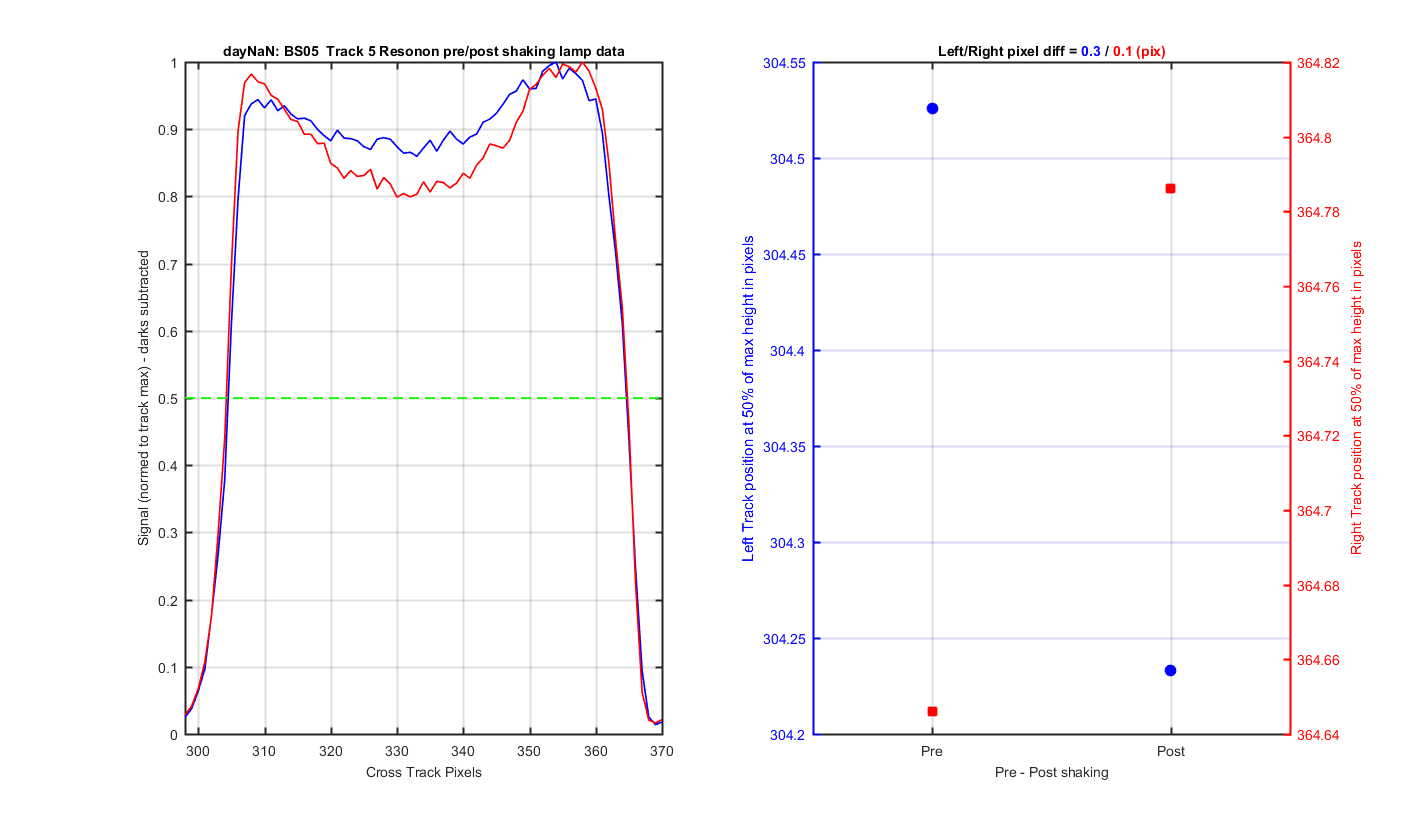
Figure 12
The track movement image for Track 5 from the lamp data.
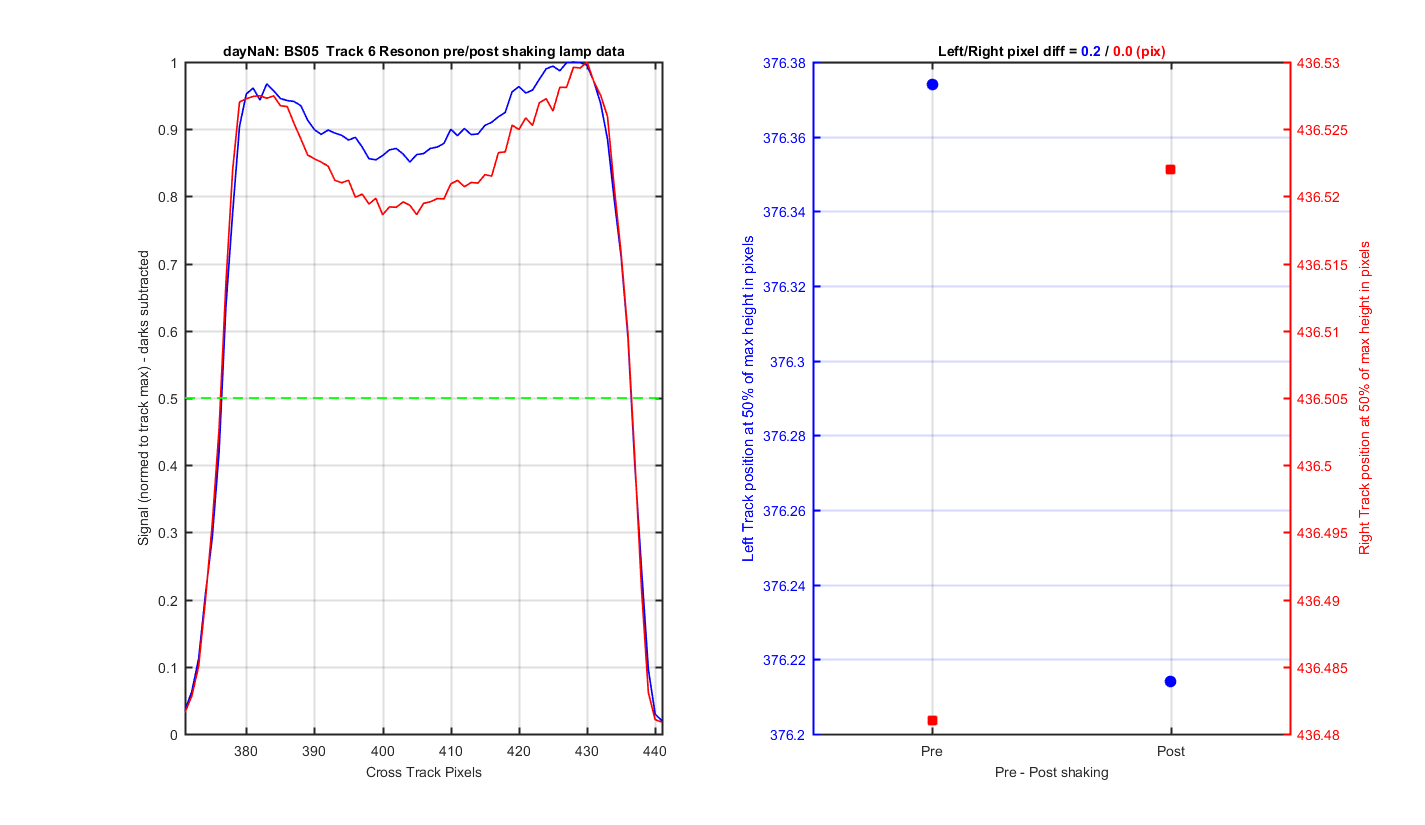
Figure 13
The track movement image for Track 6 from the lamp data.
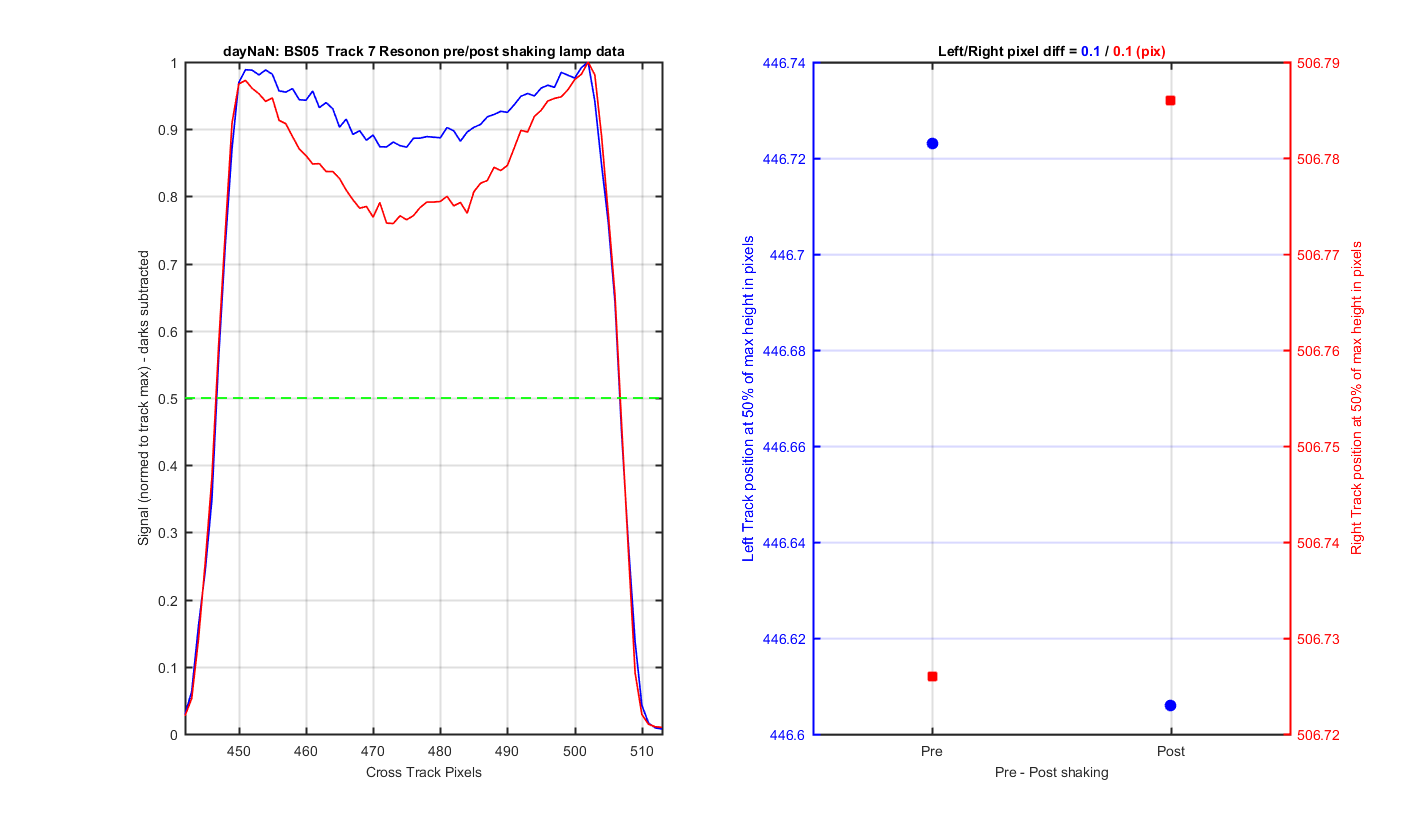
Figure 14
The track movement image for Track 7 from the lamp data.
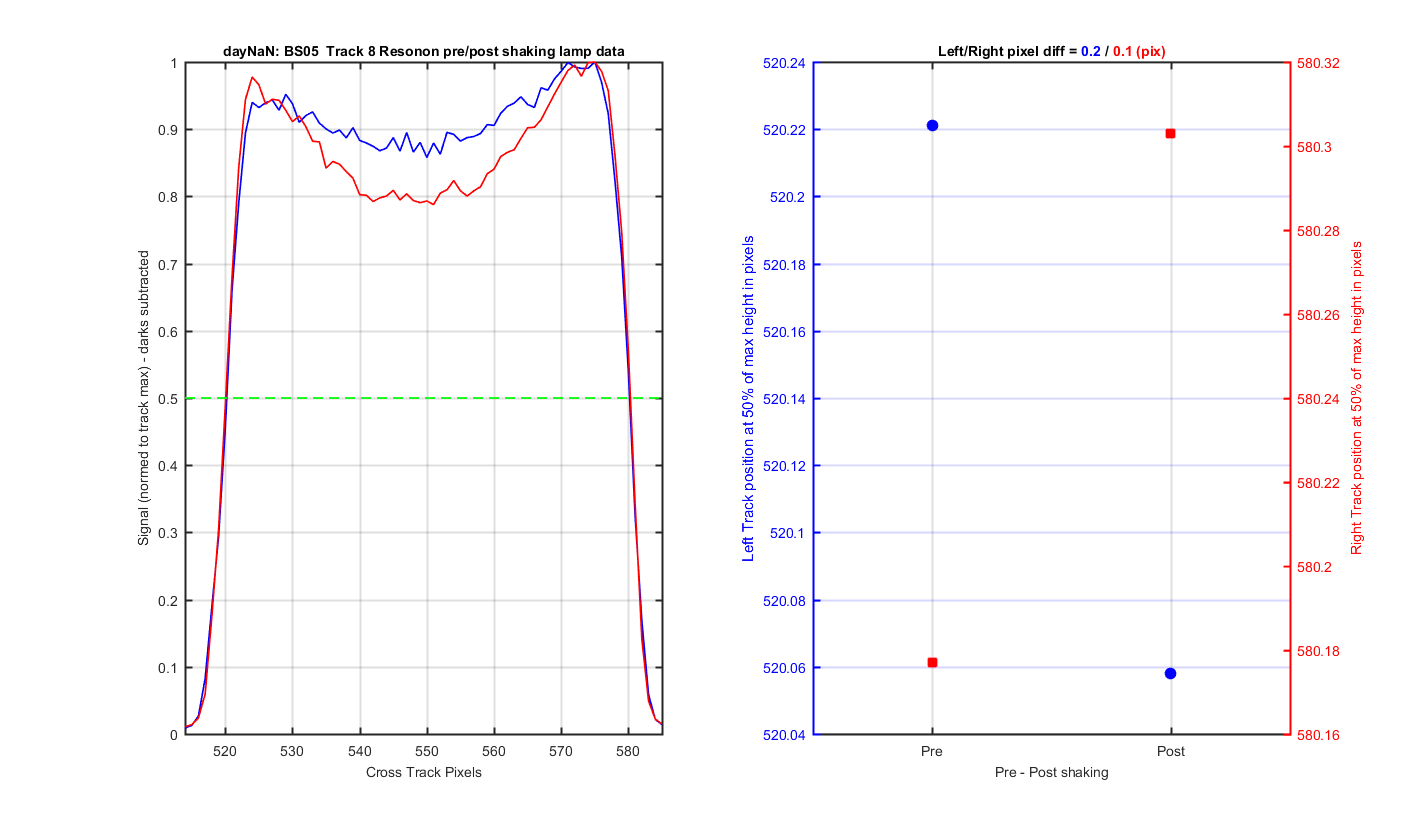
Figure 15
The track movement image for Track 8 from the lamp data.
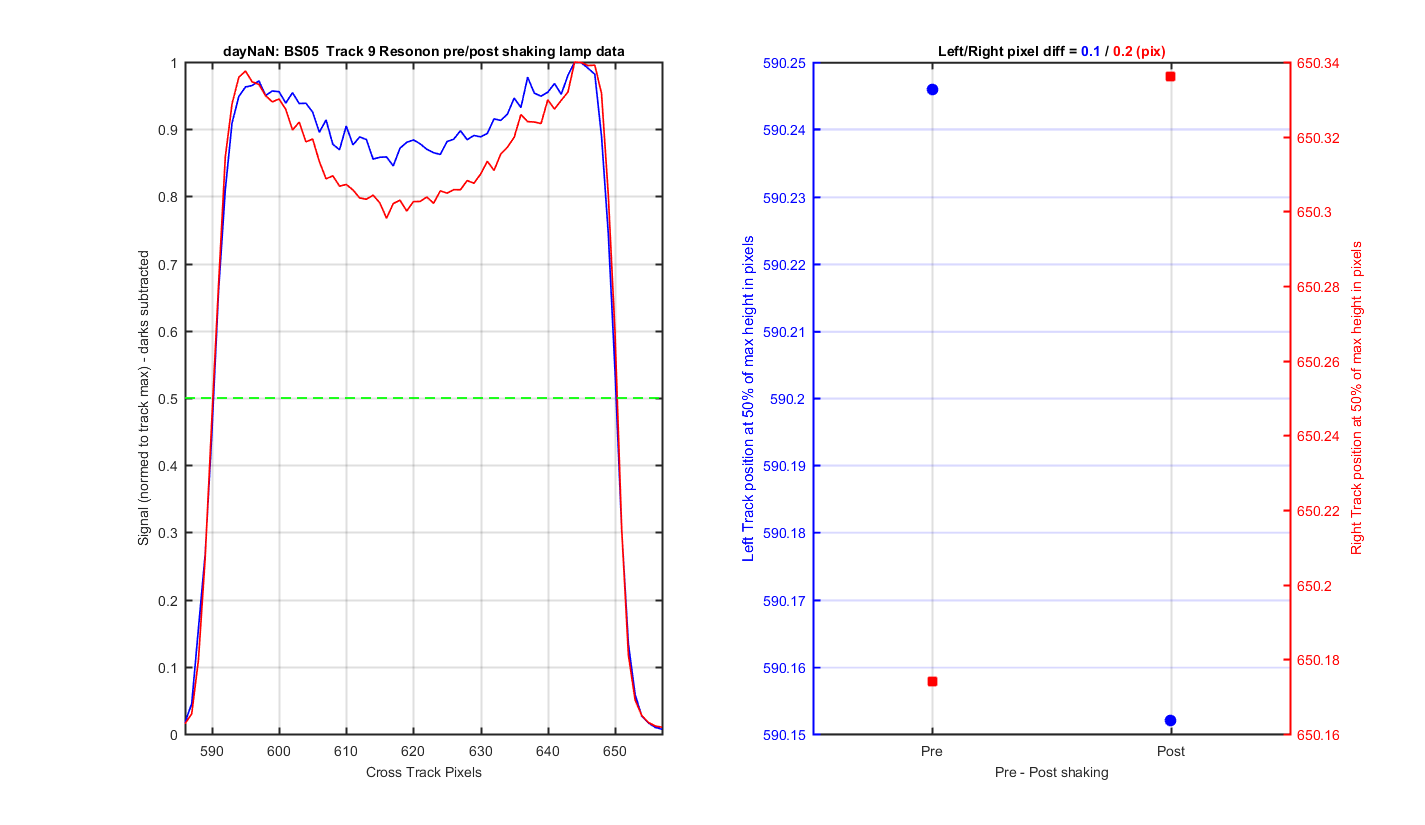
Figure 16
The track movement image for Track 9 from the lamp data.
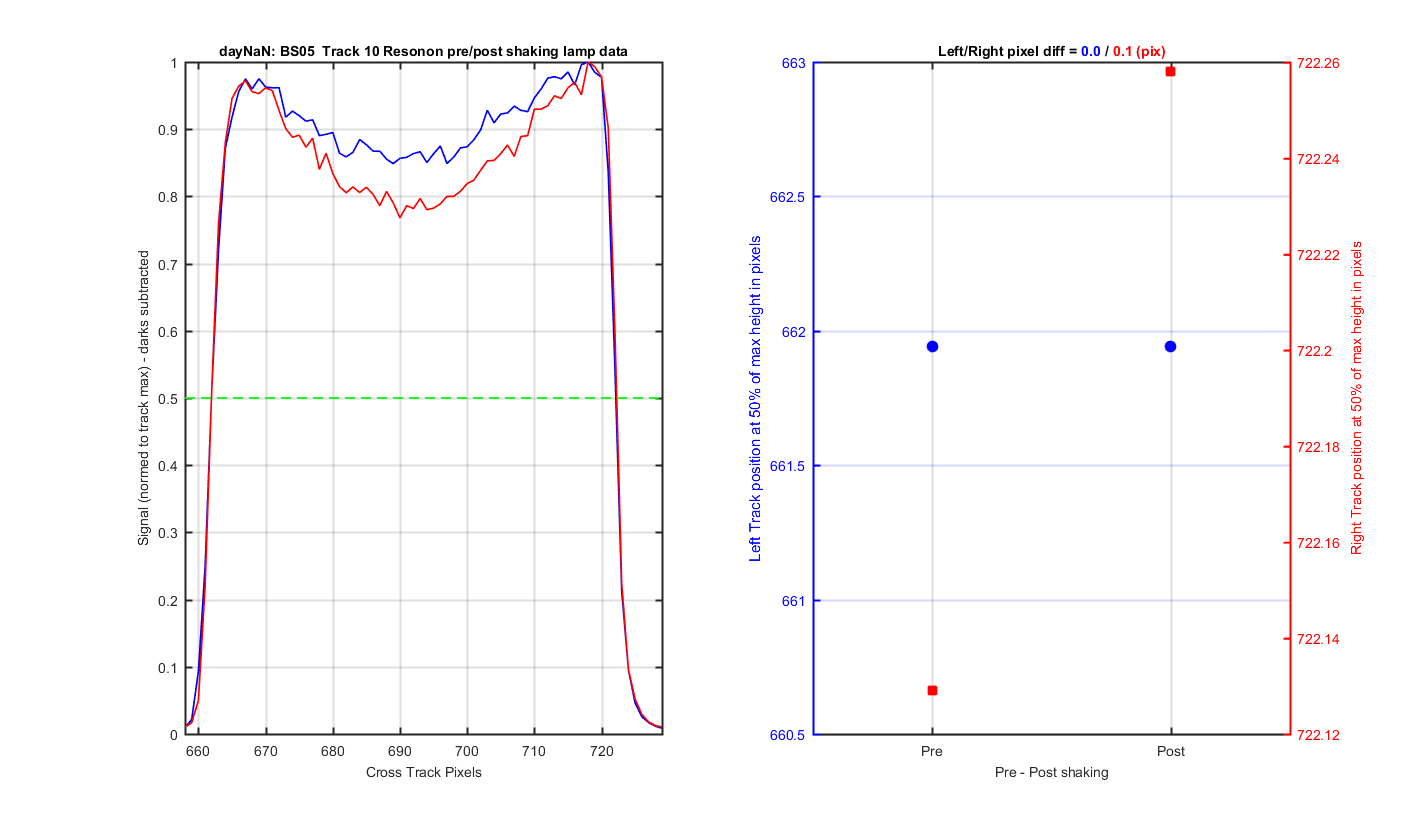
Figure 17
The track movement image for Track 10 from the lamp data.
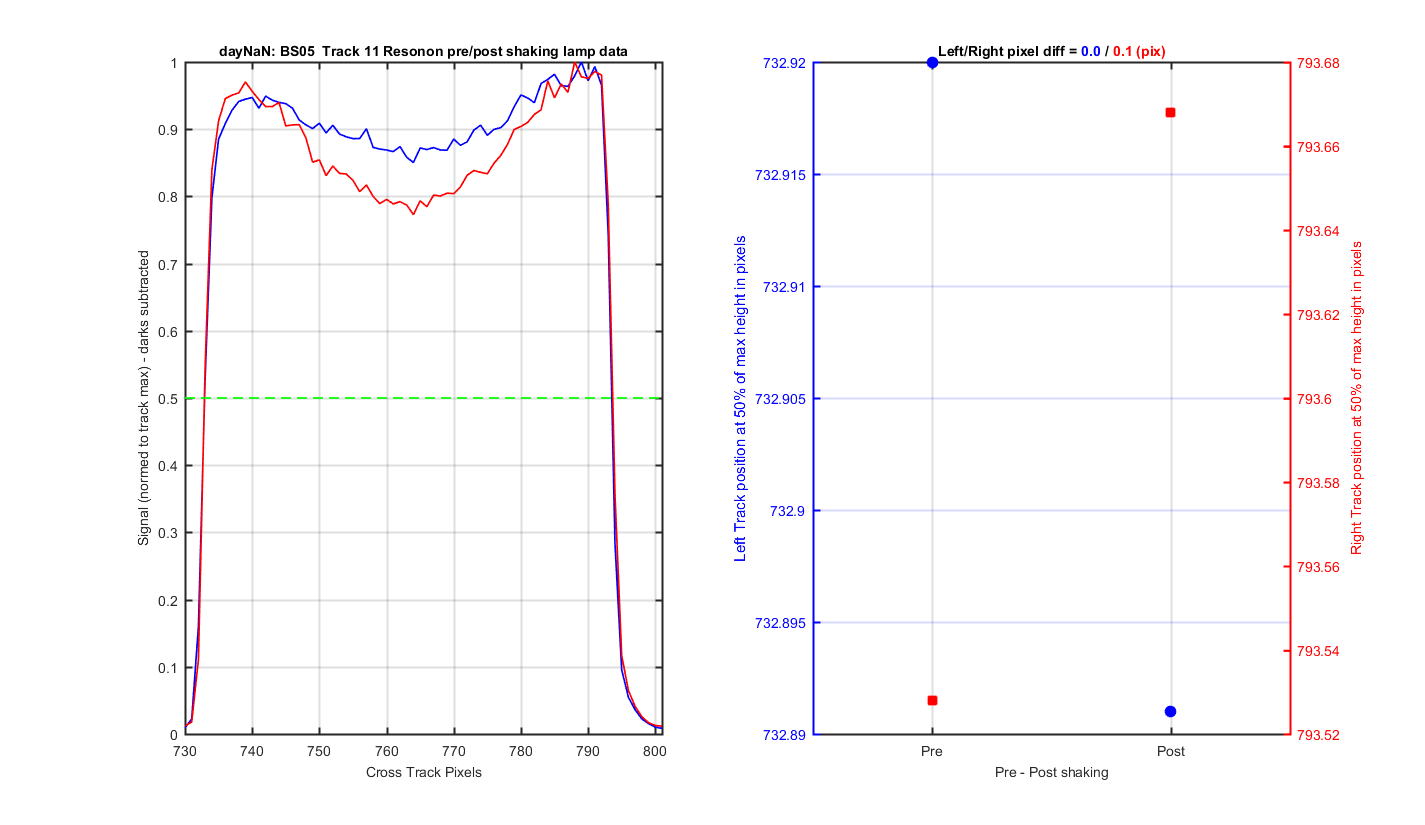
Figure 18
The track movement image for Track 11 from the lamp data.
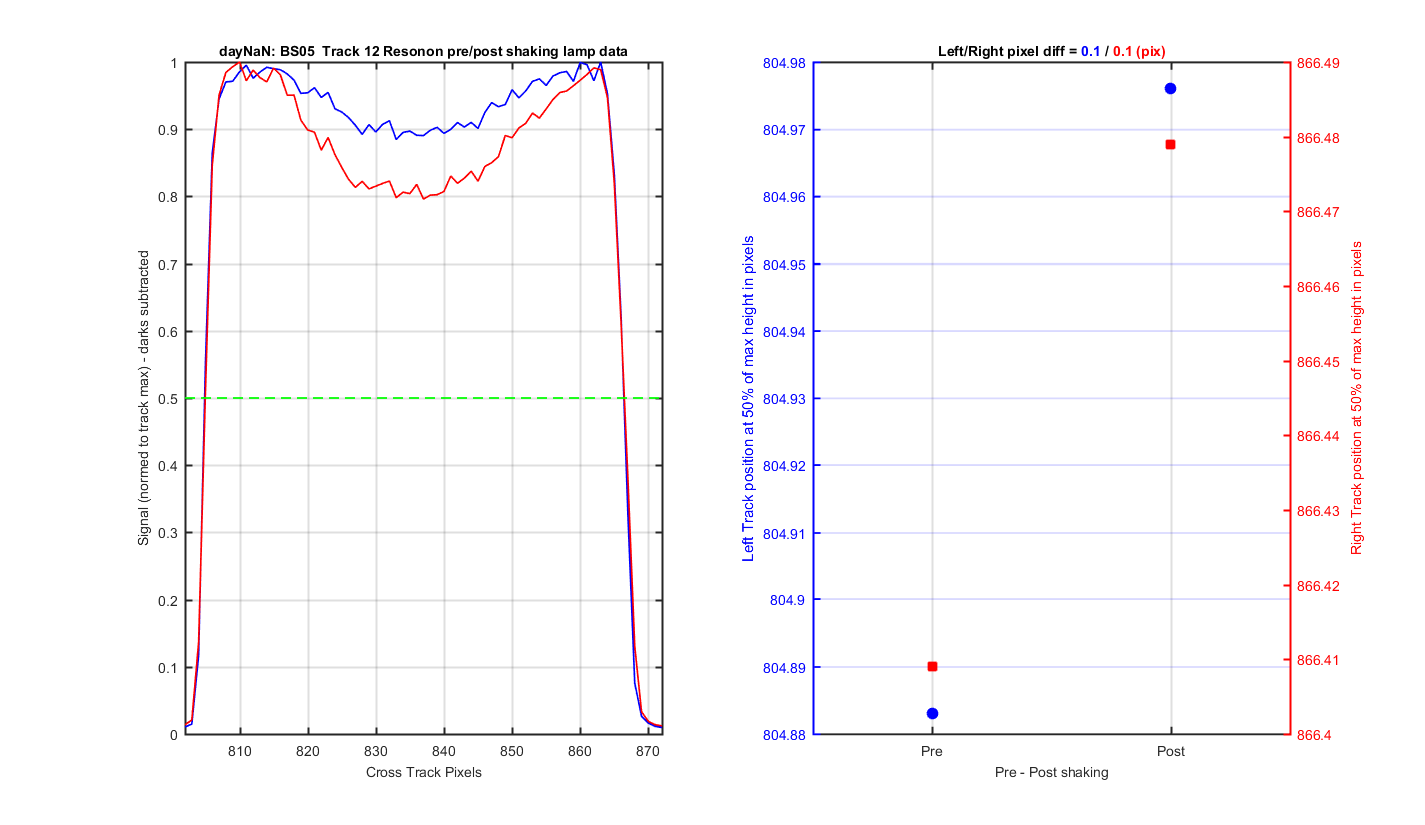
Figure 19
The track movement image for Track 12 from the lamp data.
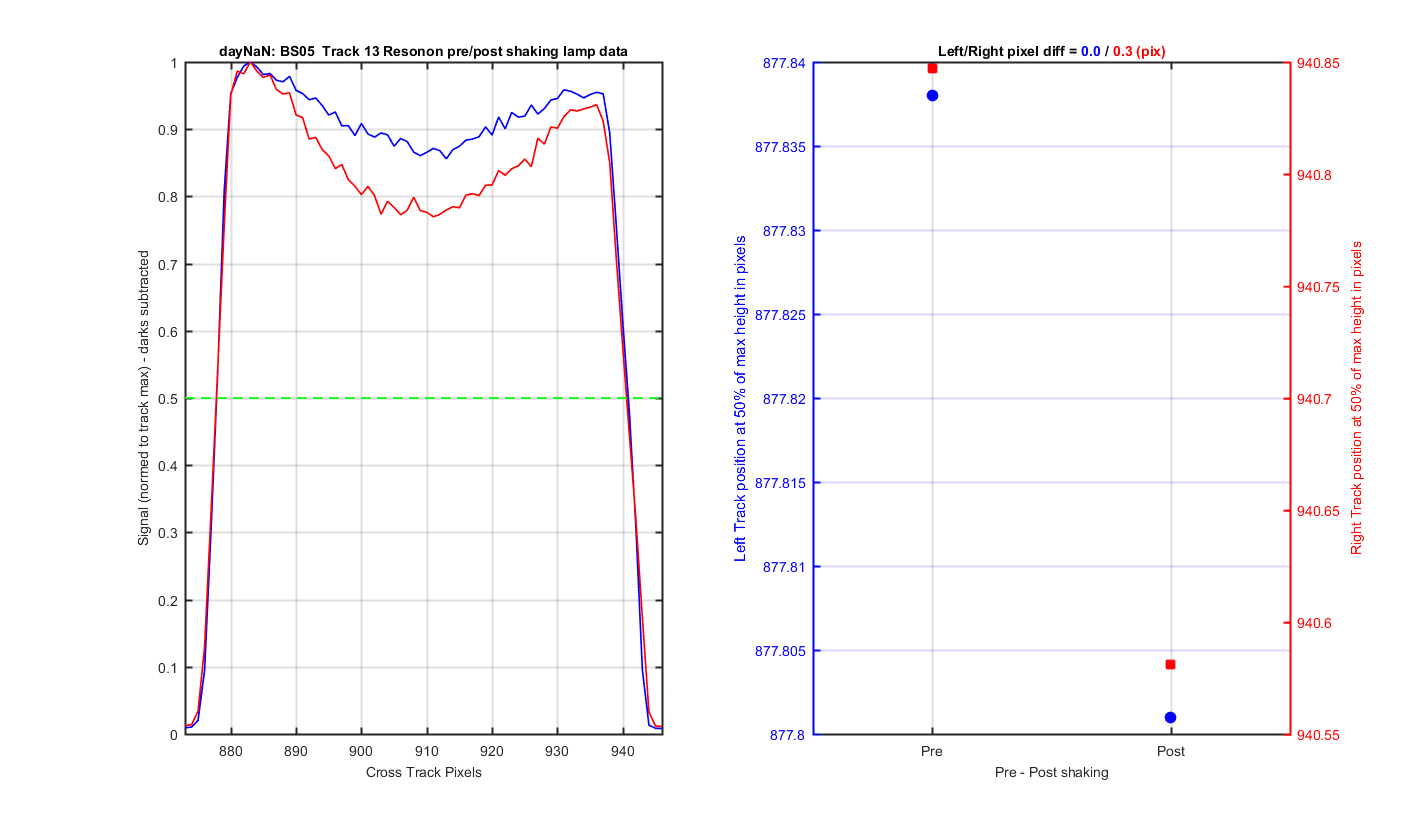
Figure 20
The track movement image for Track 13 from the lamp data.
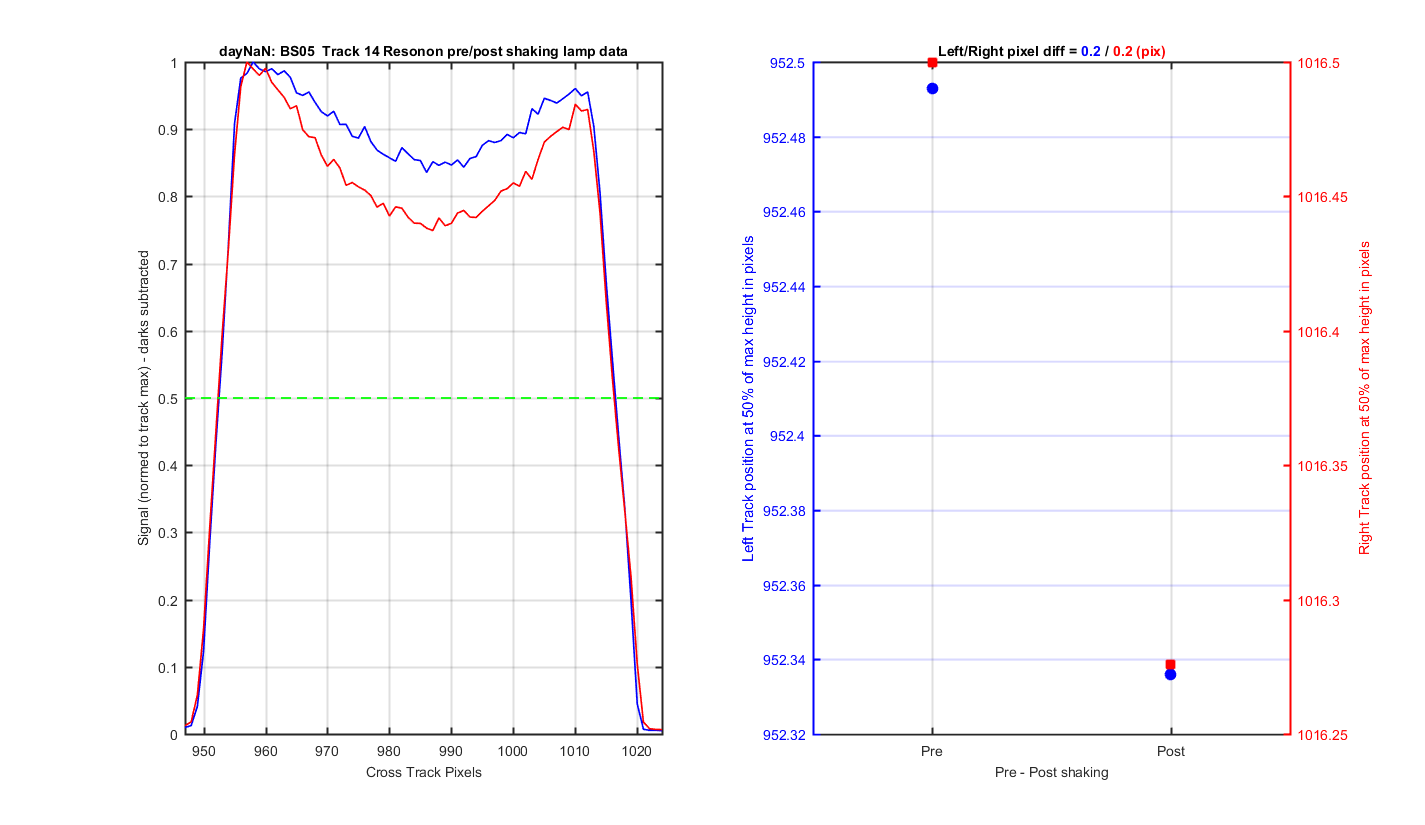
Figure 21
The track movement image for Track 14 from the lamp data.