REVISION DATE: 13-Dec-2016 12:39:33
Email from Mike Kehoe on 11/29/2016 8:43 AM:
Greetings All,

Casey has assembled RS5.  Please find report attached.  The test data are at the usual location, dated 11/28/16. The system is ready to ship, upon request.

This is the last Red system.  Whew -- that was harder than I thought!  We have three blue systems yet to ship.  In order to proceed, we need a camera.  We have one fiber bundle in stock.  All other parts are on hand.

-Mike
Below are my graphs of the mobyred_postshake_sphere.bip file. The file contains 10 dark images at 1e-05 sec Note some graphs are dark corrected and some are not so check the axis labels to know what you are looking at.
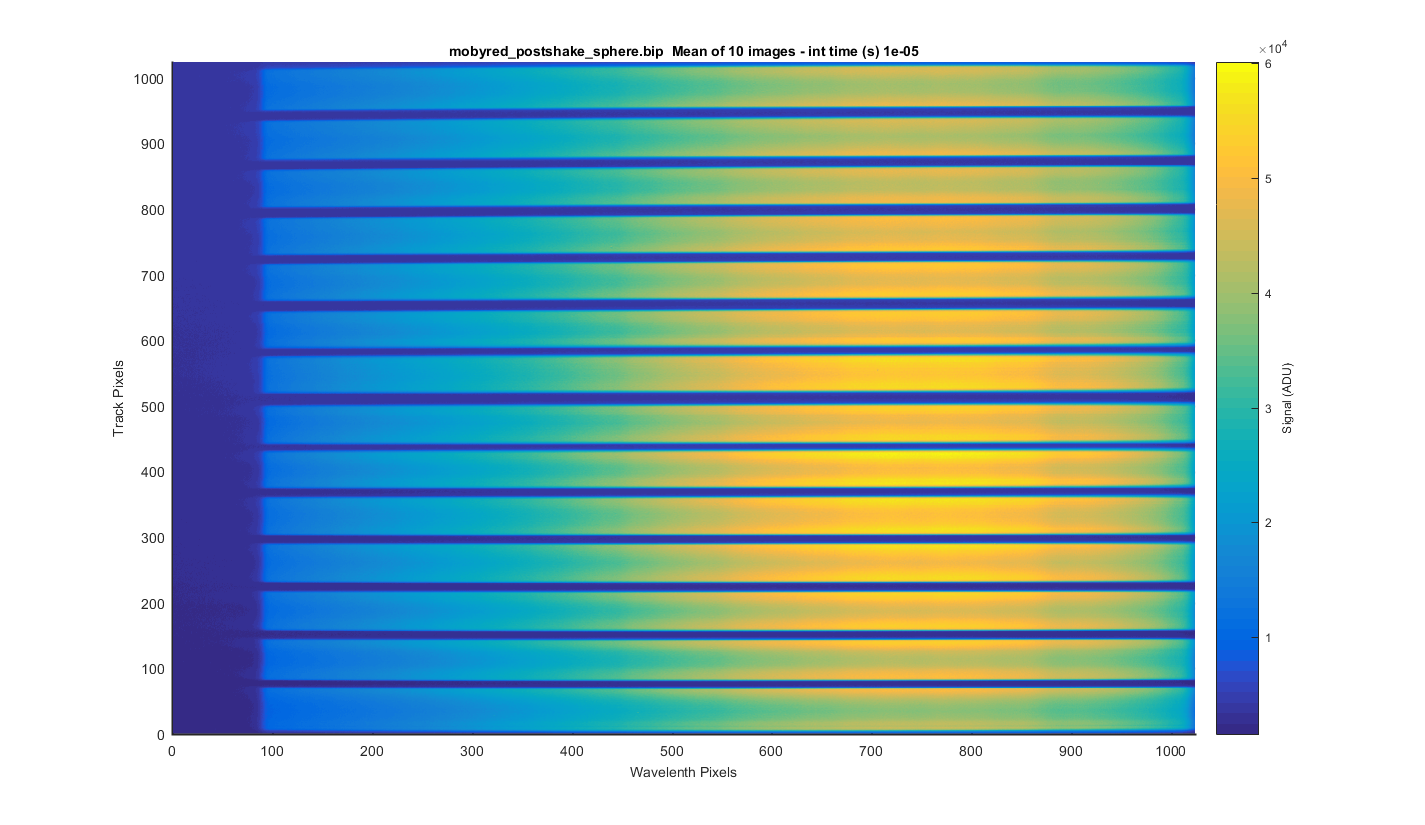
I took the 10 images and meaned them to get the surface plot below.
Figure 1
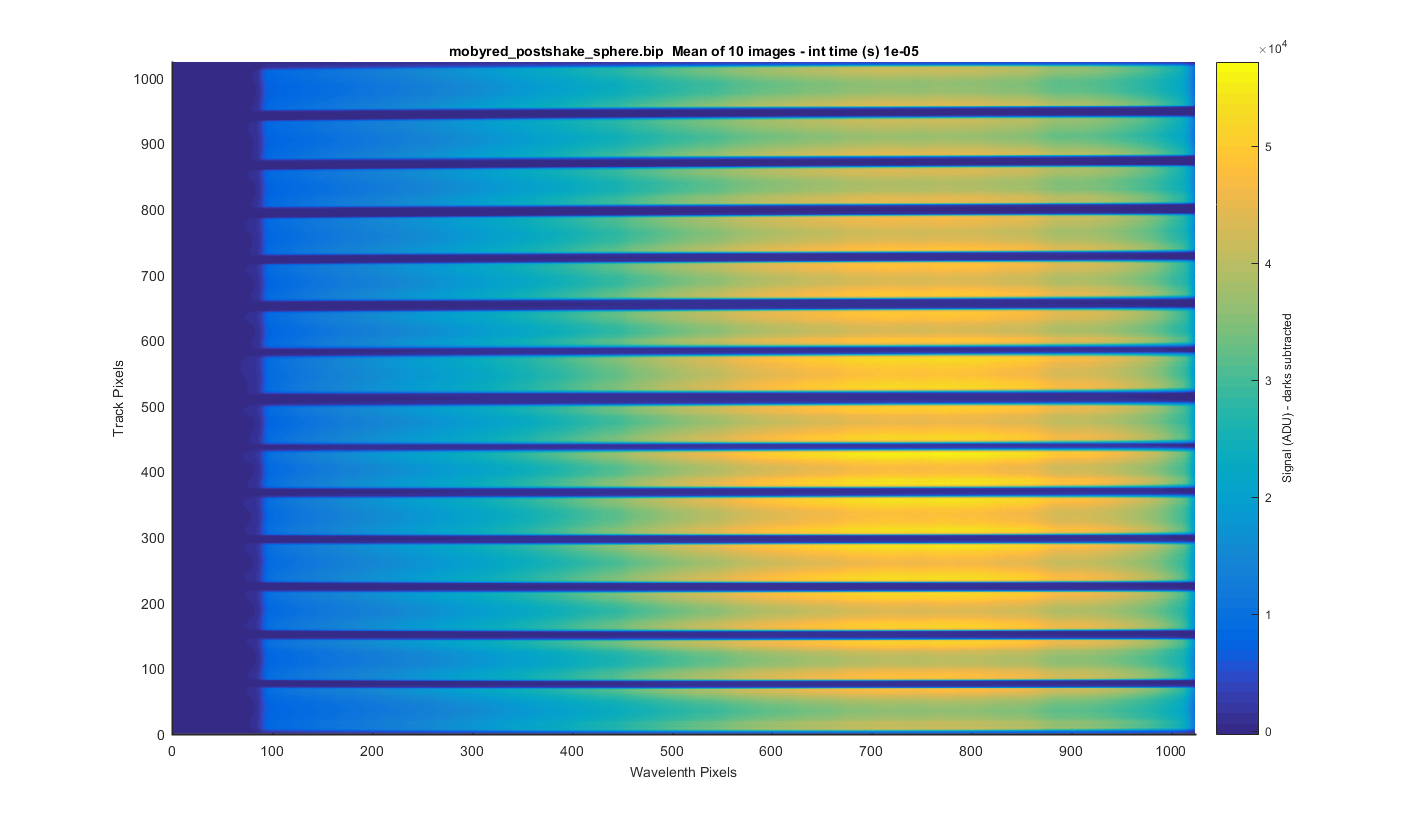
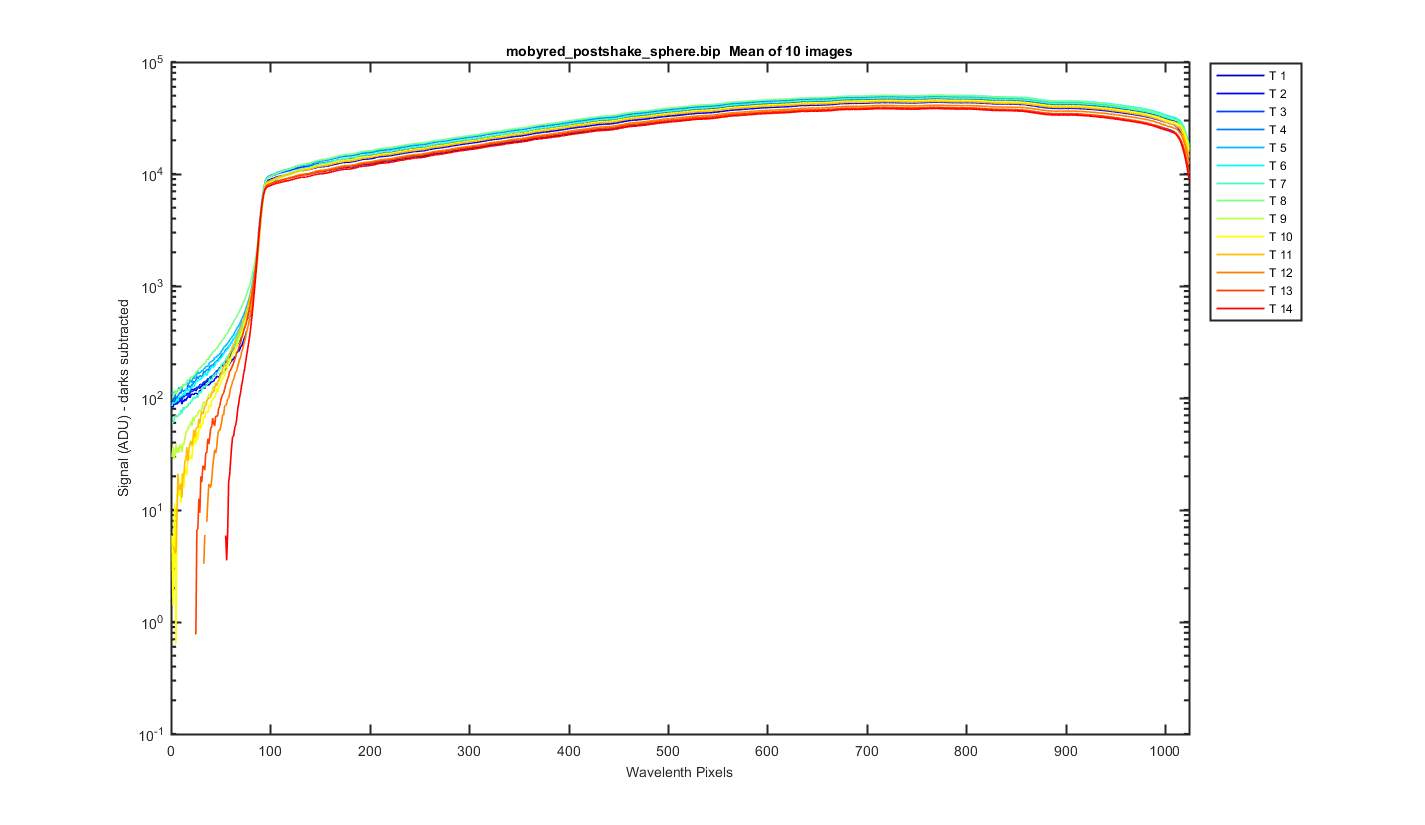
Same as the previous images but with the dark image subtracted.
Figure 2
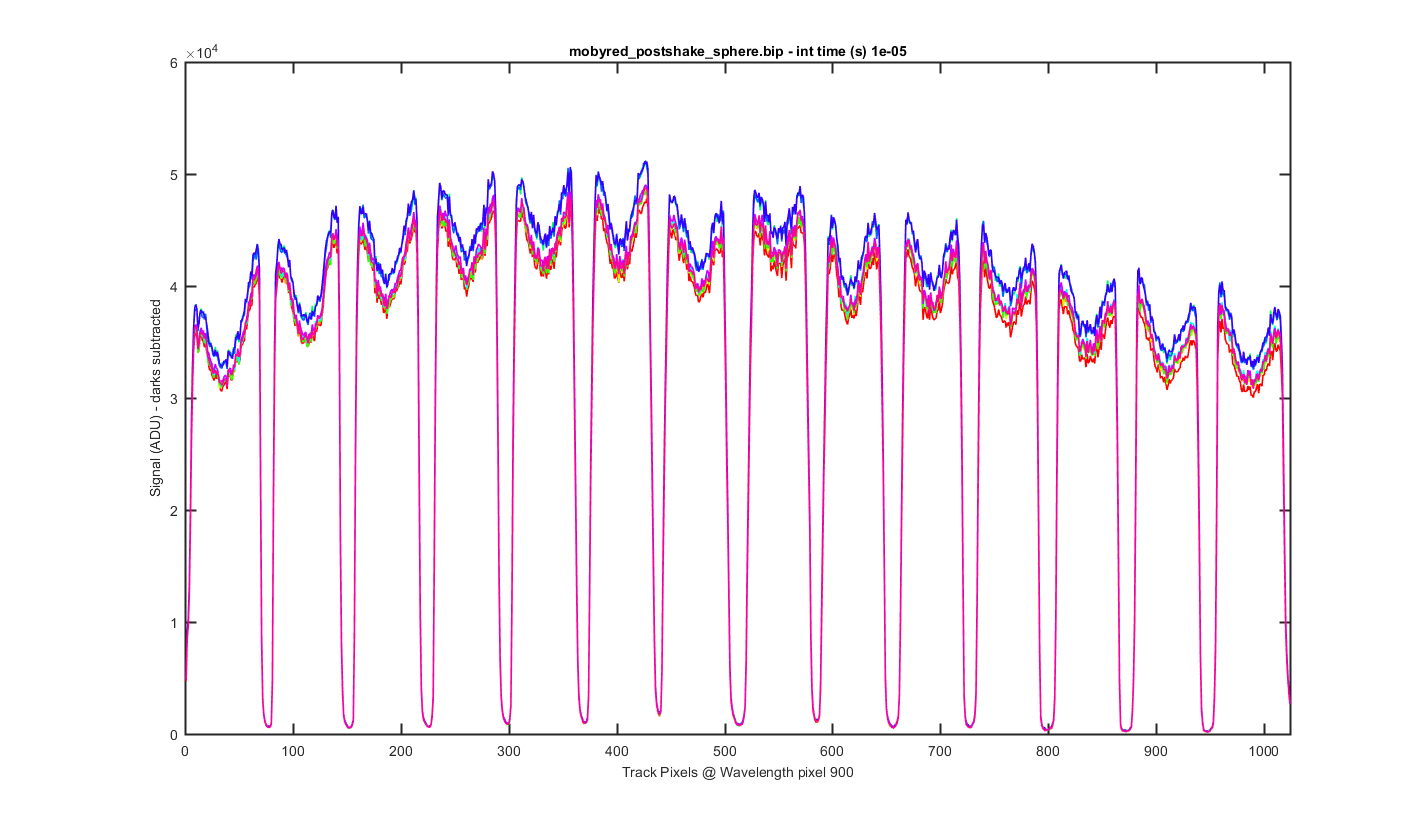
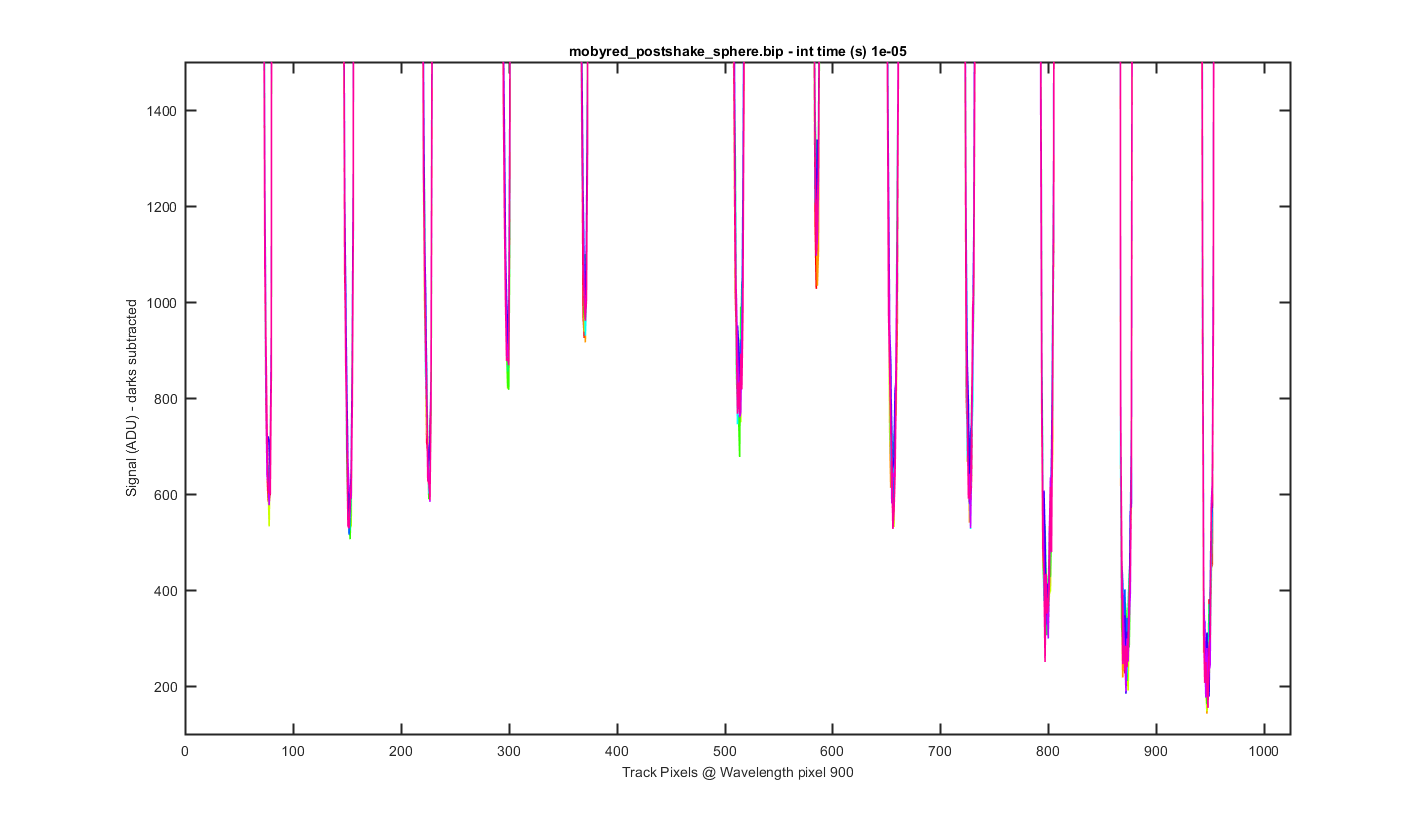
This is a cross section through the tracks at wavelength pixel 900, with one line for each of the 10 images (darks are subtracted).
Figure 3
Same as the previous graph but zoomed into the bottom to see the level of the darks between the tracks.
Figure 4
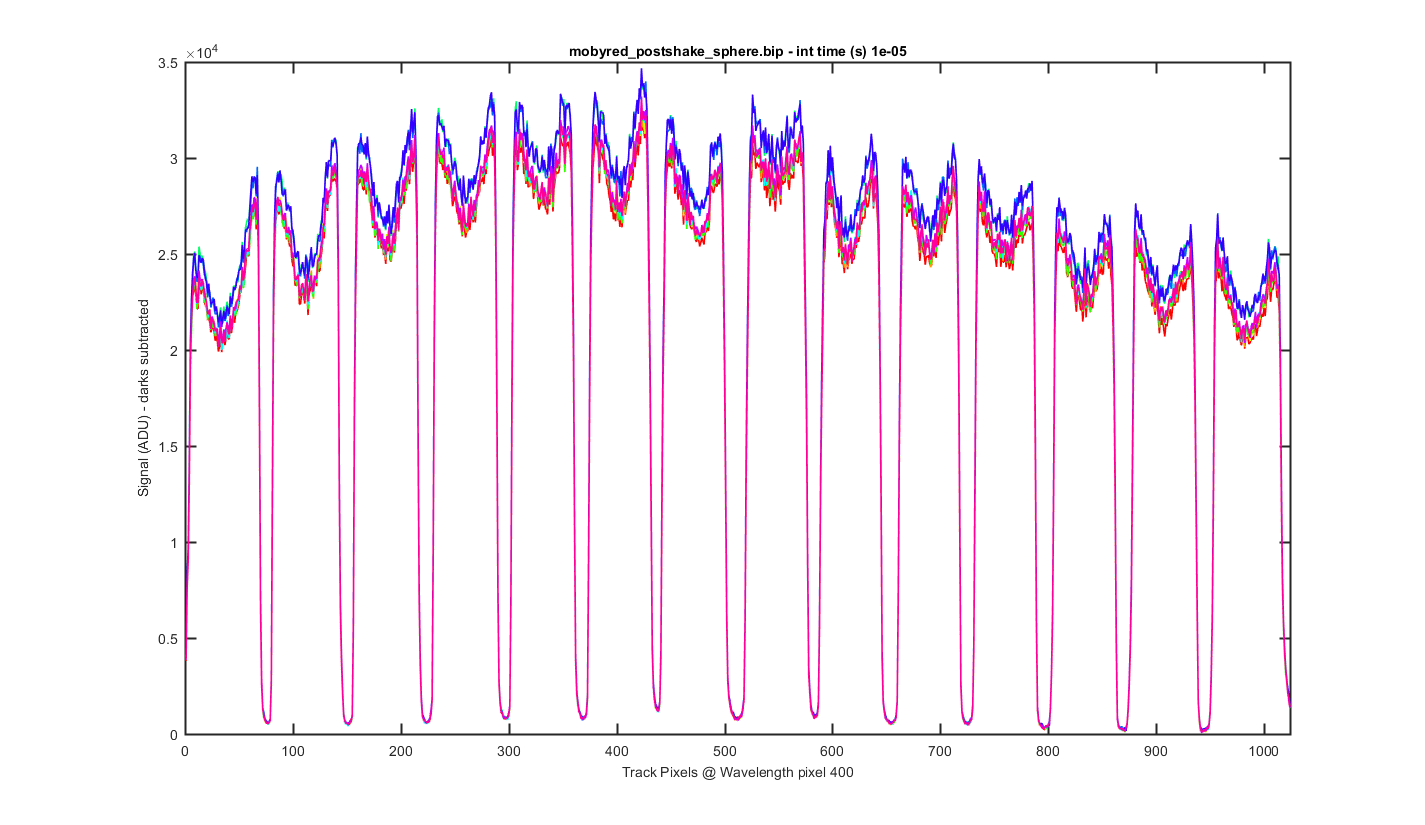
Same as figure 2 but for Wavelength pixel 400 (darks are subtracted)
Figure 5
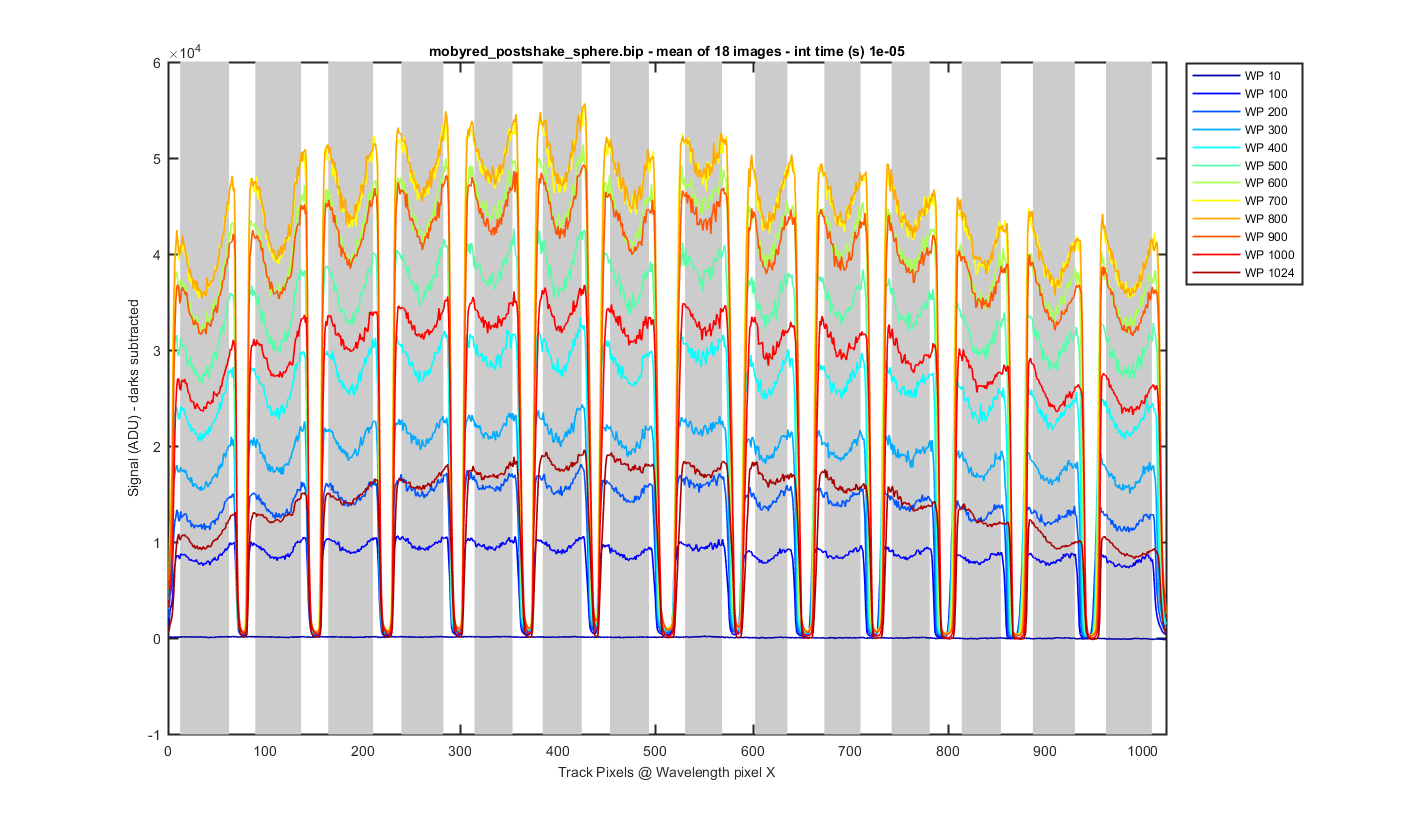
Again this is the mean image with slices thought the image at different wavelength pixels (darks are subtracted).
Figure 6
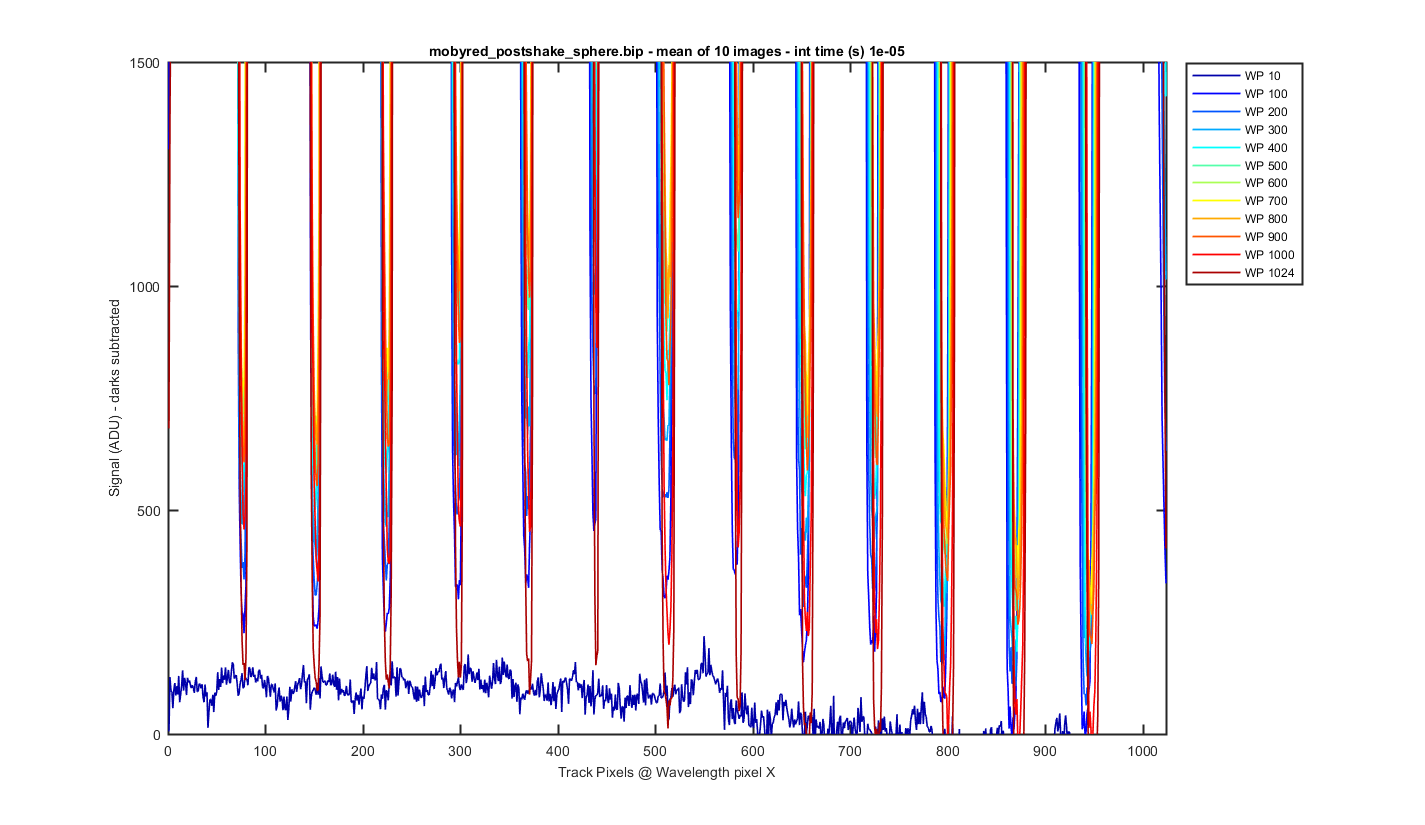
Same as figure 6 but zoomed to the bottom so you can see the darks between the tracks (darks are subtracted).
Figure 7
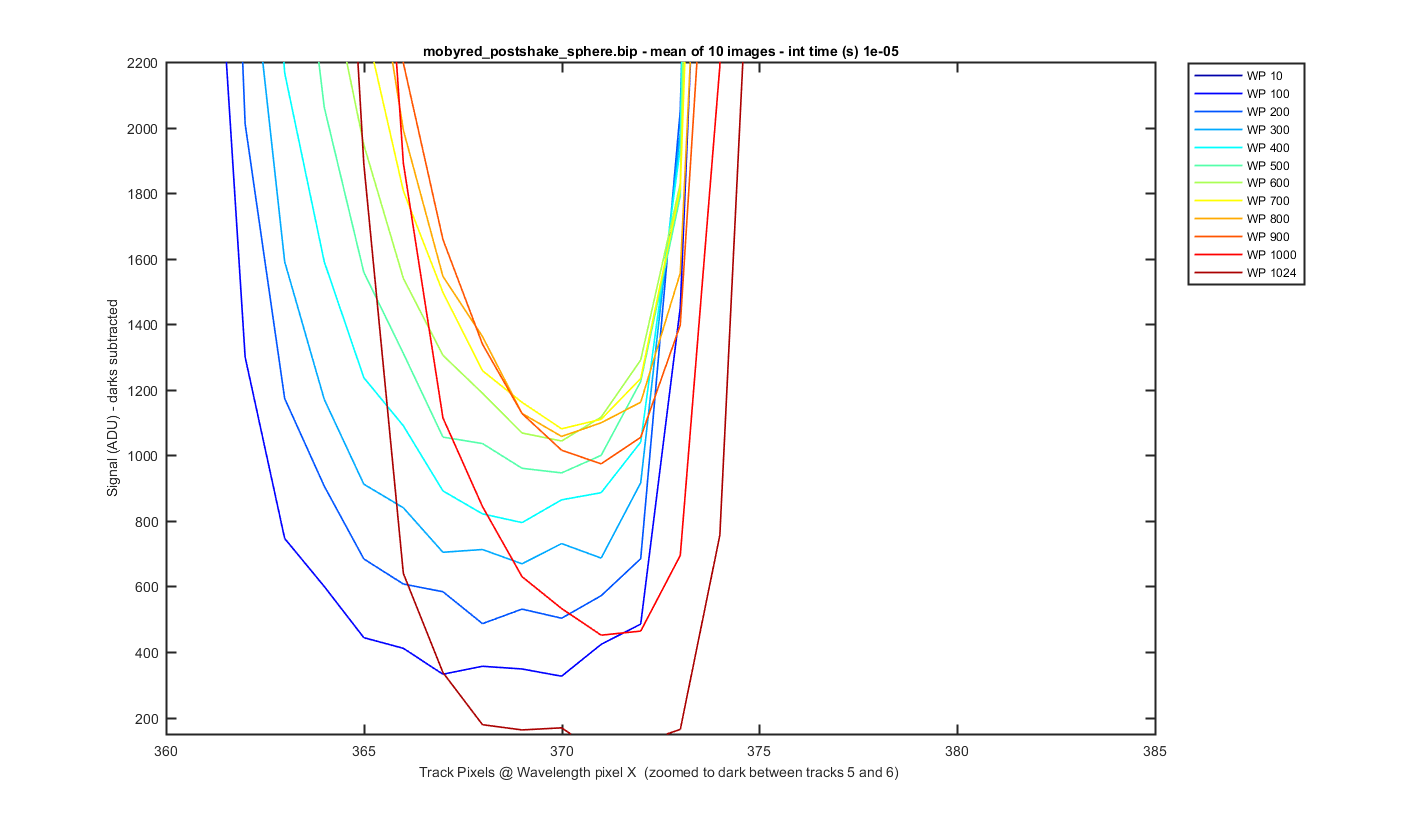
Same as figure 7 but zoomed into the dark area between tracks 5 and 6 so you can see the amount of light getting between the tracks (darks are subtracted). It varies by wavelength.
Figure 8
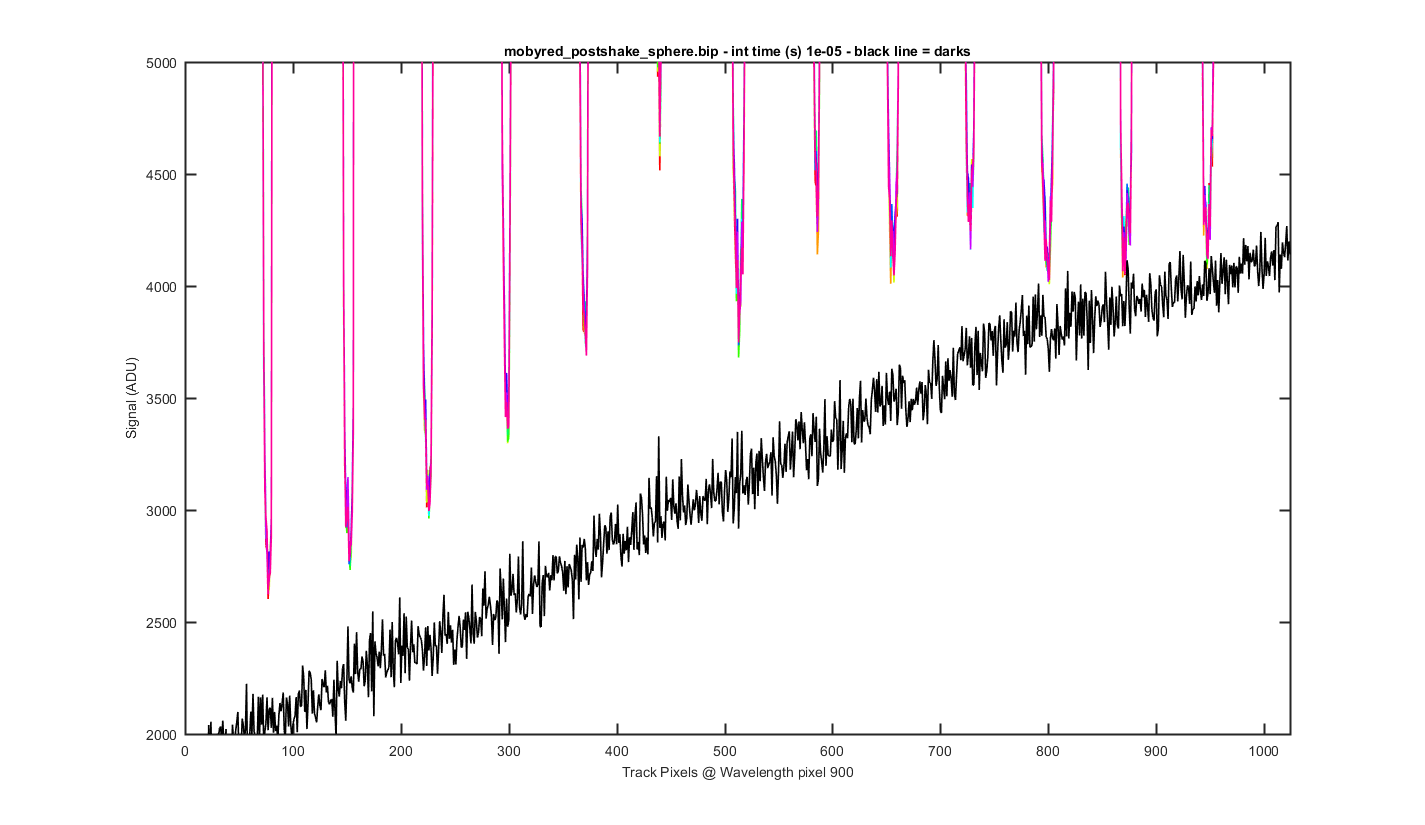
The same cross track plots but zoomed to the bottom and not dark corrected with the dark plotted at a black line (wavelength pixel 900).
Figure 9
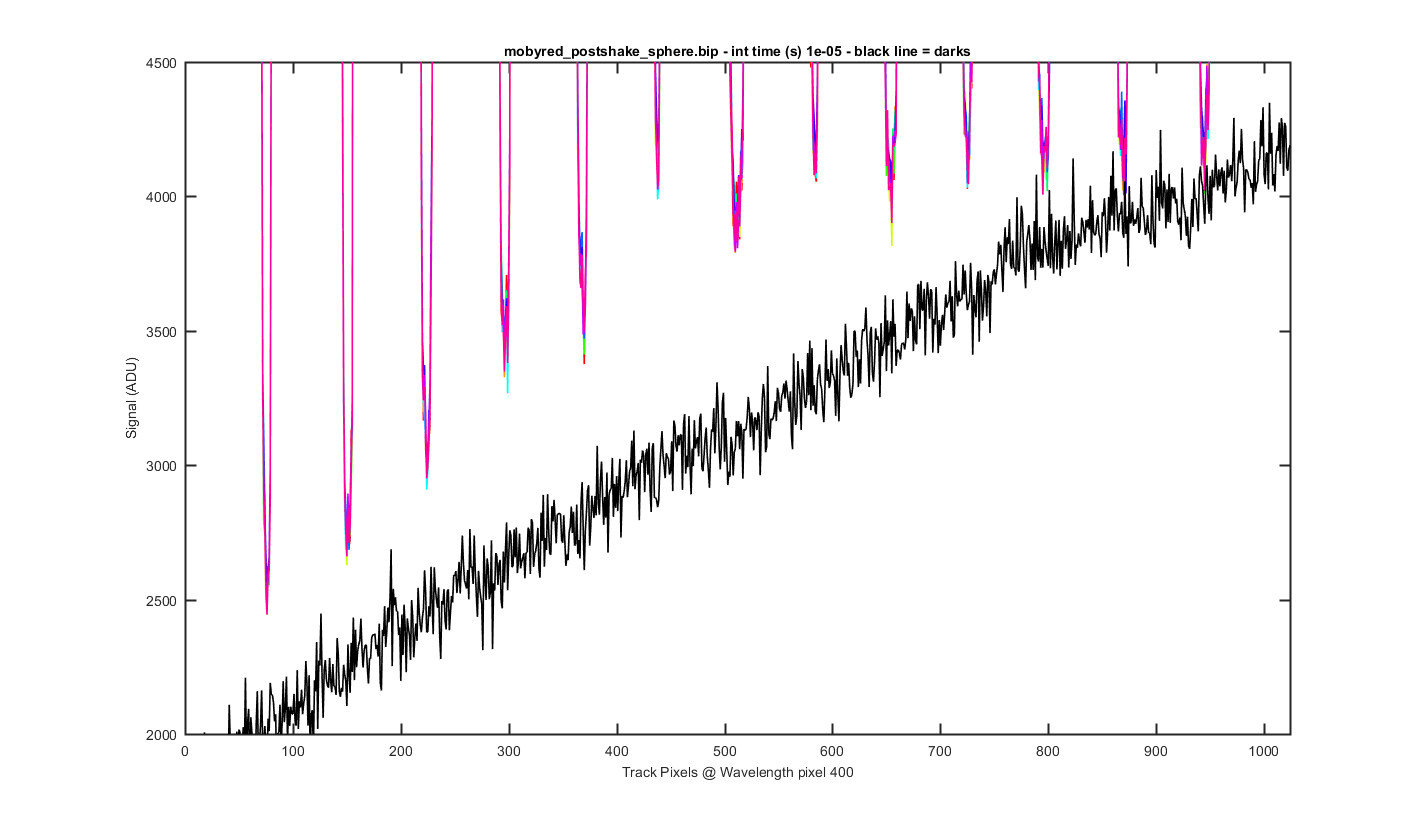
The same cross track plots but zoomed to the bottom and not dark corrected with the dark plotted at a black line (wavelength pixel 400).
Figure 10
Track data which is dark subtracted
Figure 11
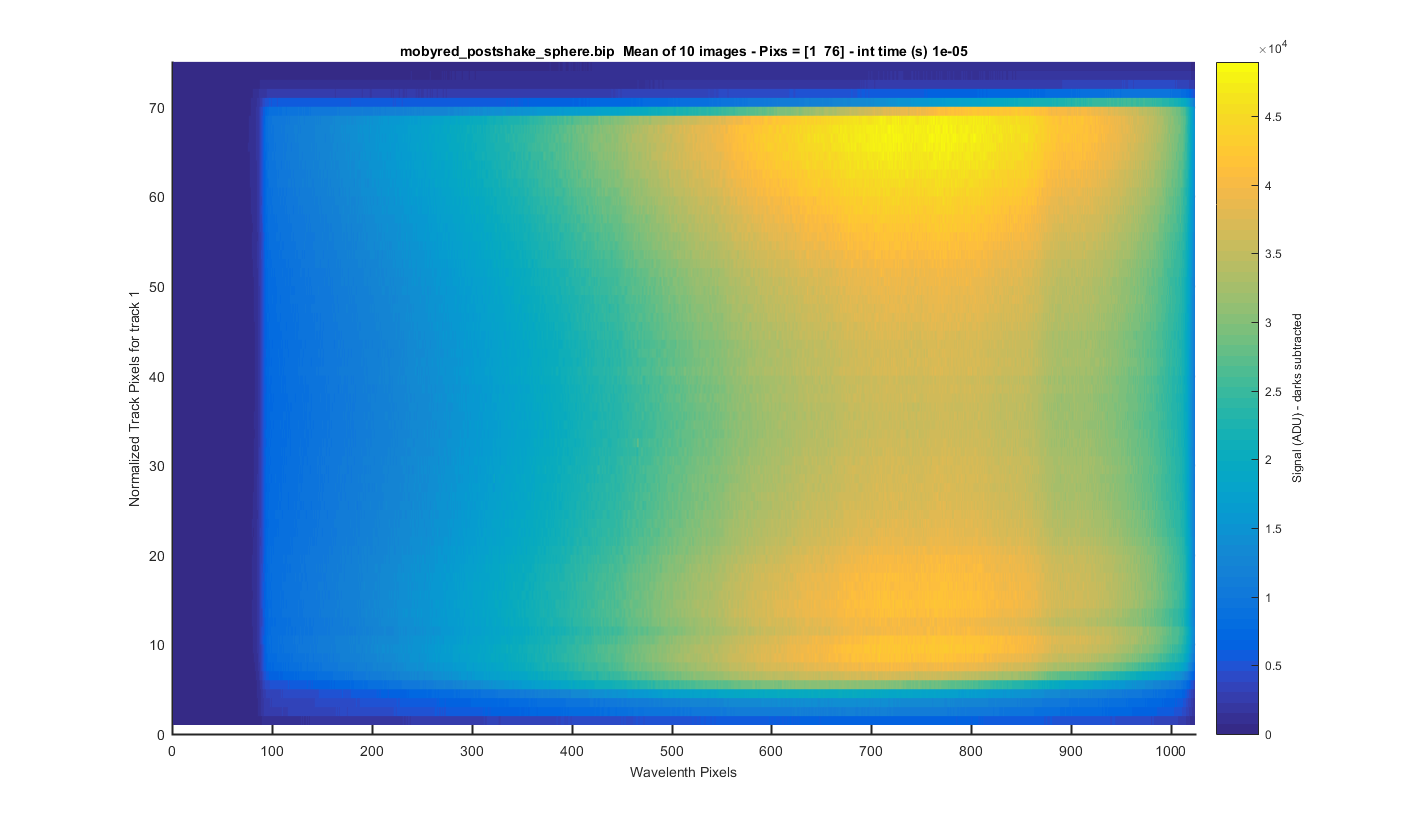
TRACK 1: The meaned image (darks are subtracted) surface plot but for only one track so you can see each track zoomed in. The y-axis is the relative pixel for that track. The title contains the real pixels. I clicked to get these track positions so this will need to be refined in the future.
Figure 12
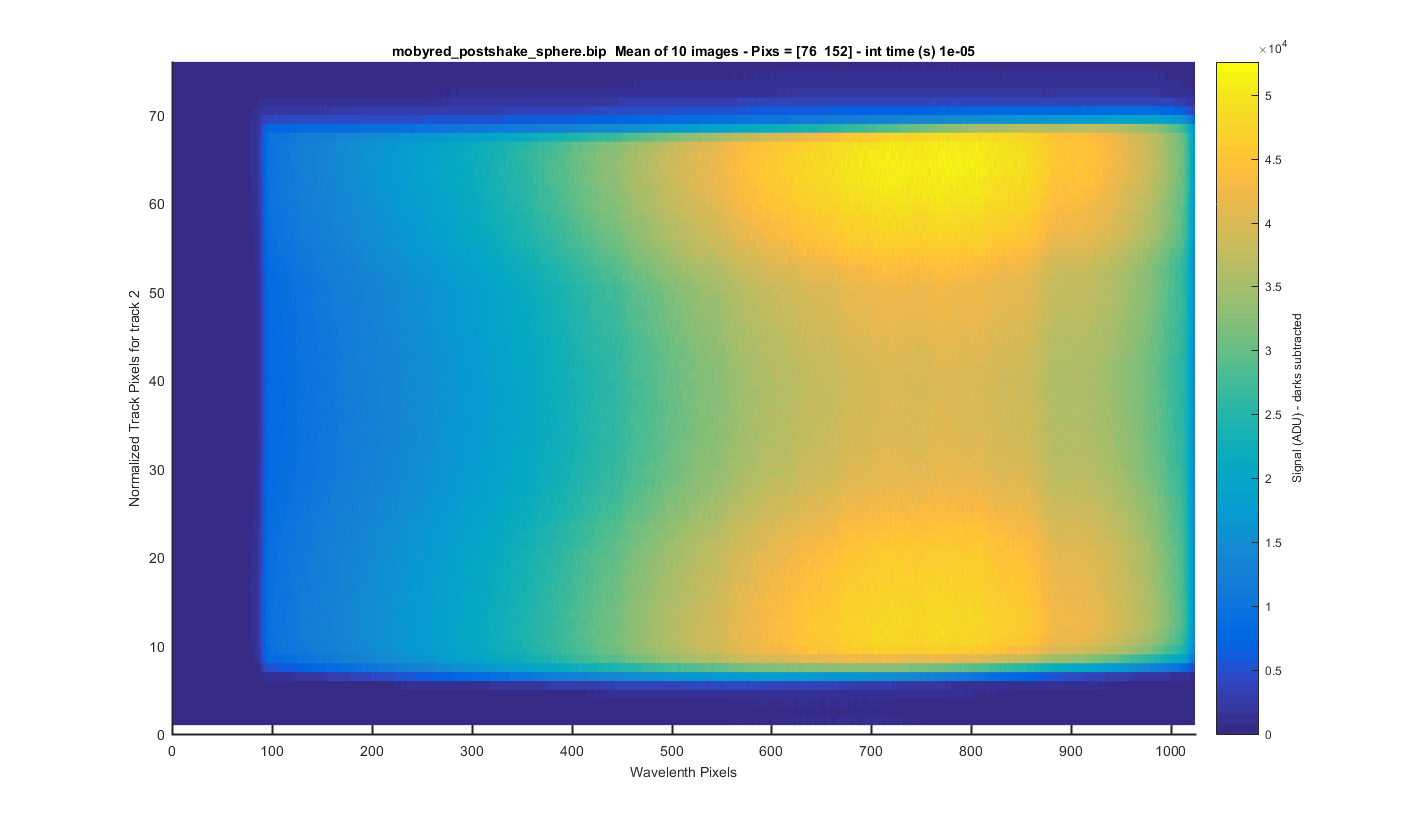
TRACK 2: The meaned image (darks are subtracted) surface plot but for only one track so you can see each track zoomed in. The y-axis is the relative pixel for that track. The title contains the real pixels. I clicked to get these track positions so this will need to be refined in the future.
Figure 13
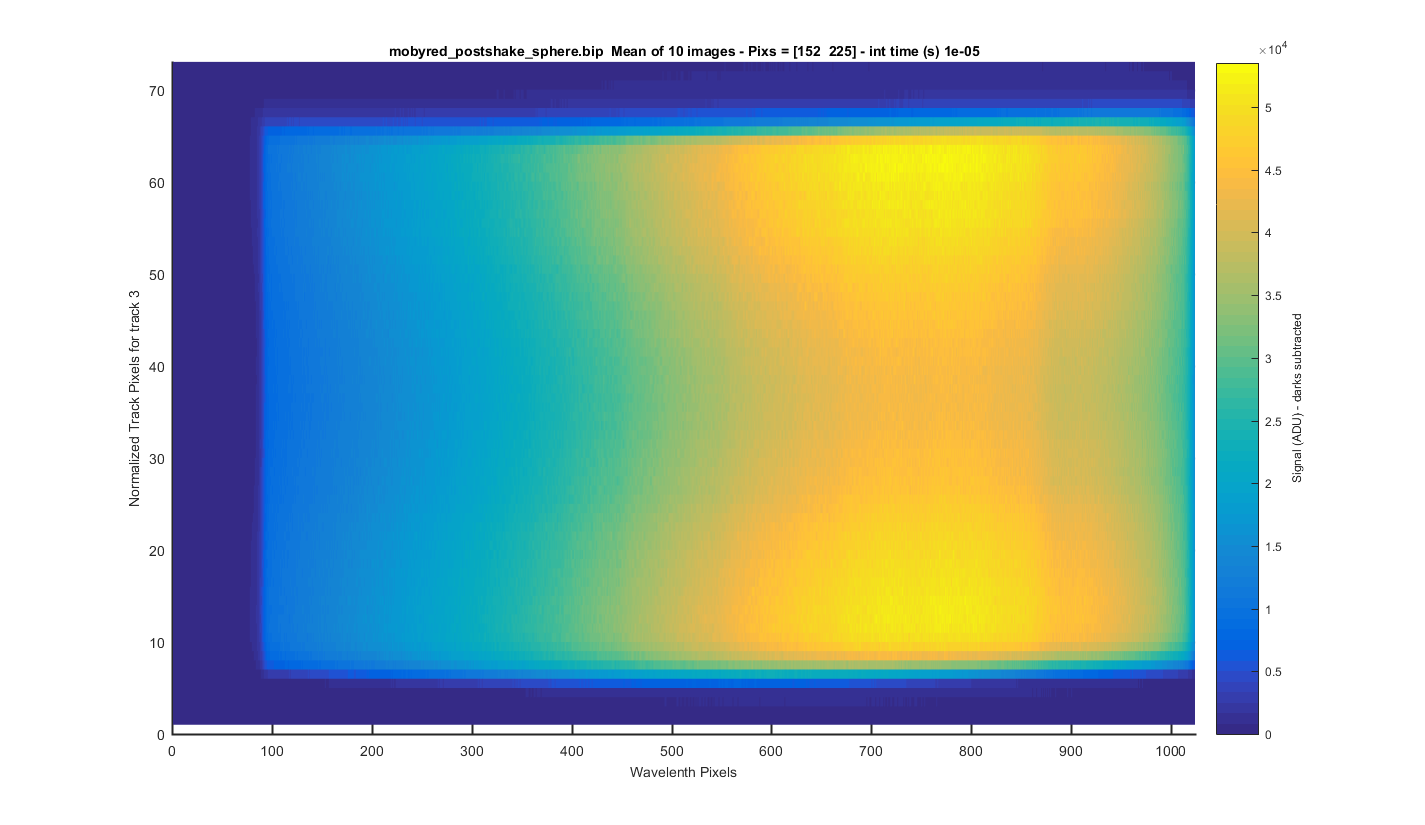
TRACK 3: The meaned image (darks are subtracted) surface plot but for only one track so you can see each track zoomed in. The y-axis is the relative pixel for that track. The title contains the real pixels. I clicked to get these track positions so this will need to be refined in the future.
Figure 14
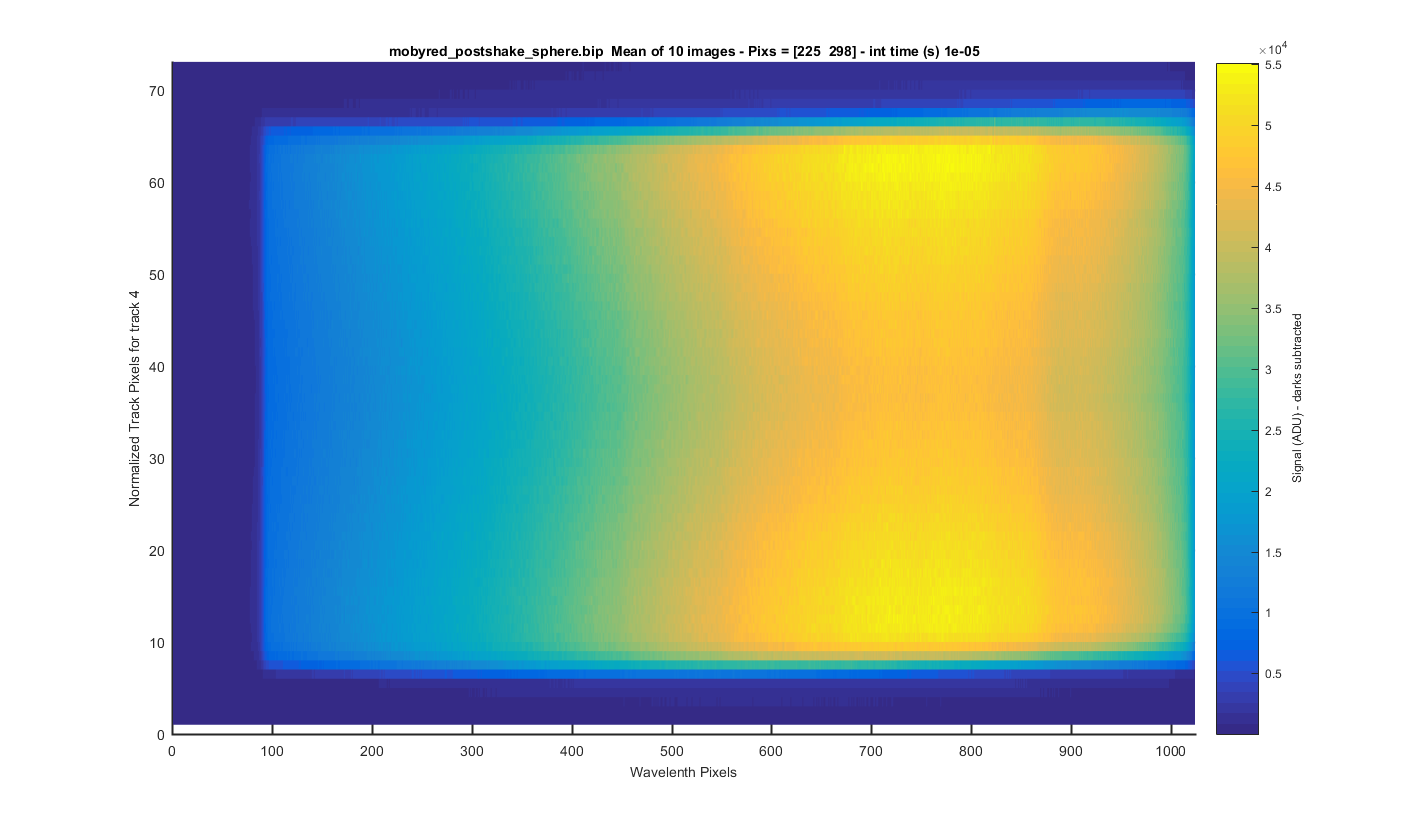
TRACK 4: The meaned image (darks are subtracted) surface plot but for only one track so you can see each track zoomed in. The y-axis is the relative pixel for that track. The title contains the real pixels. I clicked to get these track positions so this will need to be refined in the future.
Figure 15
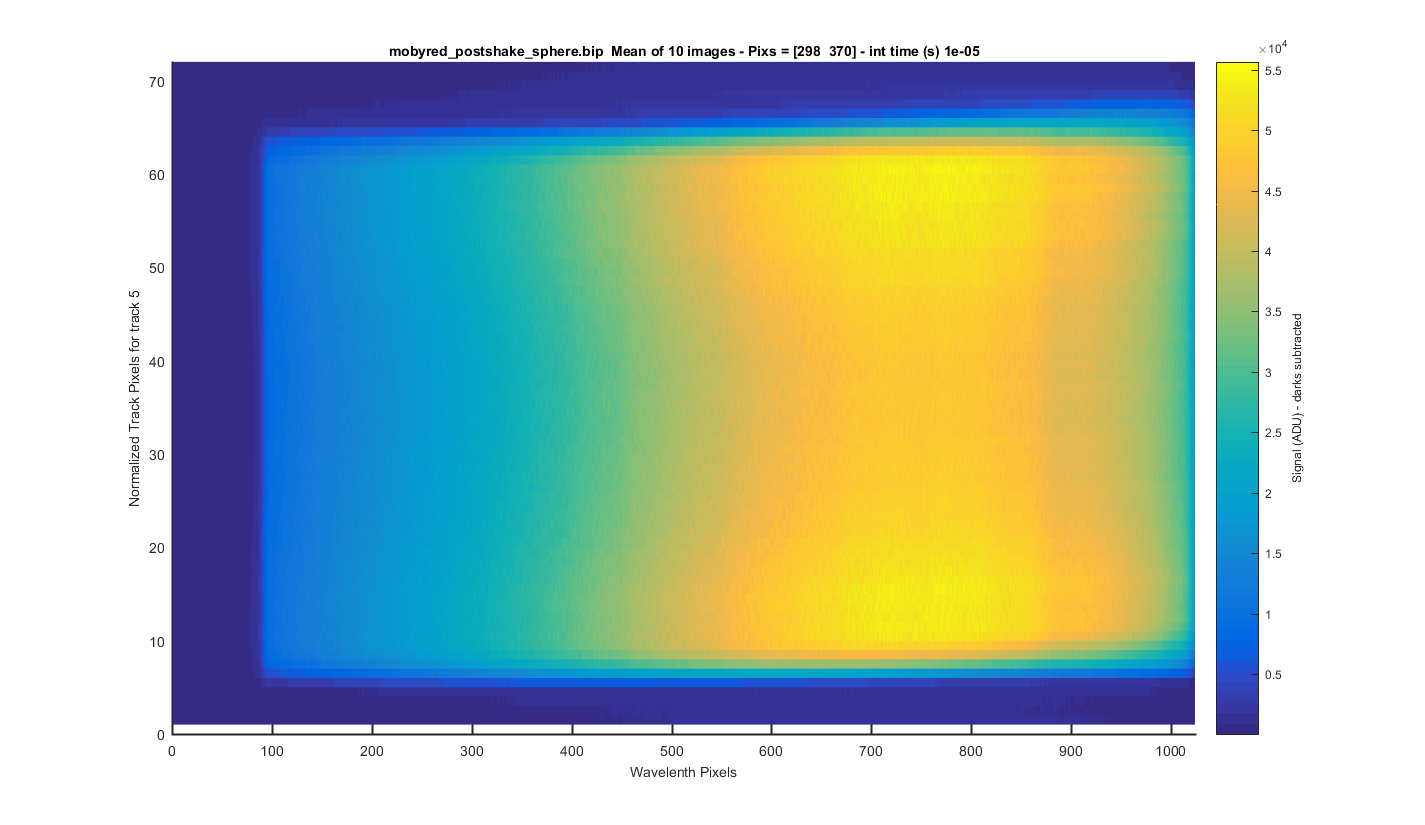
TRACK 5: The meaned image (darks are subtracted) surface plot but for only one track so you can see each track zoomed in. The y-axis is the relative pixel for that track. The title contains the real pixels. I clicked to get these track positions so this will need to be refined in the future.
Figure 16
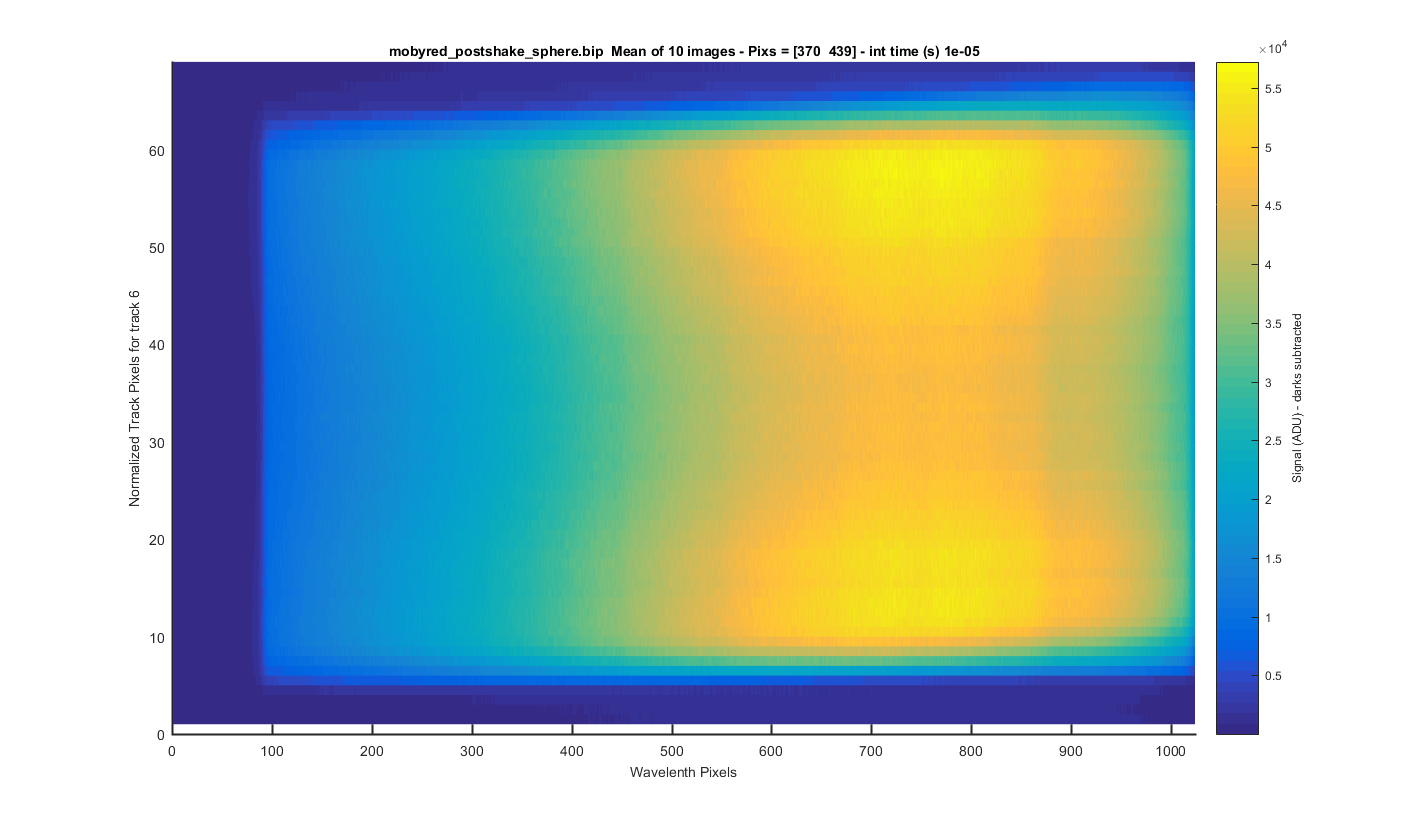
TRACK 6: The meaned image (darks are subtracted) surface plot but for only one track so you can see each track zoomed in. The y-axis is the relative pixel for that track. The title contains the real pixels. I clicked to get these track positions so this will need to be refined in the future.
Figure 17
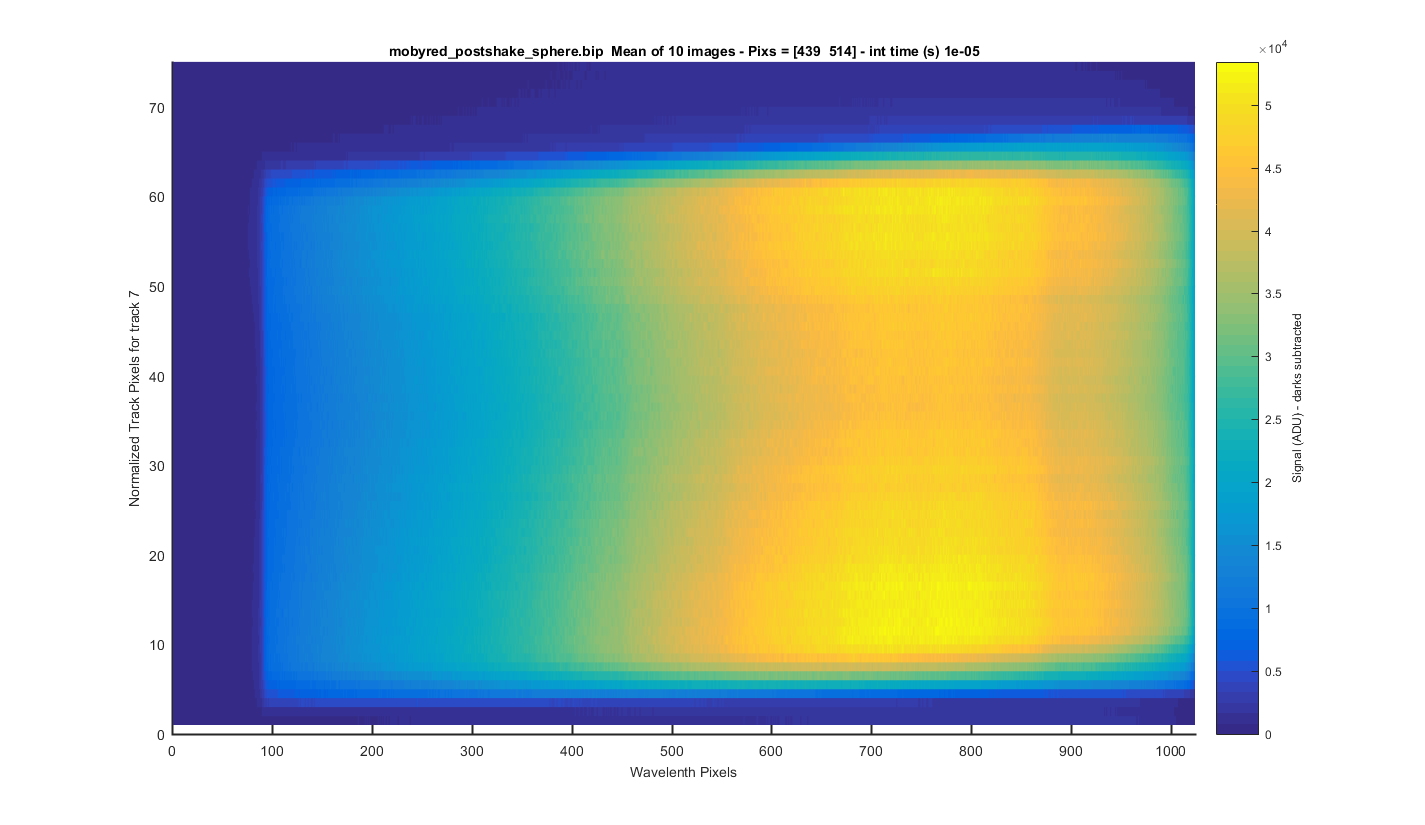
TRACK 7: The meaned image (darks are subtracted) surface plot but for only one track so you can see each track zoomed in. The y-axis is the relative pixel for that track. The title contains the real pixels. I clicked to get these track positions so this will need to be refined in the future.
Figure 18
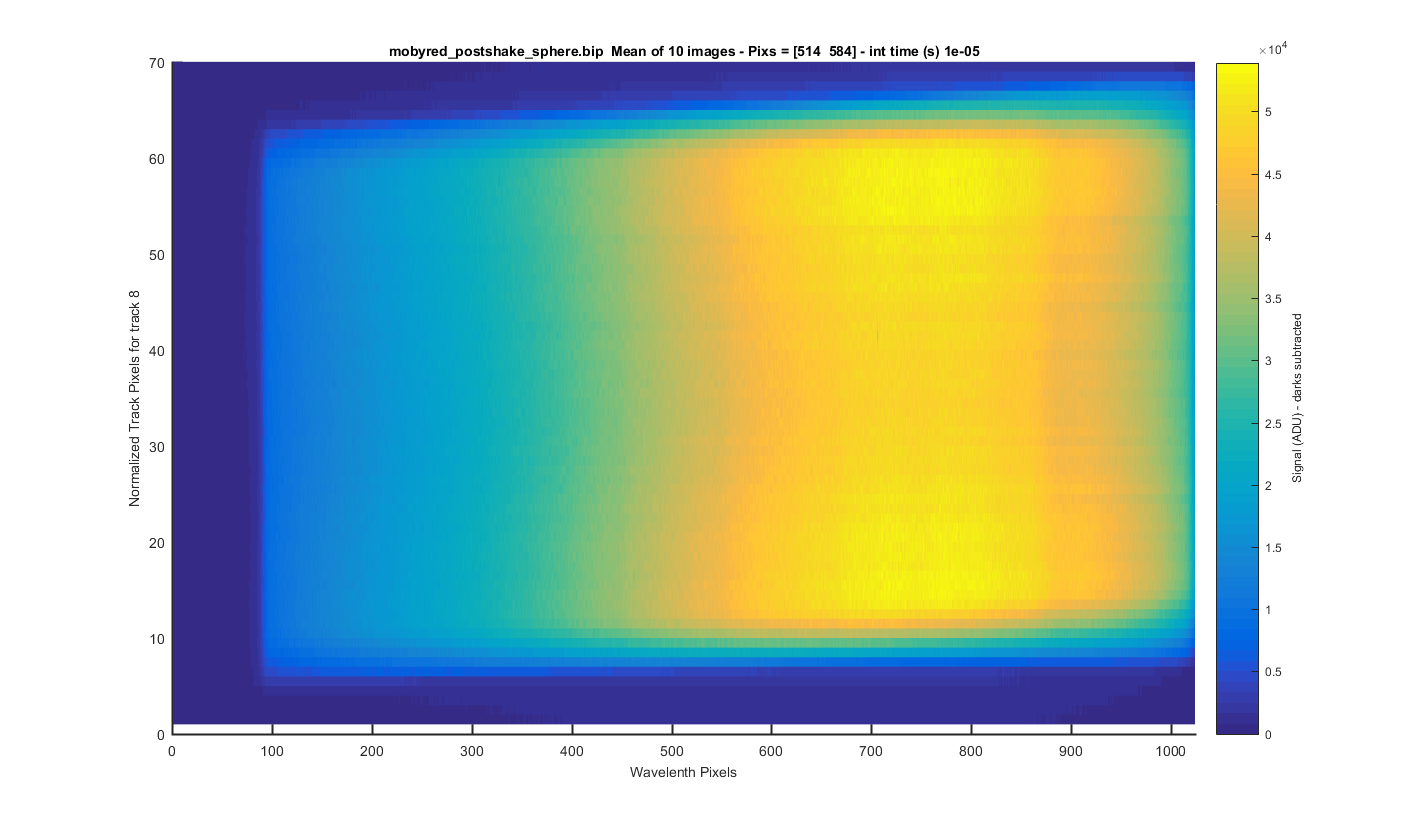
TRACK 8: The meaned image (darks are subtracted) surface plot but for only one track so you can see each track zoomed in. The y-axis is the relative pixel for that track. The title contains the real pixels. I clicked to get these track positions so this will need to be refined in the future.
Figure 19
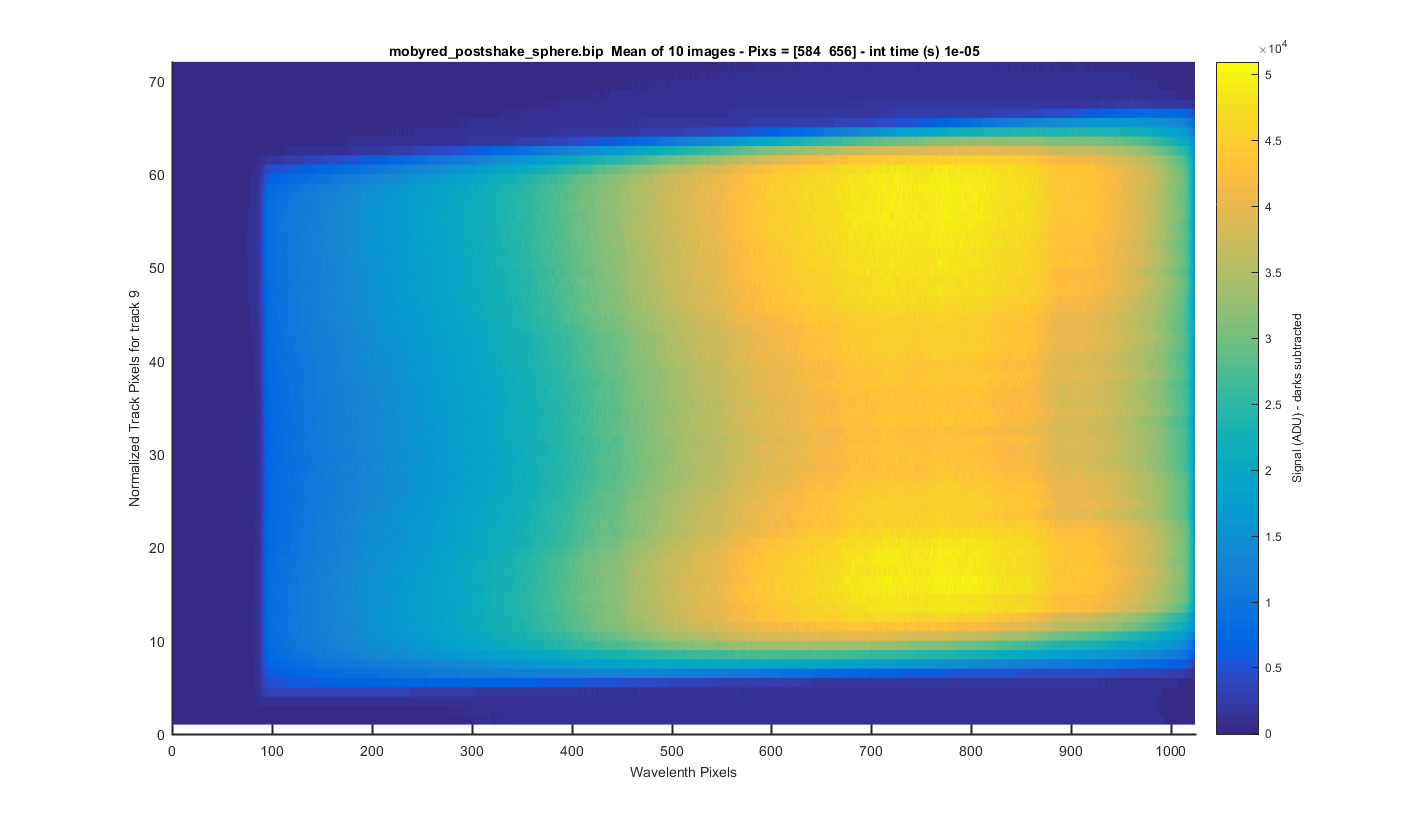
TRACK 9: The meaned image (darks are subtracted) surface plot but for only one track so you can see each track zoomed in. The y-axis is the relative pixel for that track. The title contains the real pixels. I clicked to get these track positions so this will need to be refined in the future.
Figure 20
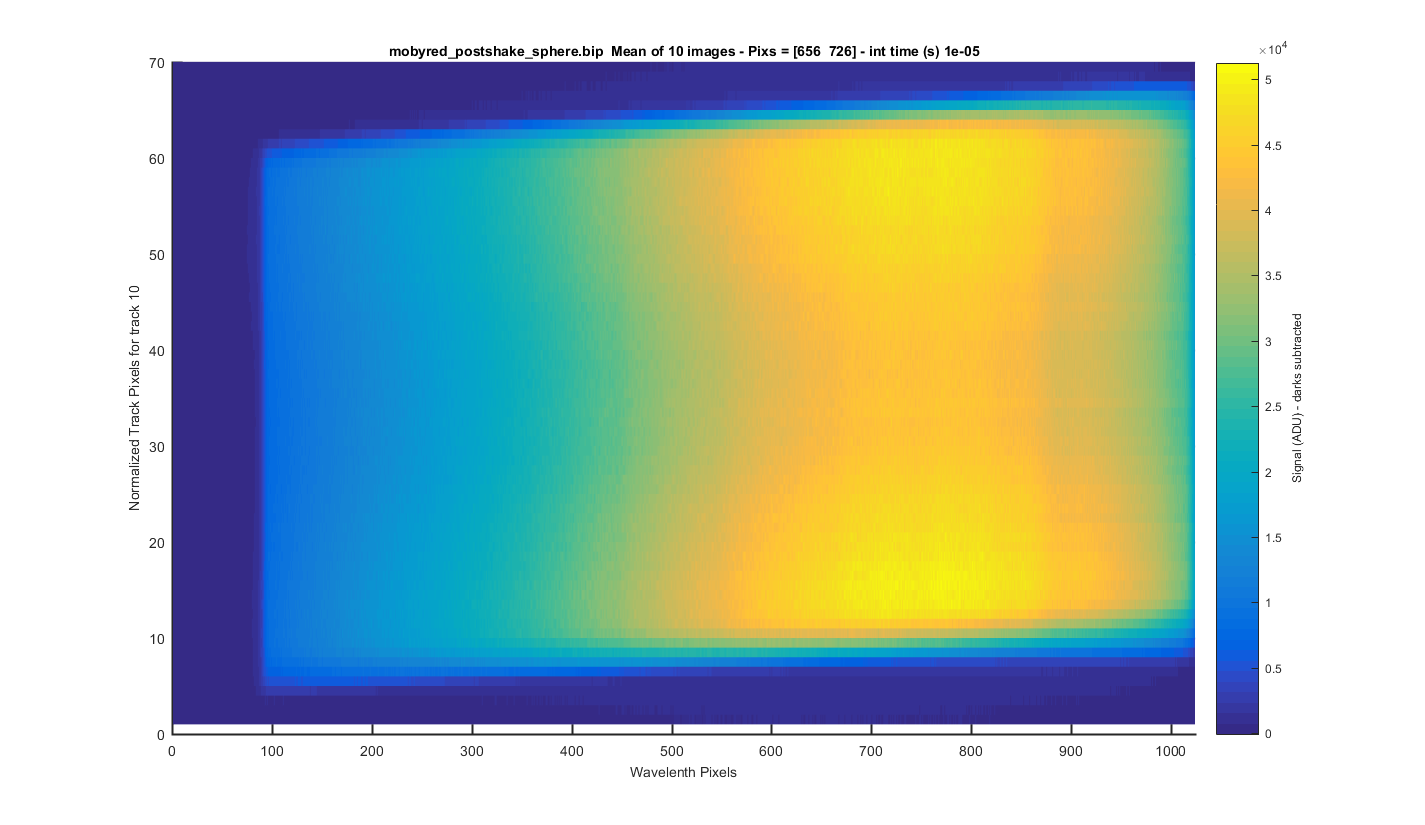
TRACK 10: The meaned image (darks are subtracted) surface plot but for only one track so you can see each track zoomed in. The y-axis is the relative pixel for that track. The title contains the real pixels. I clicked to get these track positions so this will need to be refined in the future.
Figure 21
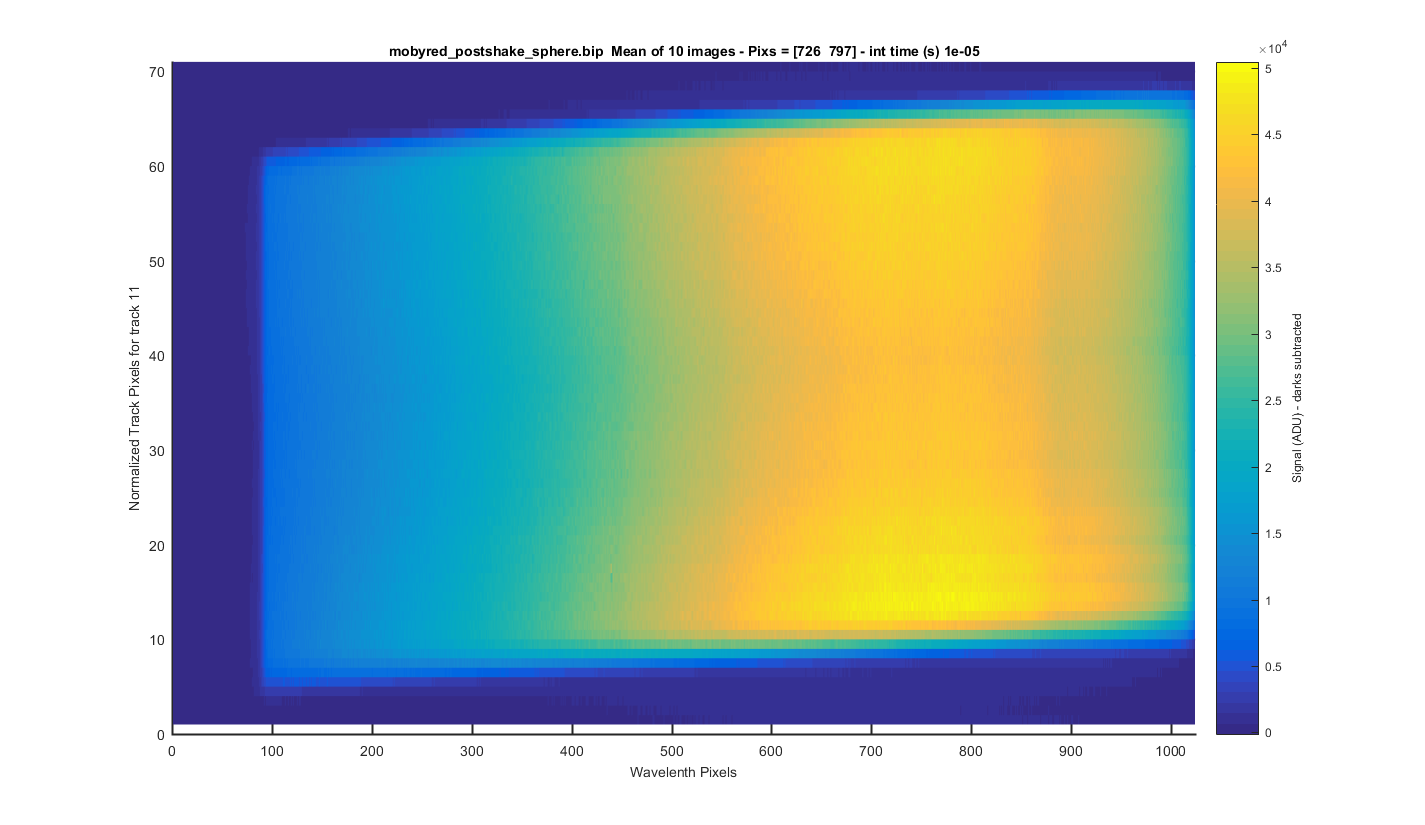
TRACK 11: The meaned image (darks are subtracted) surface plot but for only one track so you can see each track zoomed in. The y-axis is the relative pixel for that track. The title contains the real pixels. I clicked to get these track positions so this will need to be refined in the future.
Figure 22
TRACK 12: The meaned image (darks are subtracted) surface plot but for only one track so you can see each track zoomed in. The y-axis is the relative pixel for that track. The title contains the real pixels. I clicked to get these track positions so this will need to be refined in the future.
Figure 23

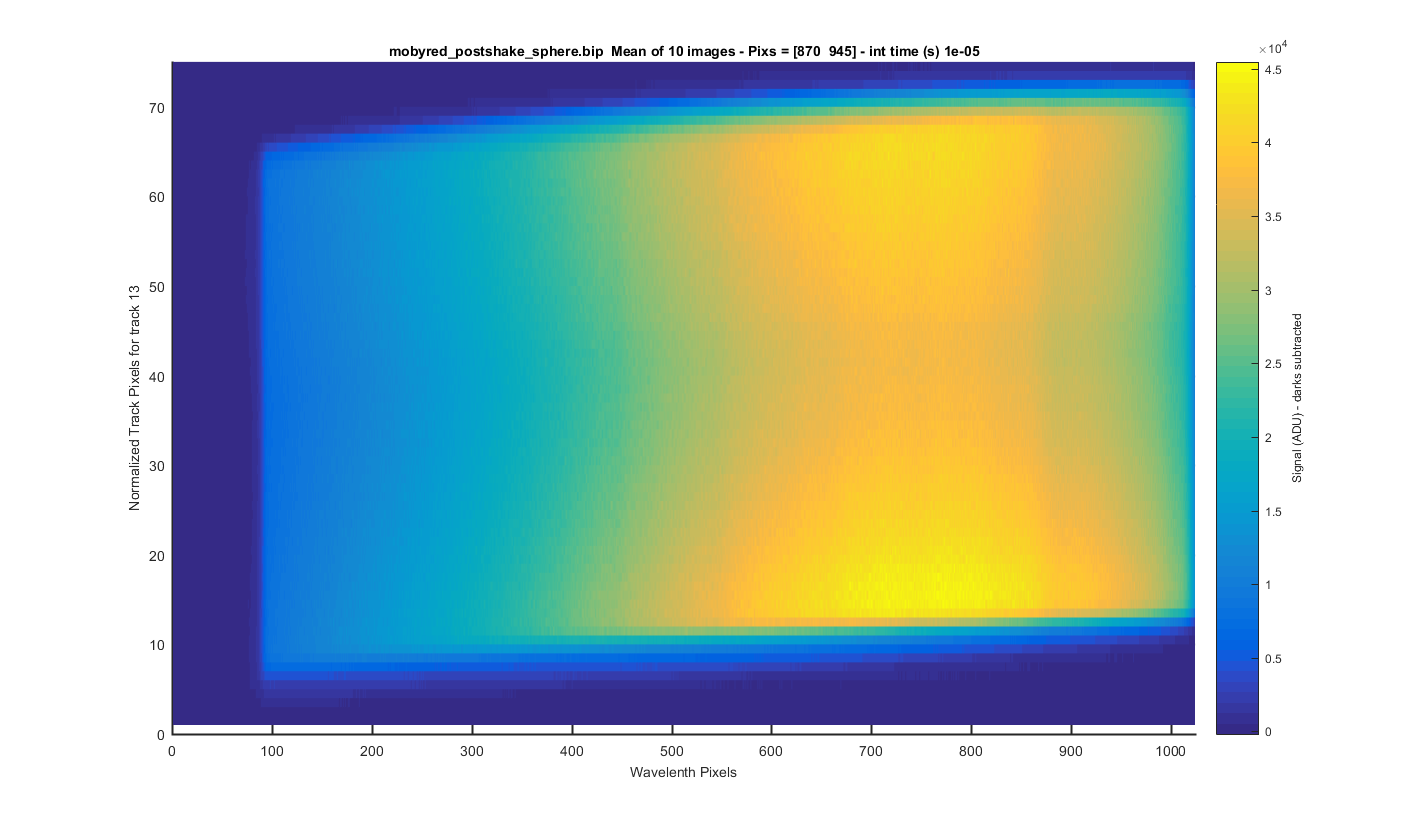
TRACK 13: The meaned image (darks are subtracted) surface plot but for only one track so you can see each track zoomed in. The y-axis is the relative pixel for that track. The title contains the real pixels. I clicked to get these track positions so this will need to be refined in the future.
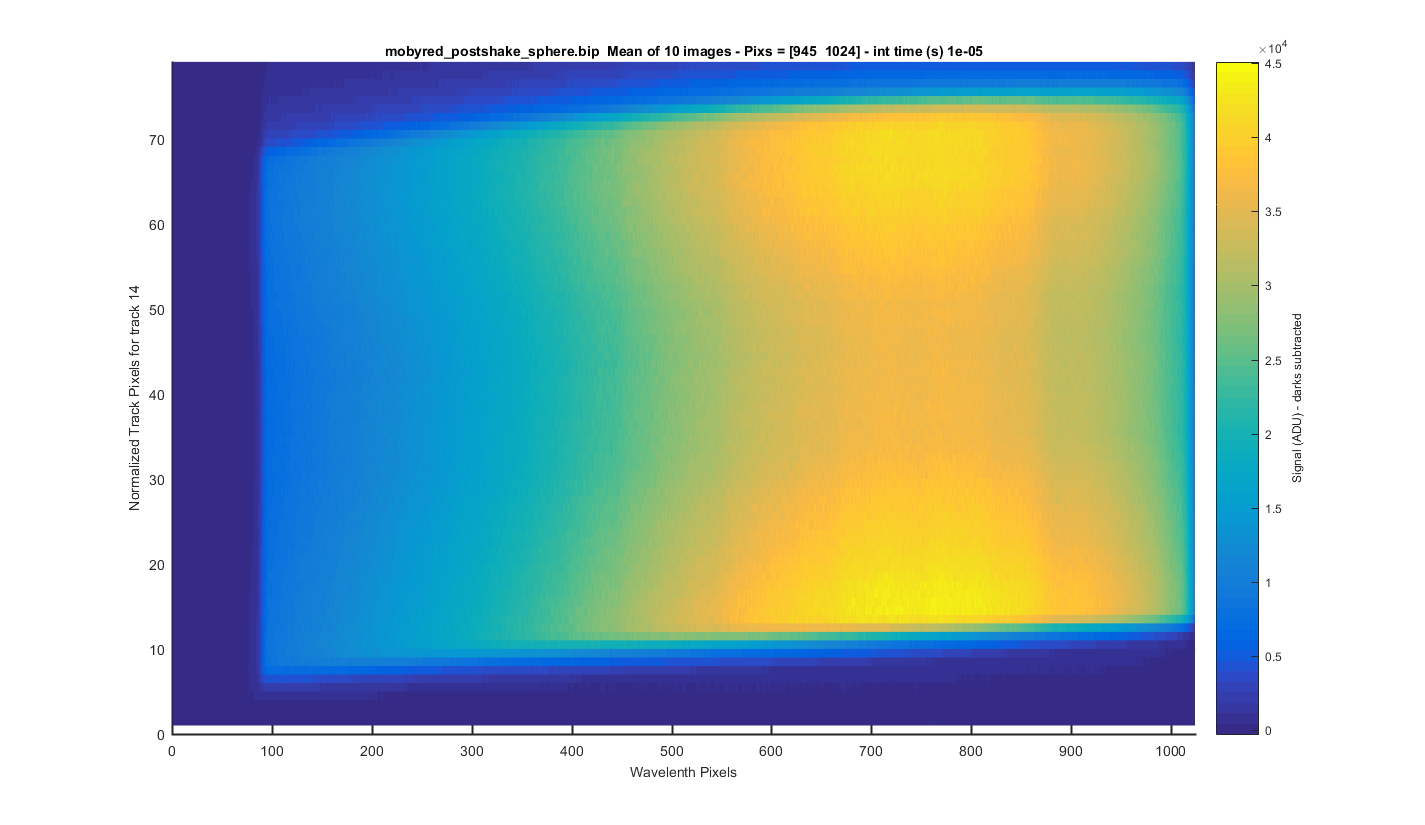
Figure 24
TRACK 14: The meaned image (darks are subtracted) surface plot but for only one track so you can see each track zoomed in. The y-axis is the relative pixel for that track. The title contains the real pixels. I clicked to get these track positions so this will need to be refined in the future.
Figure 25