REVISION DATE: 13-Dec-2016 12:43:22
Email from Mike Kehoe on 11/29/2016 8:43 AM:
Greetings All,

Casey has assembled RS5.  Please find report attached.  The test data are at the usual location, dated 11/28/16. The system is ready to ship, upon request.

This is the last Red system.  Whew -- that was harder than I thought!  We have three blue systems yet to ship.  In order to proceed, we need a camera.  We have one fiber bundle in stock.  All other parts are on hand.

-Mike
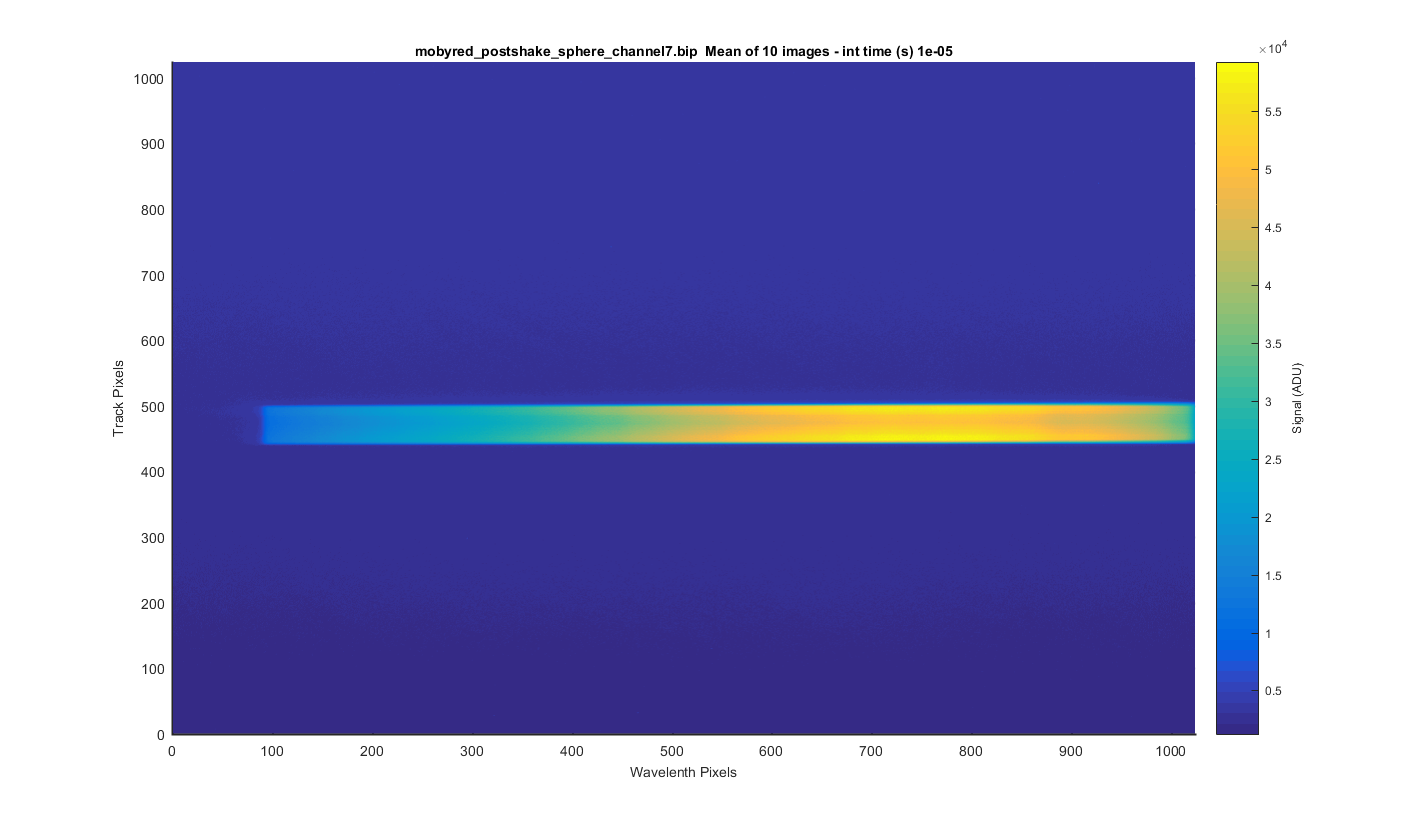
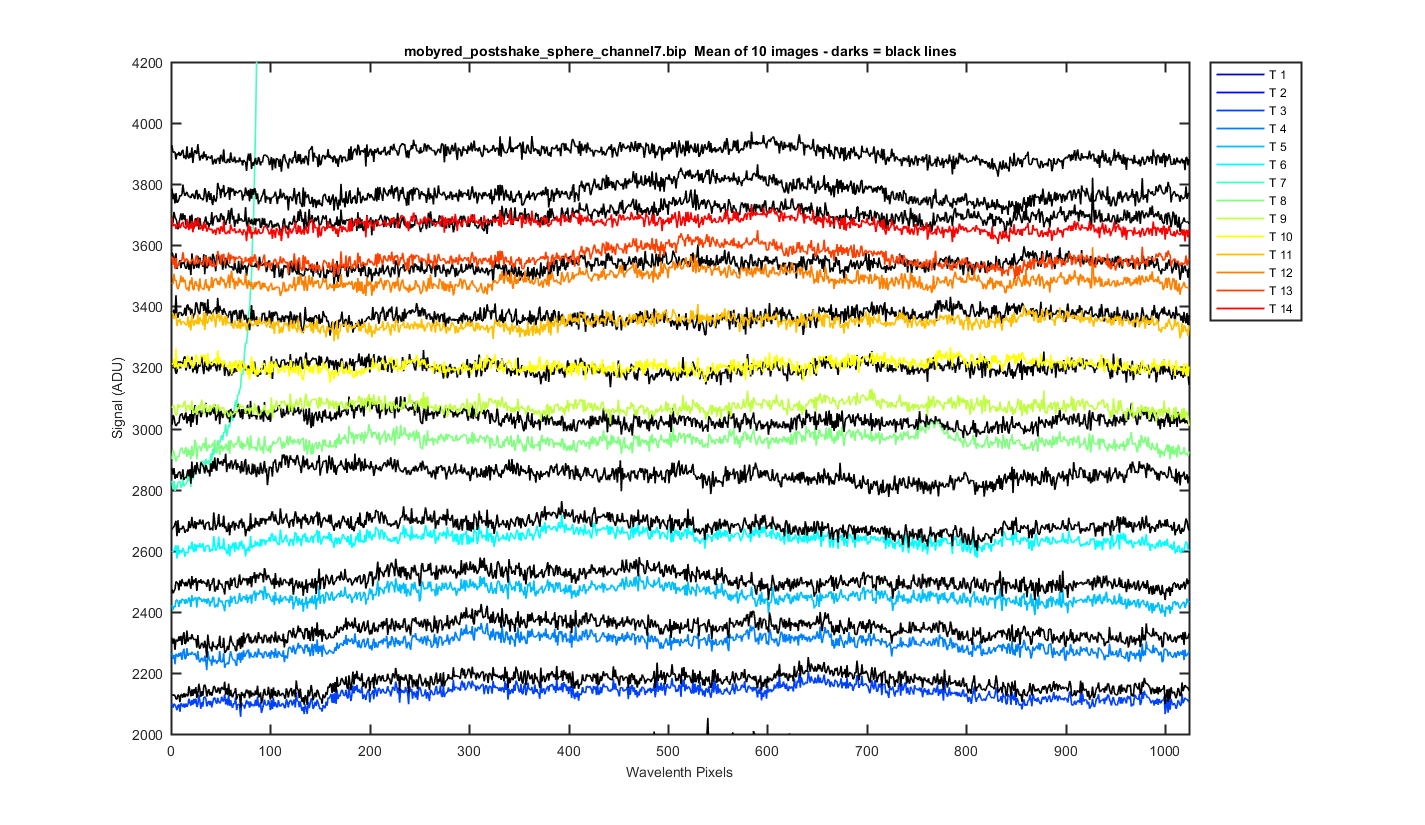
Below are my graphs of the mobyred_postshake_sphere_channel7.bip file. The file contains 10 dark images at 1e-05 sec Note some graphs are dark corrected and some are not so check the axis labels to know what you are looking at.
Note the one dark image collected for this data was not quite right. I subtracted 200 ADU from the entire dark images to get the track 7 data to not be negative but this did not work for the other tracks. Low signal data and cross track at the edges could be off by an unknown amount.
I took the 10 images and meaned them to get the surface plot below.
Figure 1
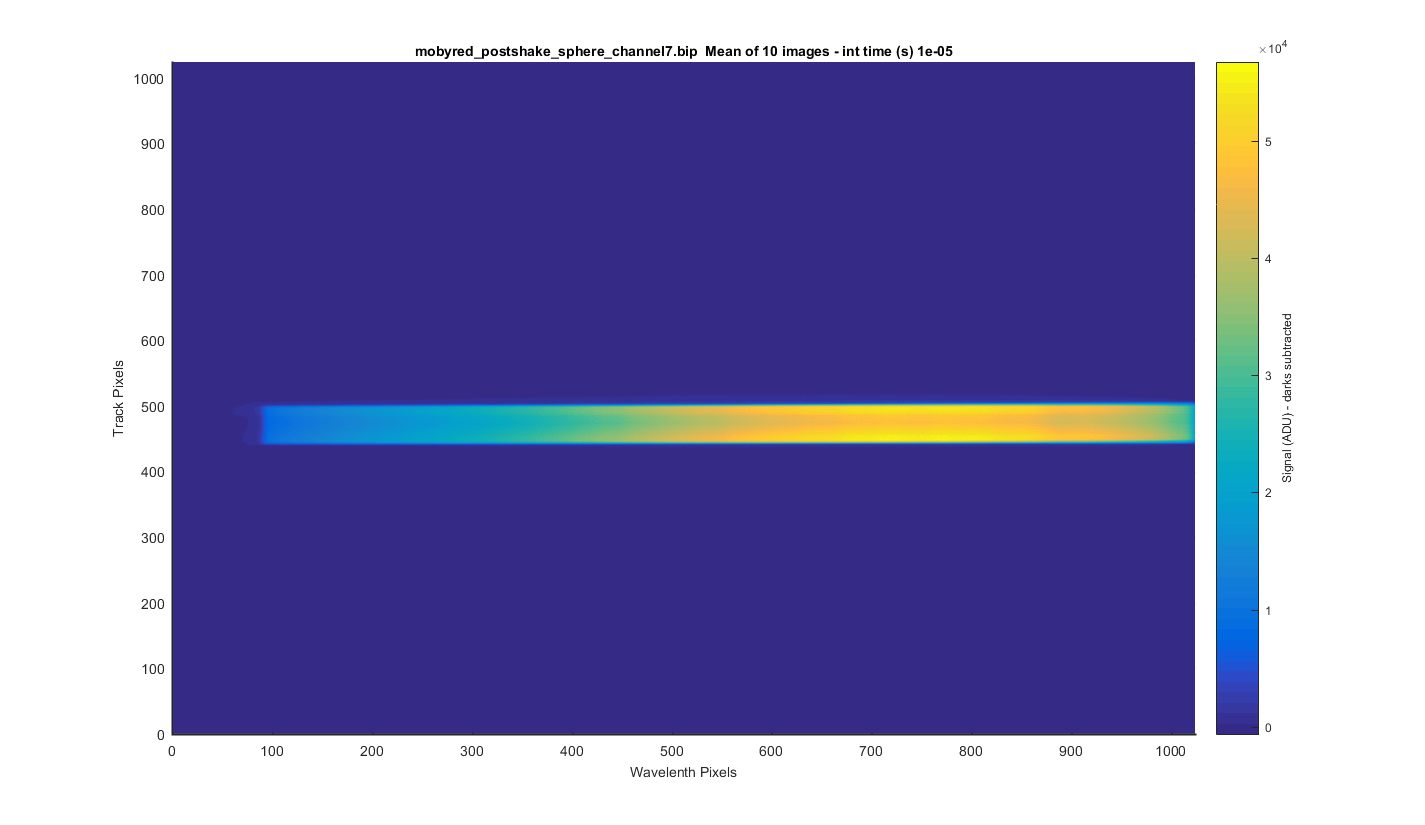
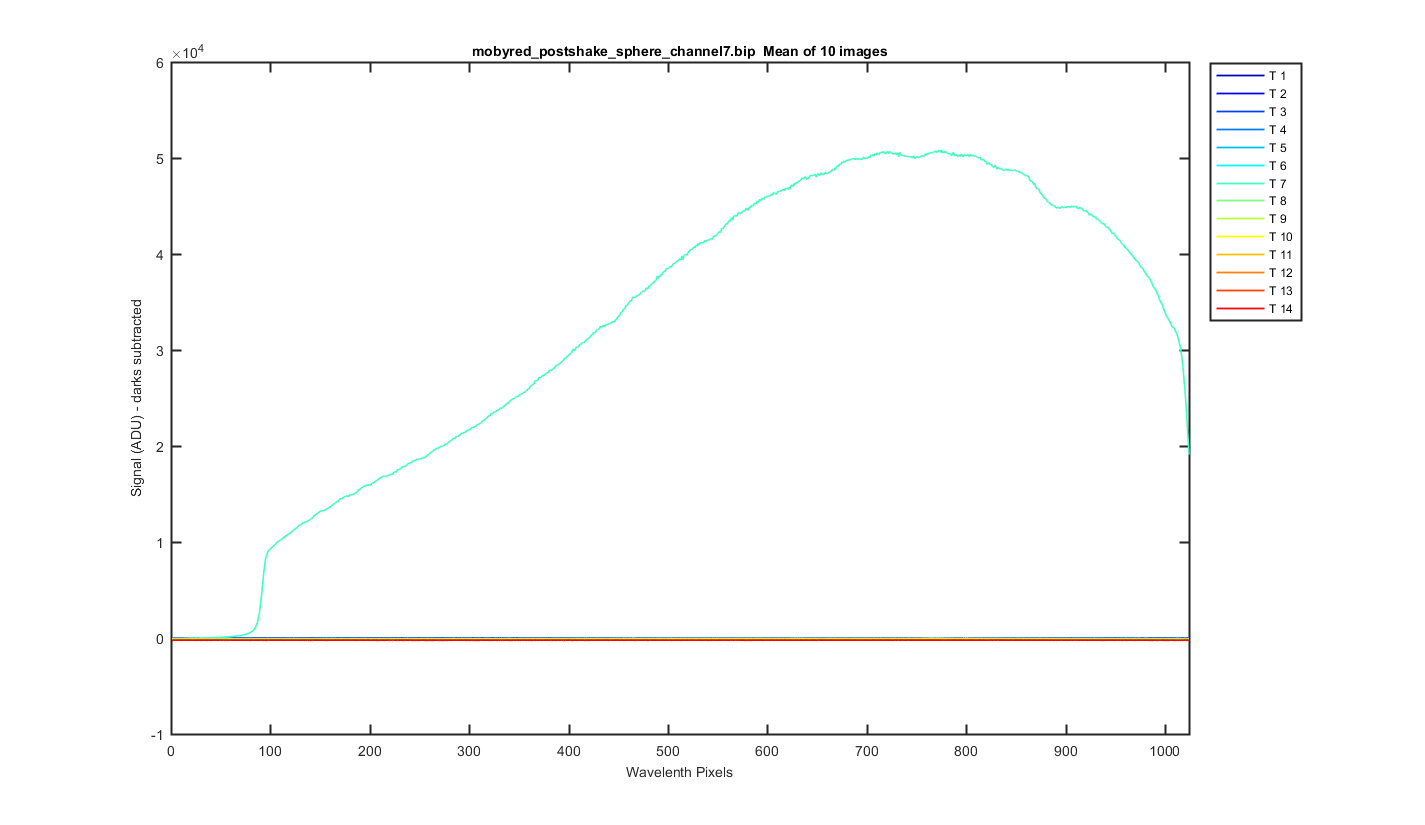
Same as the previous images but with the dark image subtracted.
Figure 2
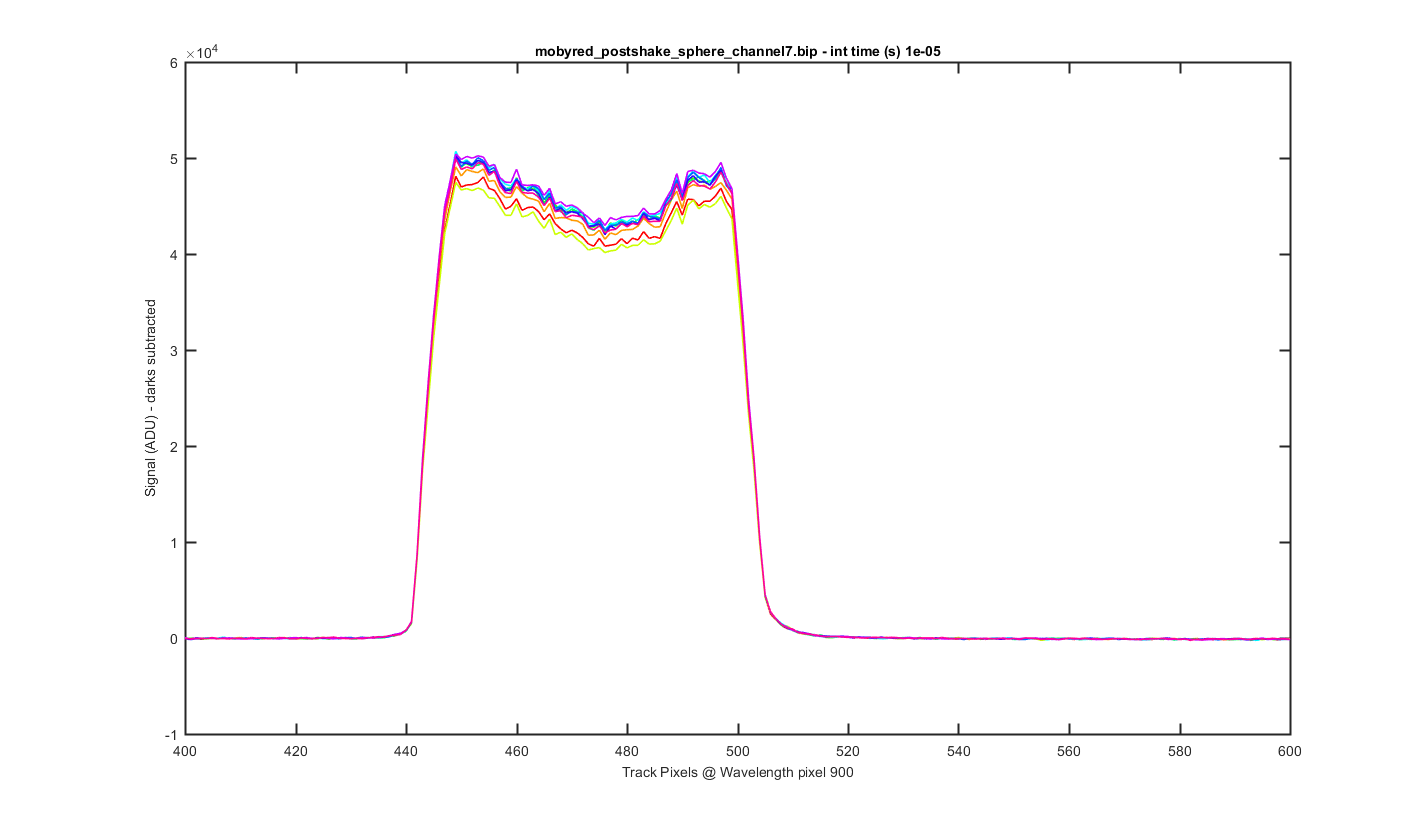
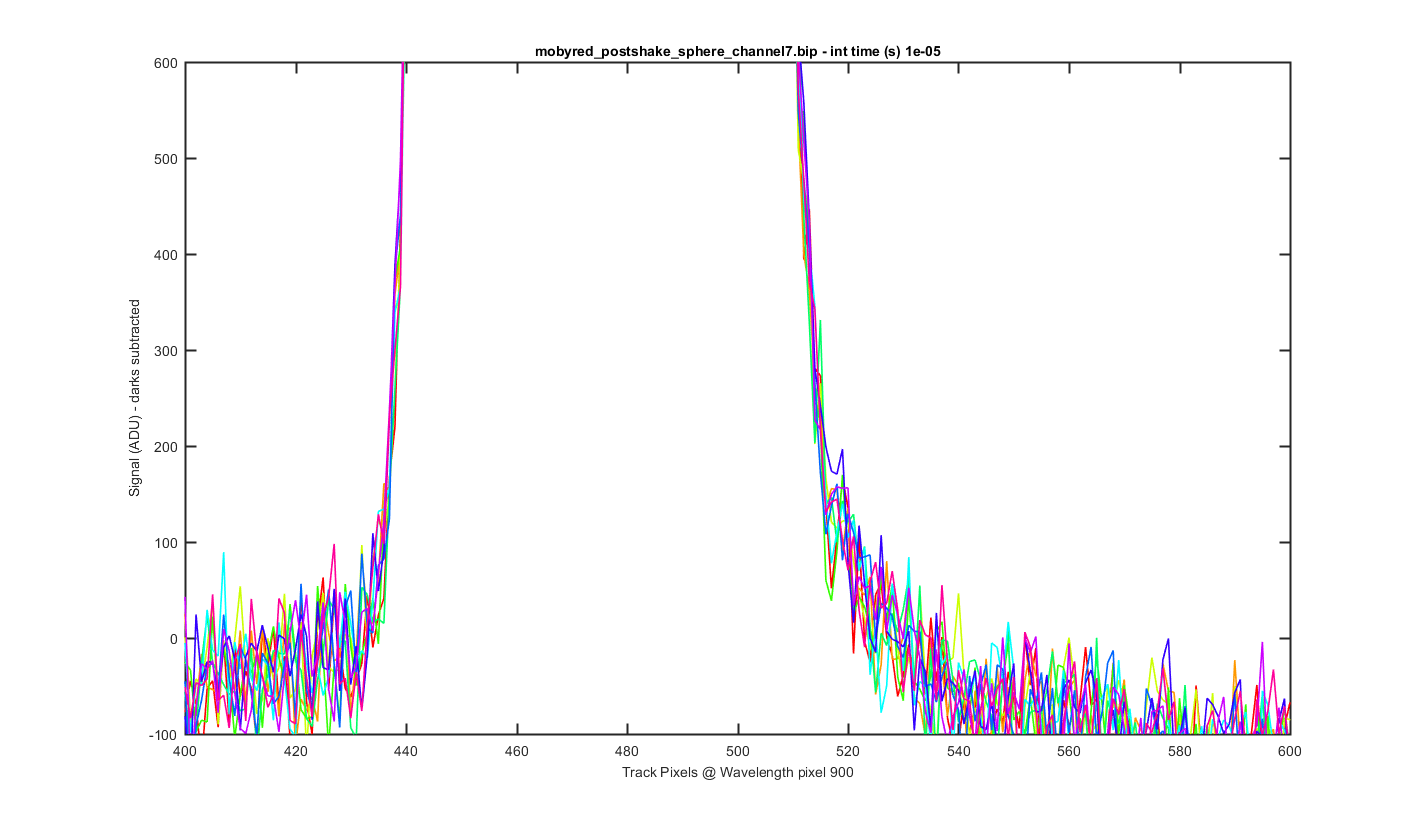
This is a cross section through the tracks at wavelength pixel 900, with one line for each of the 10 images (darks are subtracted).
Figure 3
Same as the previous graph but zoomed into the bottom to see the level of the darks between the tracks. Dark had 200 ADU added to them. This is the image I used to decide to subtract 200 ADU.
Figure 4
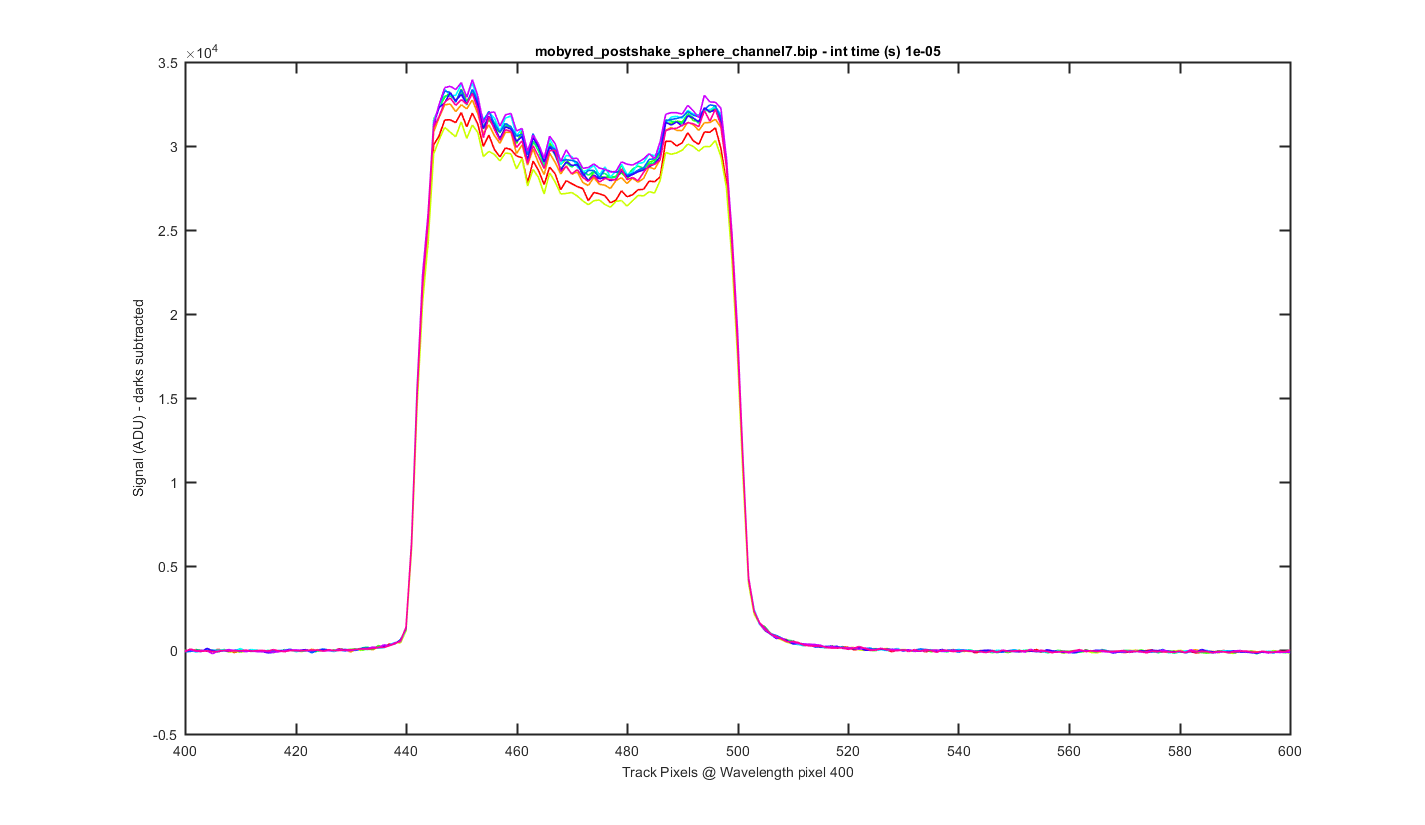
Same as figure 2 but for Wavelength pixel 400 (darks are subtracted)
Figure 5
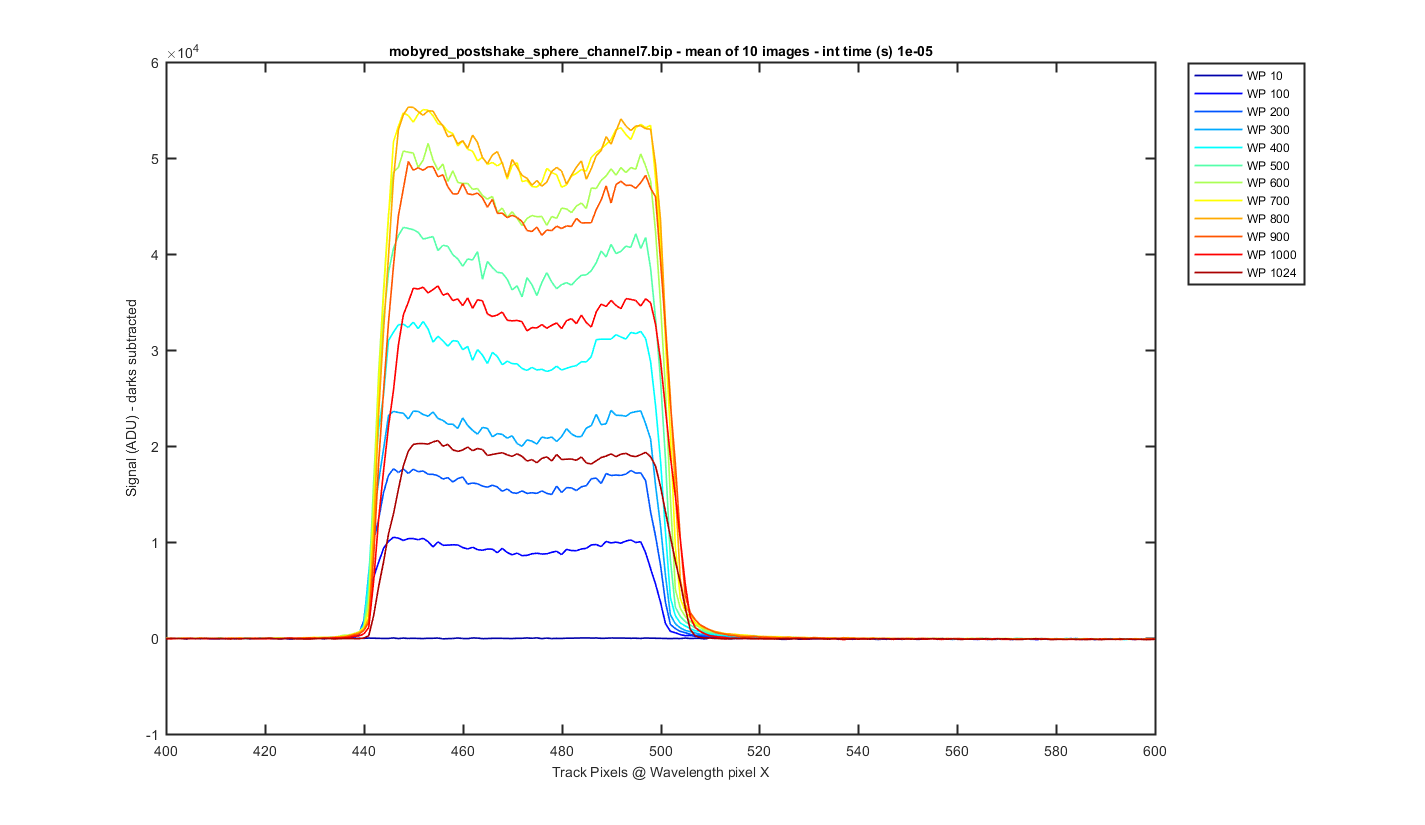
Again this is the mean image with slices thought the image at different wavelength pixels (darks are subtracted).
Figure 6
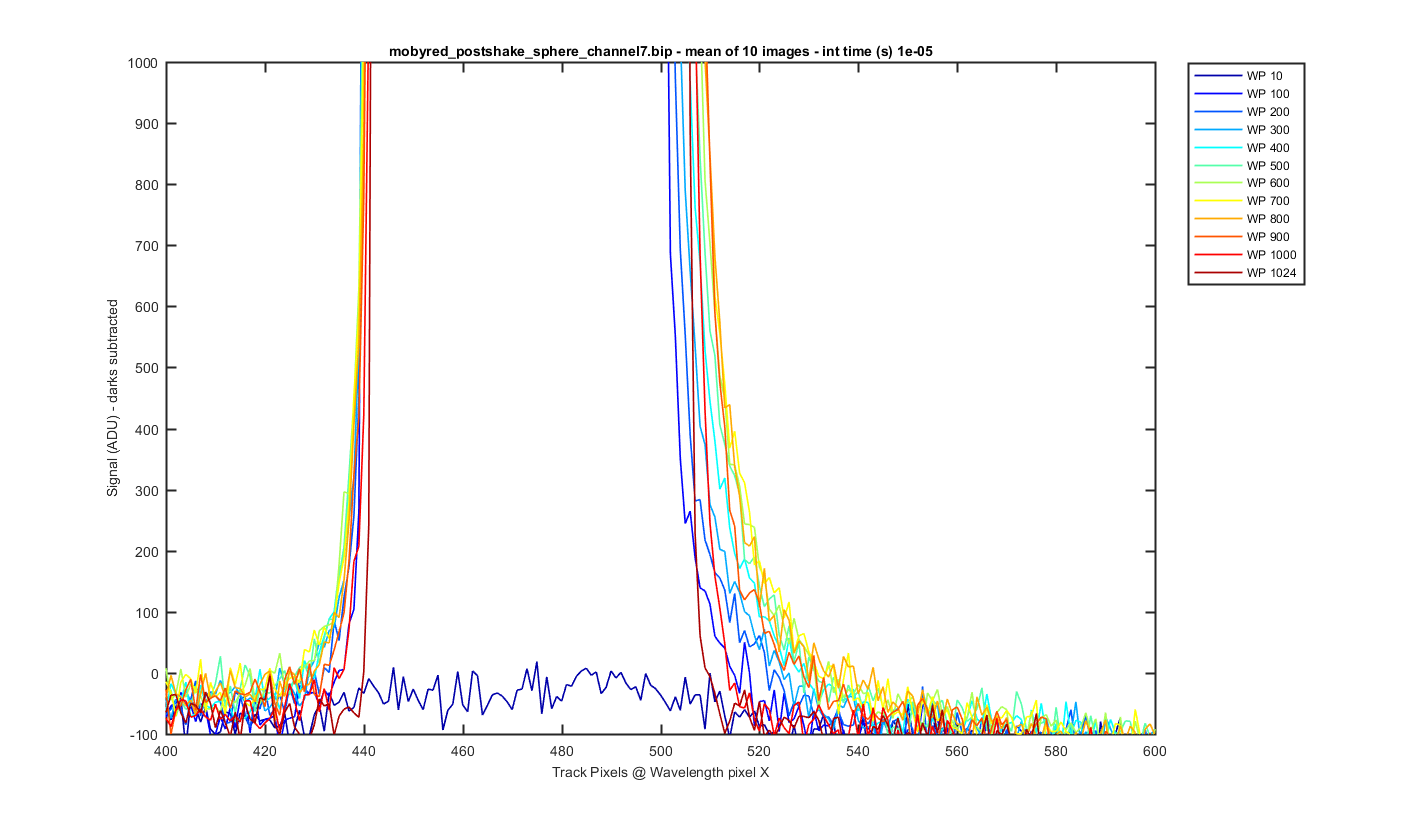
Same as figure 6 but zoomed to the bottom so you can see the darks between the tracks (darks are subtracted).
Figure 7
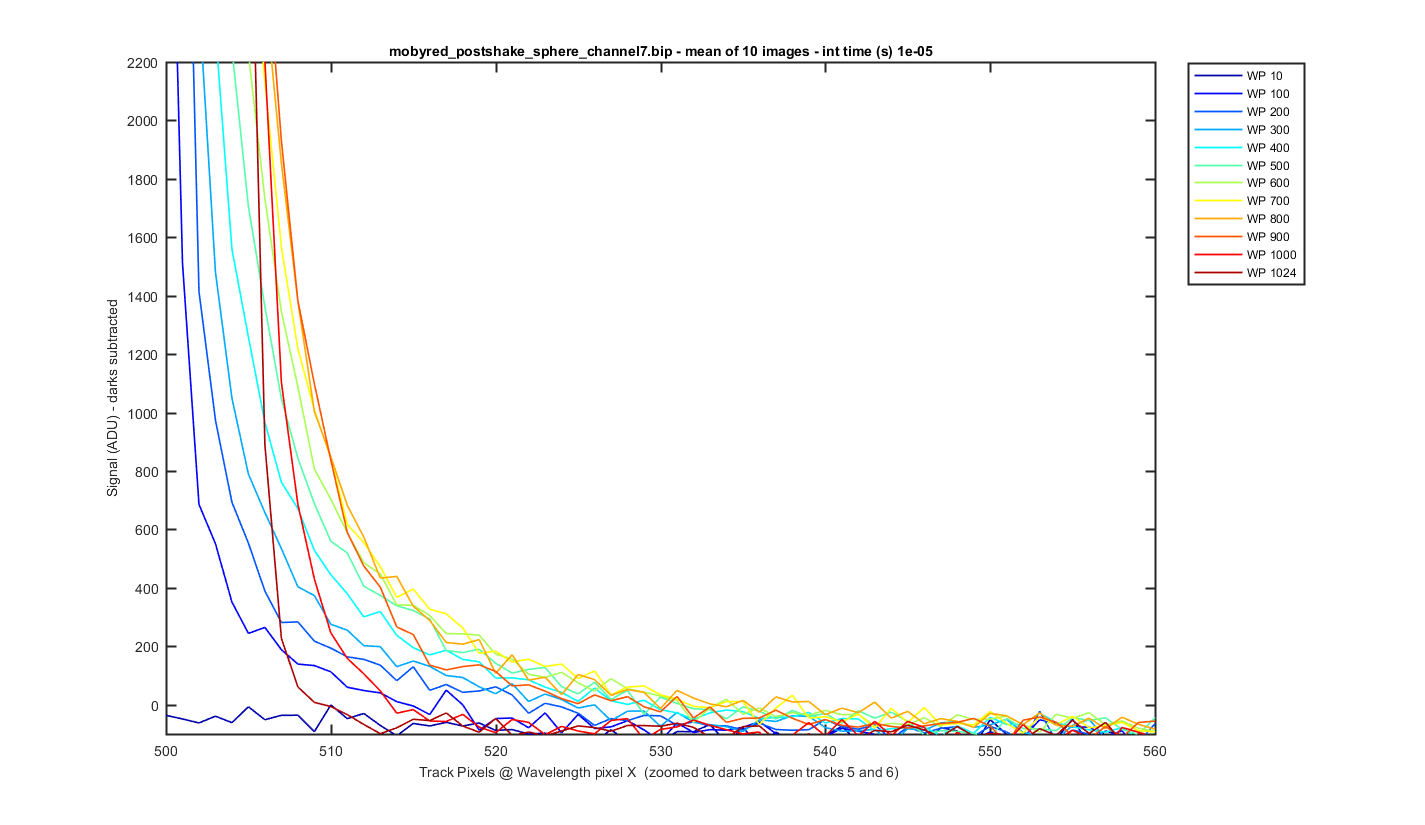
Same as figure 7 but zoomed into the dark area between tracks 5 and 6 so you can see the amount of light getting between the tracks (darks are subtracted). It varies by wavelength.
Figure 8
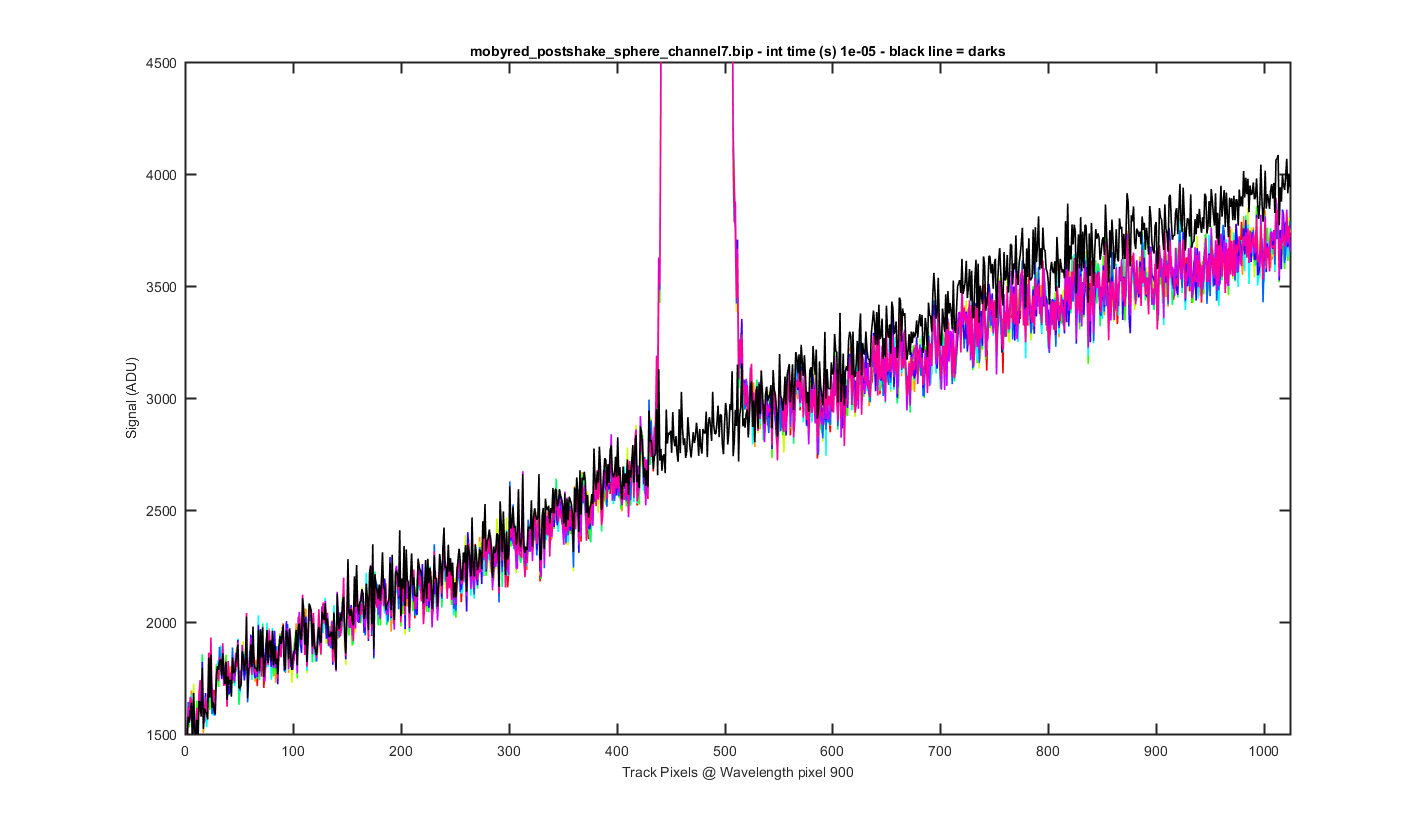
The same cross track plots but zoomed to the bottom and not dark corrected with the dark plotted at a black line (wavelength pixel 900).
Figure 9
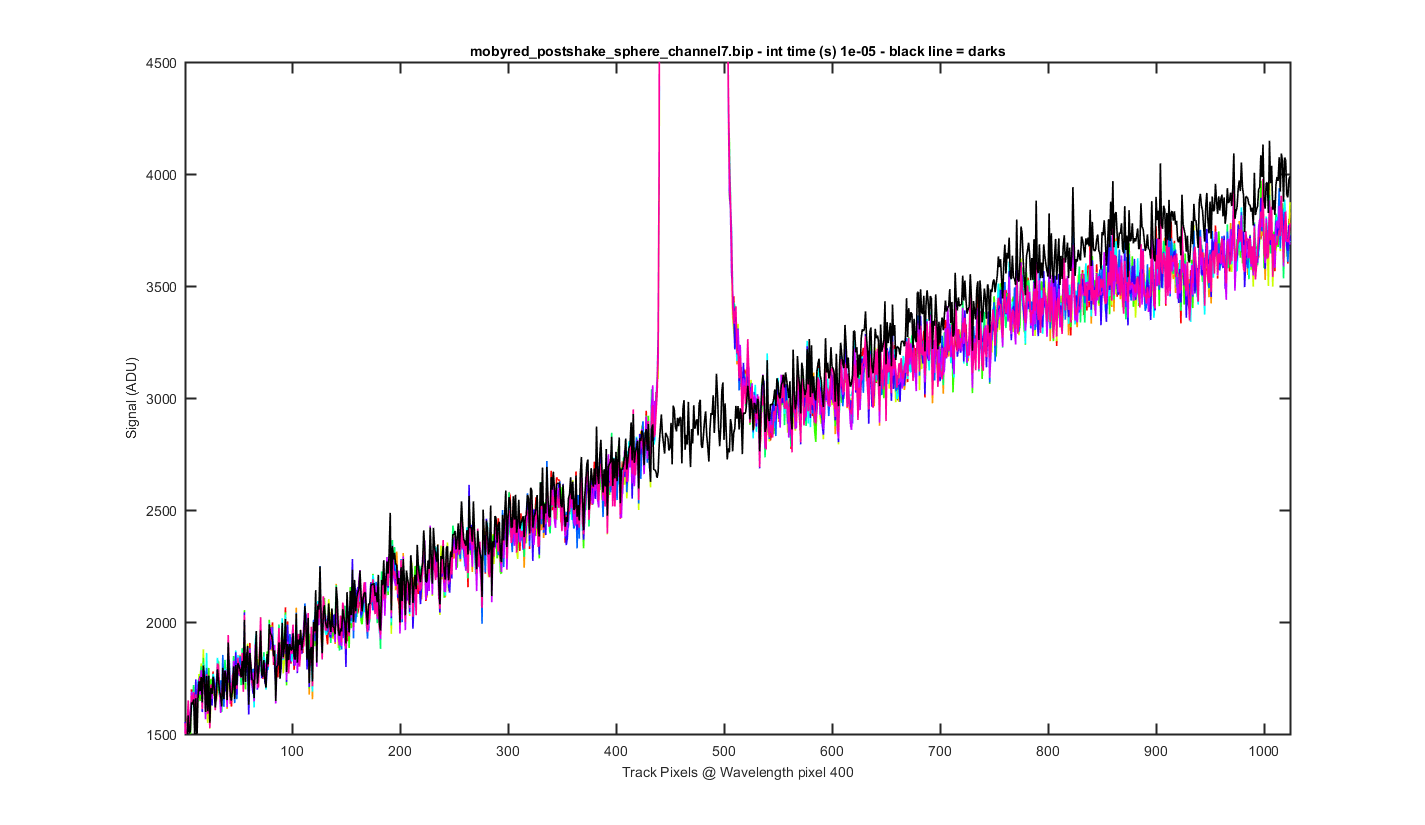
The same cross track plots but zoomed to the bottom and not dark corrected with the dark plotted at a black line (wavelength pixel 400).
Figure 10
Track data which is dark subtracted, track 8 is the only one illuminated so we can get a cross track percentage
Figure 11
A zoom in of each dark and lite for each track. You can see that subtracking 200 did not work for all the tracks. In some cases the darks are higher and in others the lights are higher.
Figure 12
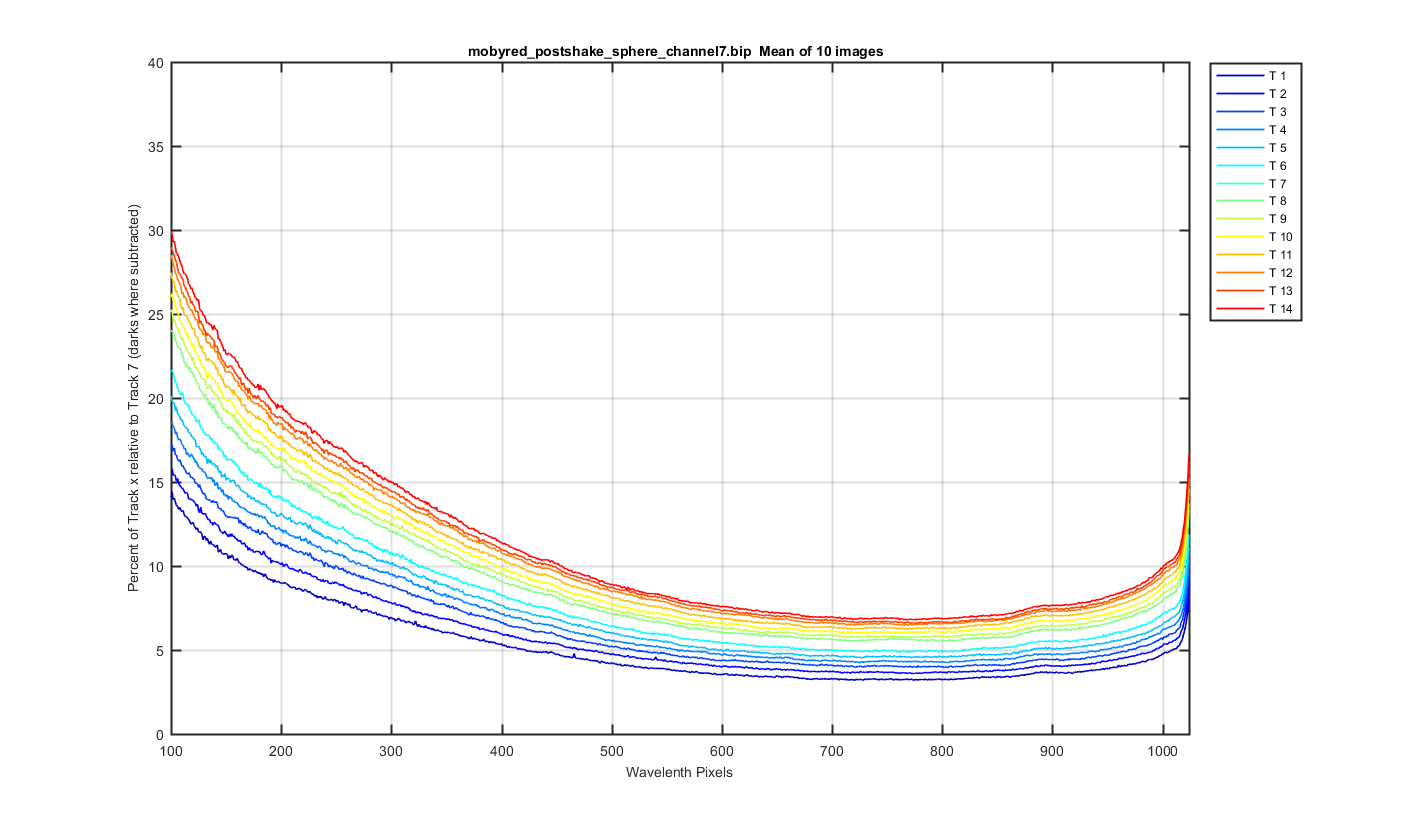
I calculated the Ratio of each track to track 7 and then multiplied bu 100 to get percentage. THis is going to be off because of the darks.
Figure 13