REVISION DATE: 19-Jun-2019 13:17:30
Below are my graphs of the rs05_sphere_100ms_dark.bip file. The file contains 10 dark images at 0.1 sec
Note some graphs are dark corrected and some are not so check the axis labels to know what you are looking at.
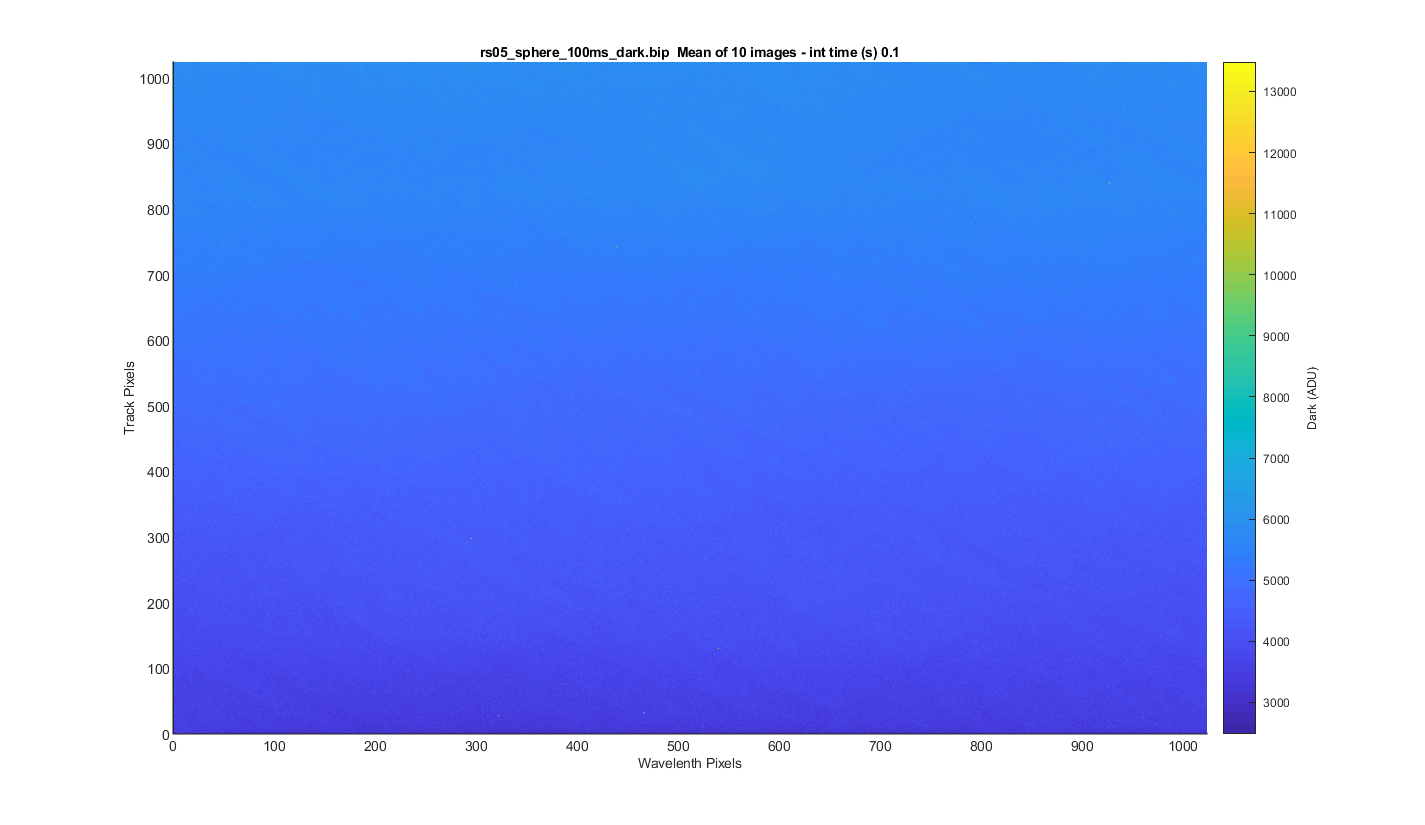
Figure 1 I meaned all 10 images to get the surface below.
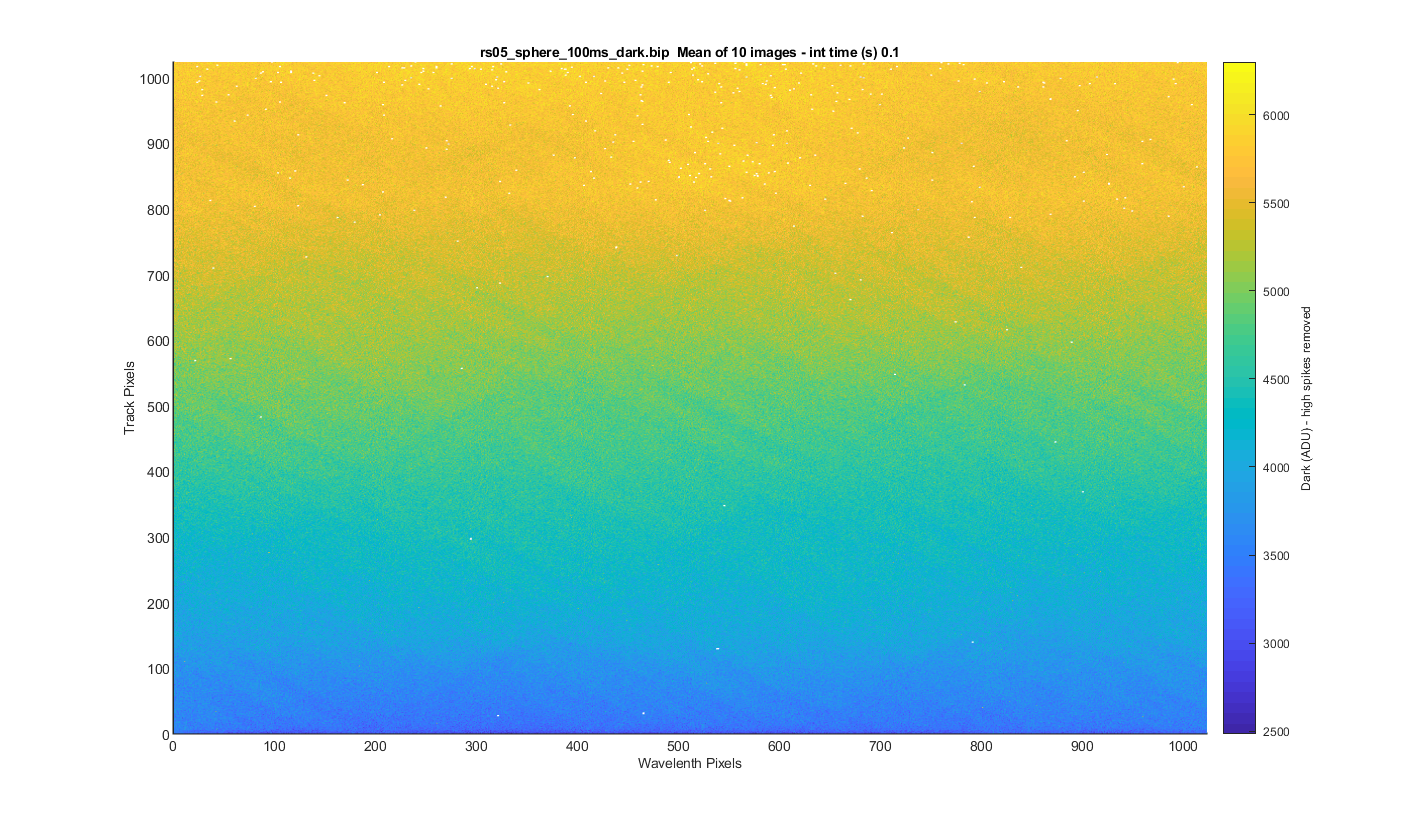
Figure 2 Same image but with the spikes removed so the colorbar works better to show the shape of the darks.
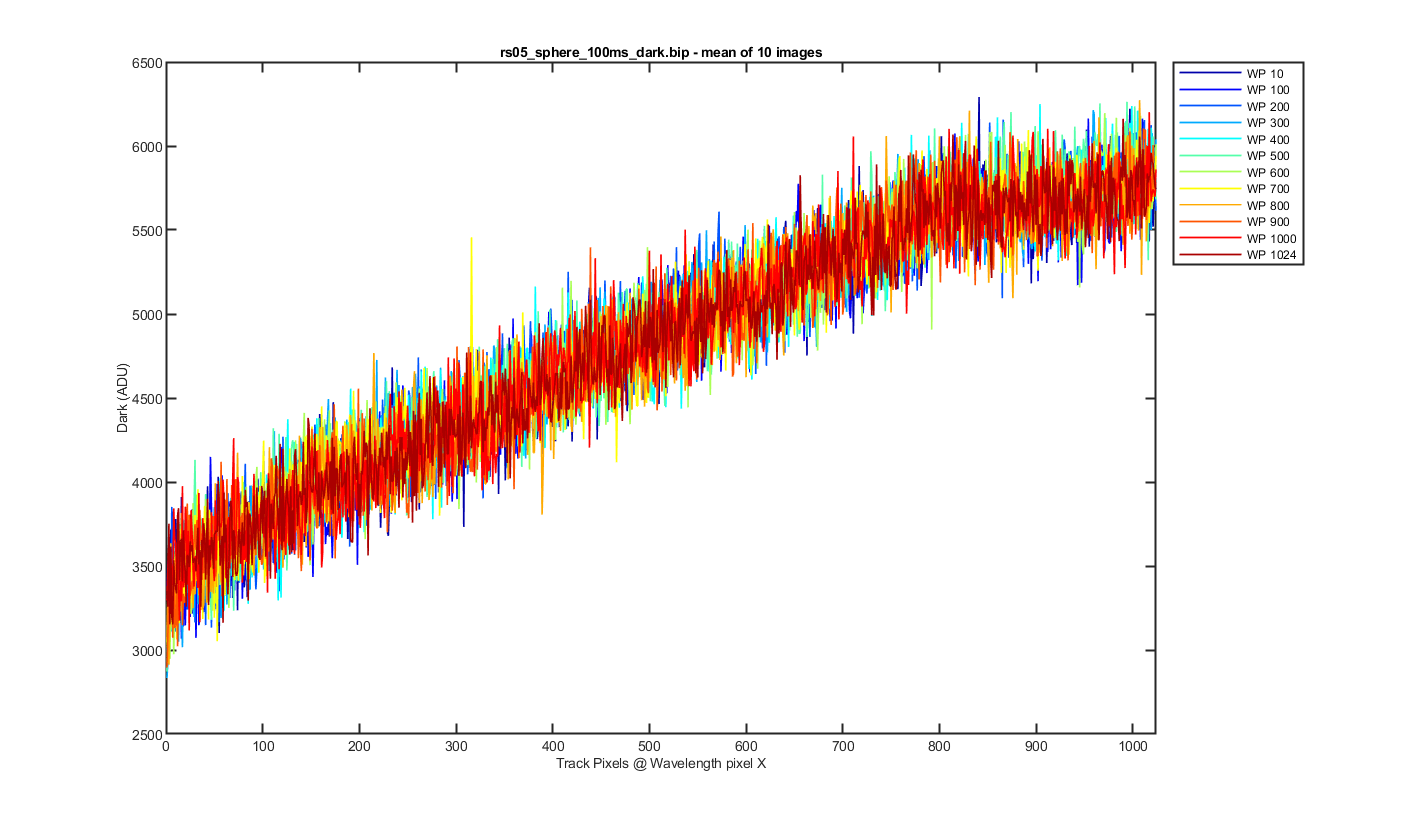
Figure 3 This is a cross section through the tracks at a number of wavelength pixels, from the mean image.
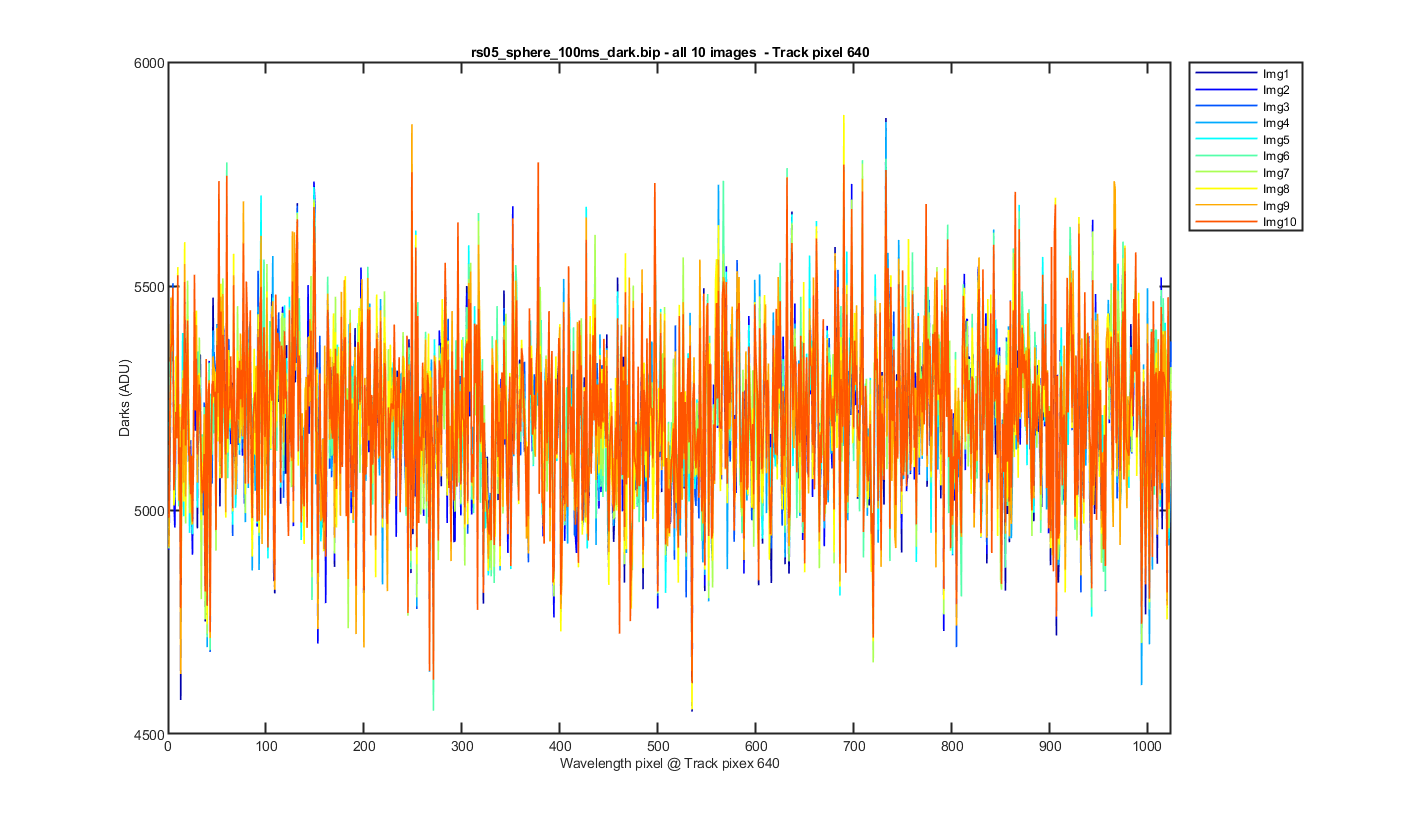
Figure 4 Data showing a track pixel at pixel 640 for all 20 dark images.
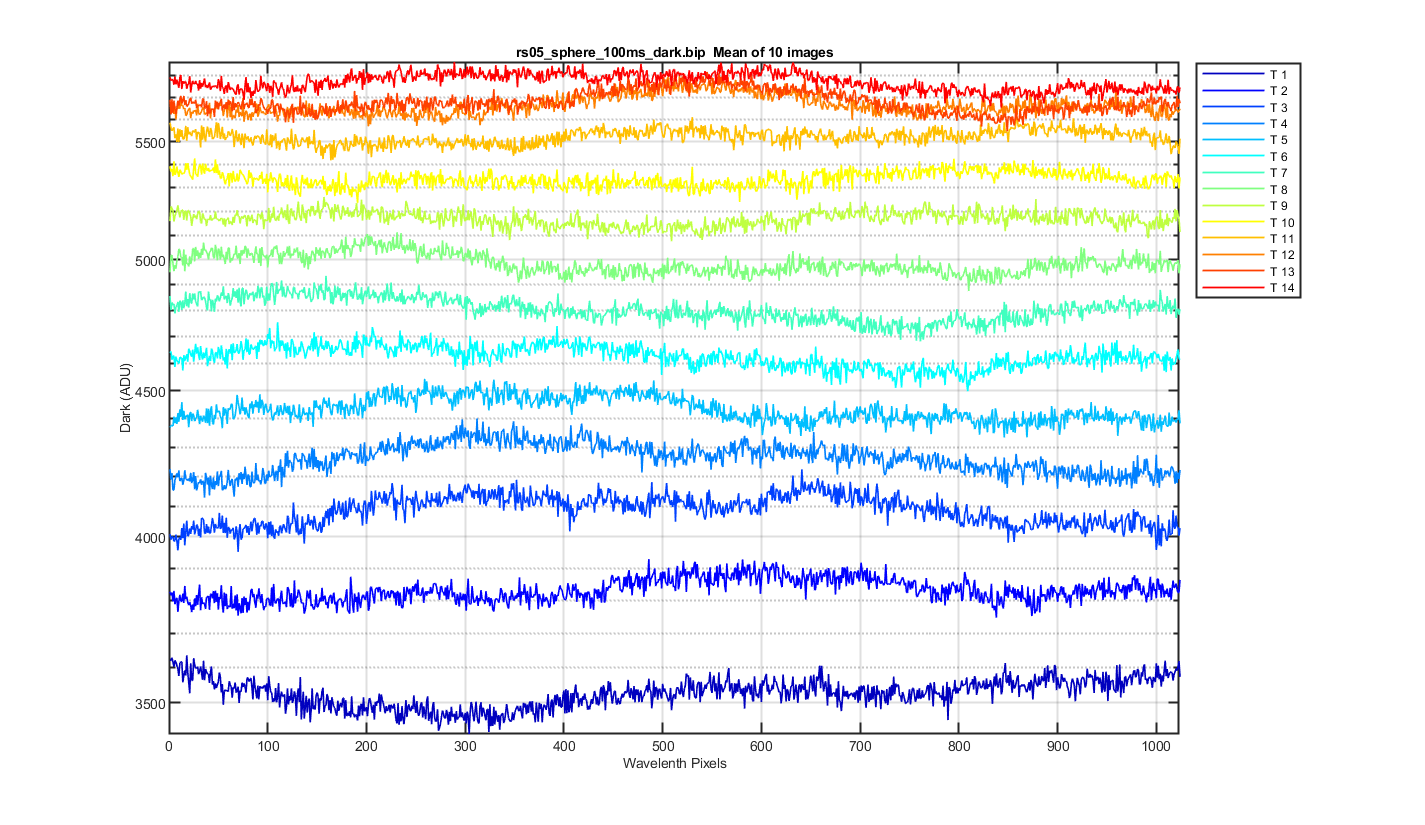
Figure 5 The darks for each track from the mean dark image.
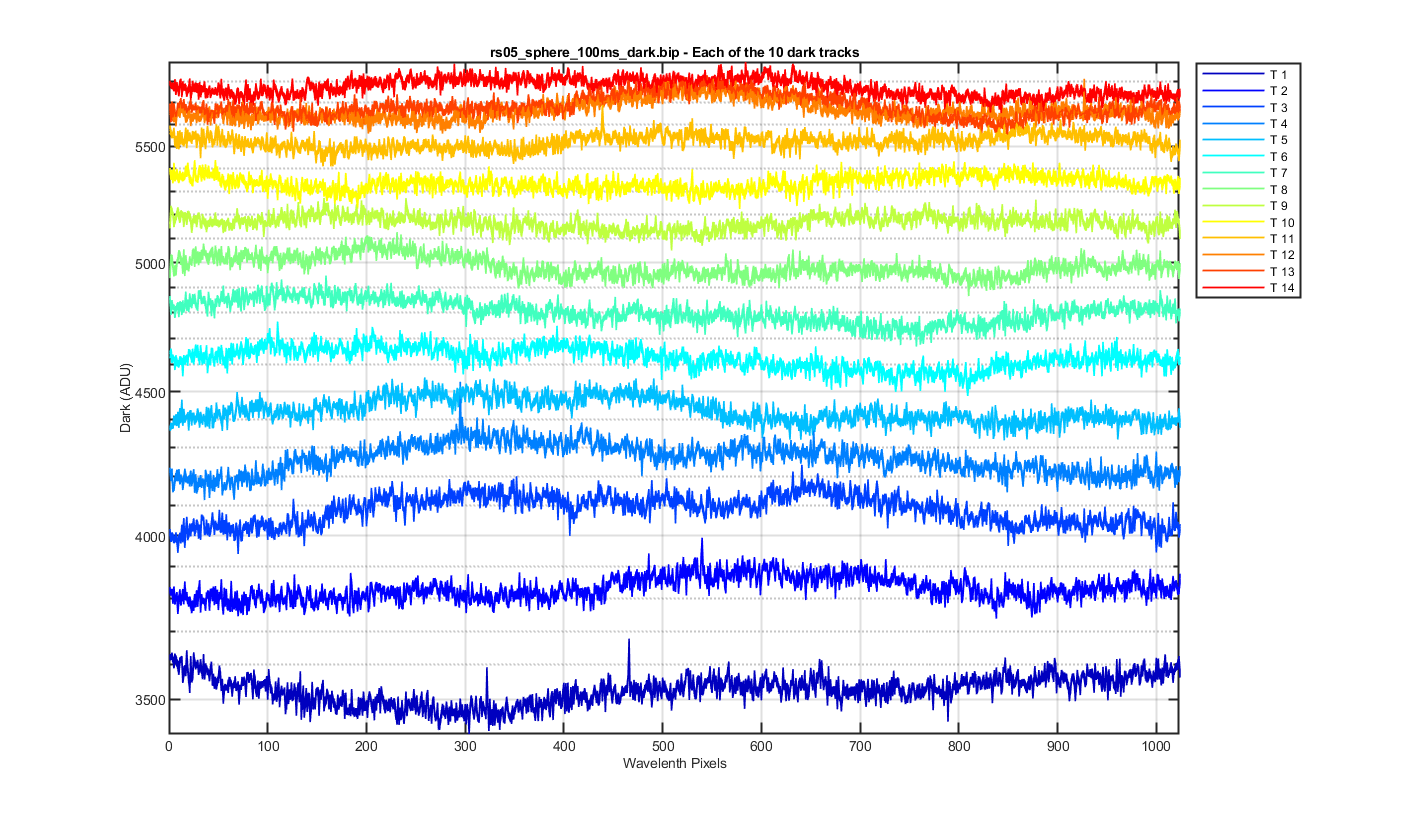
Figure 6 The darks for each track from the 10 dark images (so there are 10 for each track).