REVISION DATE: 05-Nov-2019 13:38:46
Below are my graphs of the helium.bip file. The file contains 10 dark images. Note some graphs are dark corrected and some are not so check the axis labels to know what you are looking at.
Track Wavelength fits:
P(1,:) = [7.645604e-09  4.153781e-06     0.3924551      503.0277];
P(2,:) = [-5.115323e-11  1.309043e-05     0.3891054      503.4433];
P(3,:) = [-1.628289e-09  1.494572e-05     0.3883651      503.5427];
P(4,:) = [-1.191324e-08  2.721072e-05     0.3837754      504.0692];
P(5,:) = [-4.695187e-08  6.919371e-05     0.3680332      505.8165];
P(6,:) = [-2.254525e-08  3.988322e-05     0.3790053      504.6306];
P(7,:) = [-2.568753e-08  4.358926e-05      0.377632      504.8033];
P(8,:) = [-2.296977e-08  4.037049e-05     0.3788265      504.6492];
P(9,:) = [-2.193395e-08  3.913114e-05     0.3792941      504.5821];
P(10,:) = [-1.158288e-09  1.532355e-05     0.3878987       503.628];
P(11,:) = [4.071348e-09  8.881809e-06     0.3903604      503.3535];
P(12,:) = [5.435819e-09  7.130283e-06     0.3910662      503.2613];
P(13,:) = [1.090083e-09   1.19844e-05     0.3894051      503.4322];
P(14,:) = [-6.04846e-09  2.019427e-05      0.386522      503.7234];
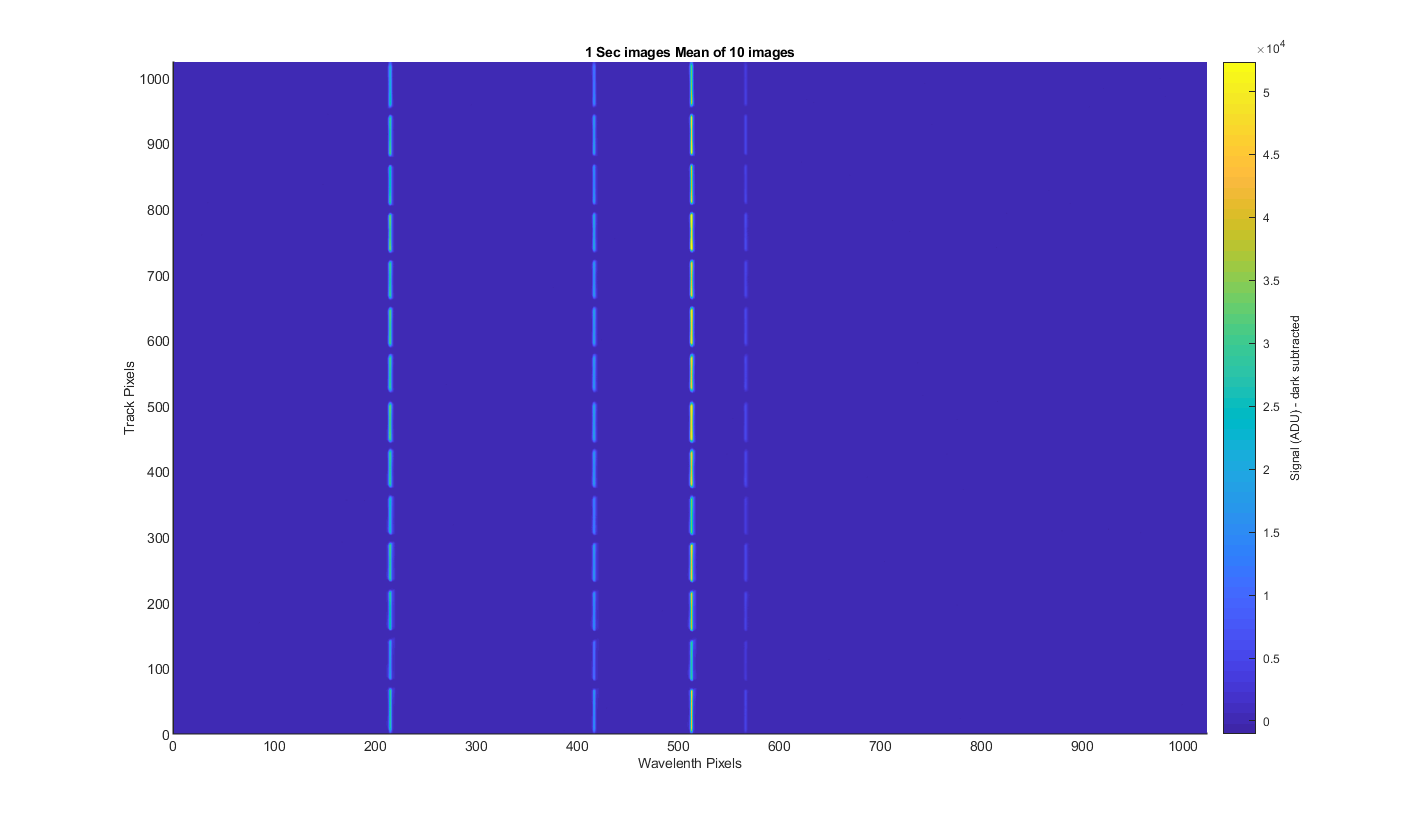
Figure 1 I took the 10 images and meaned them to get the surface plot below.
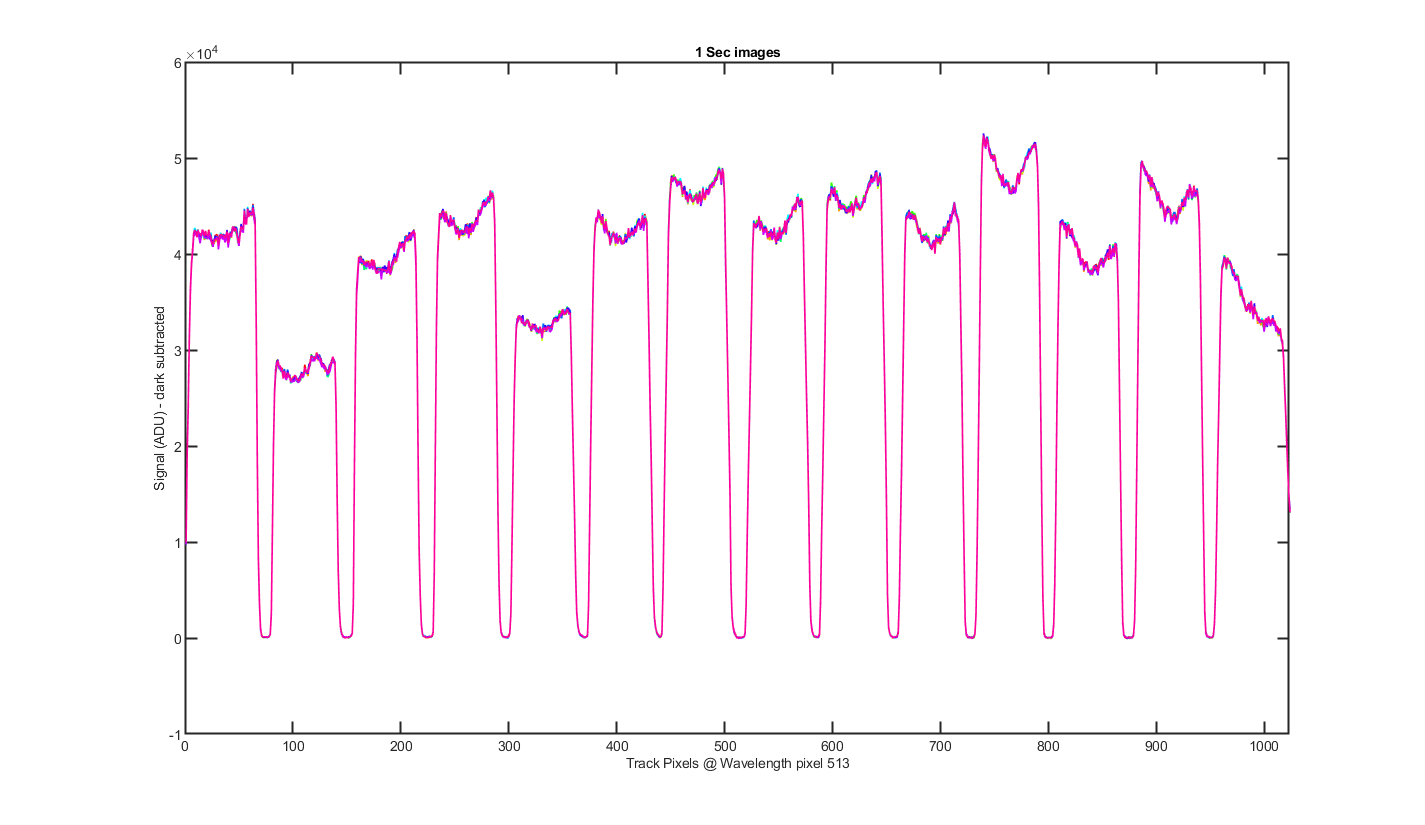
Figure 2 This is a cross section through the tracks at wavelength pixel 501, with one line for each of the 10 images. The tracks and their shapes look really stable.
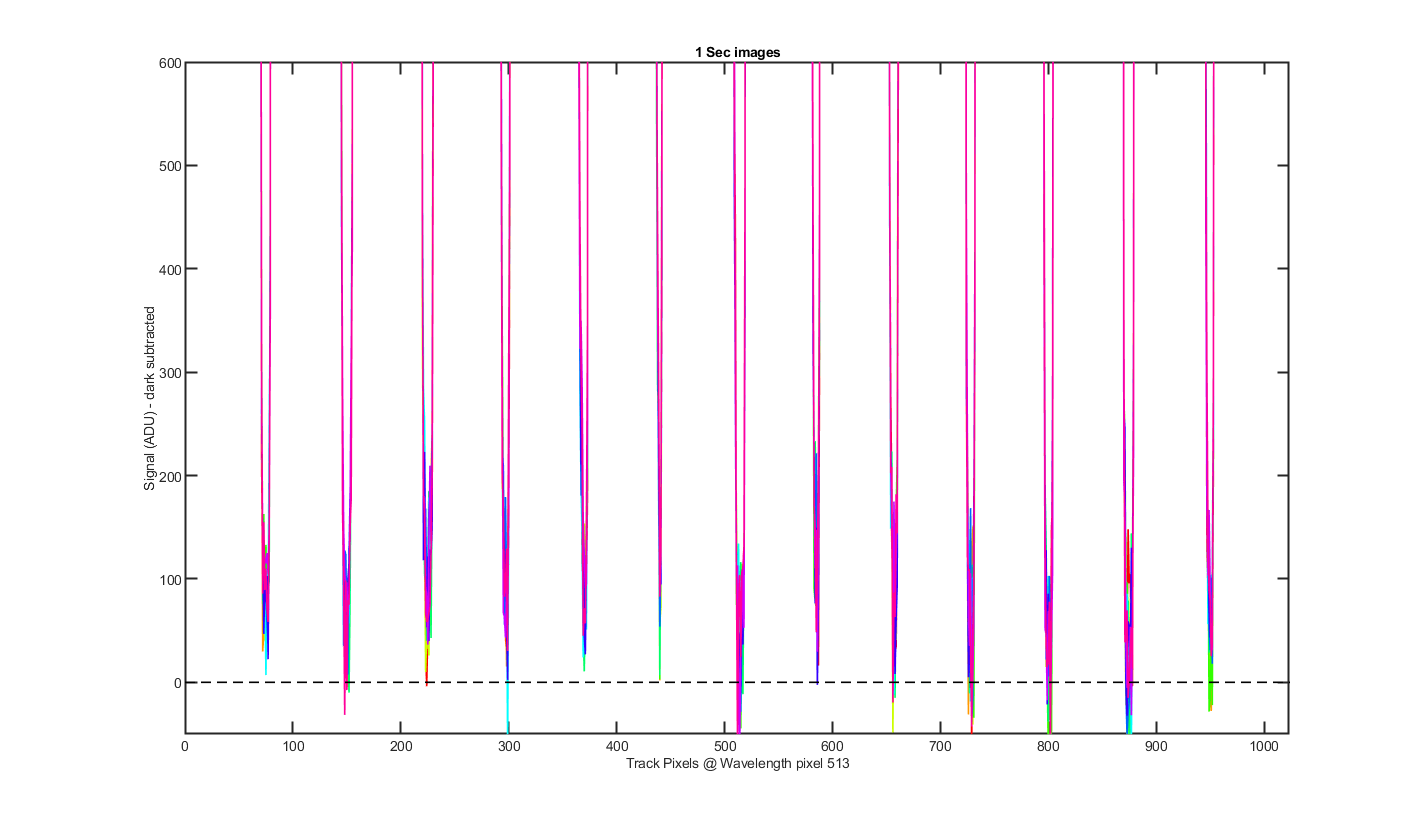
Figure 3 Same as the previous graph but zoomed into the bottom to see the level of the darks between the tracks.
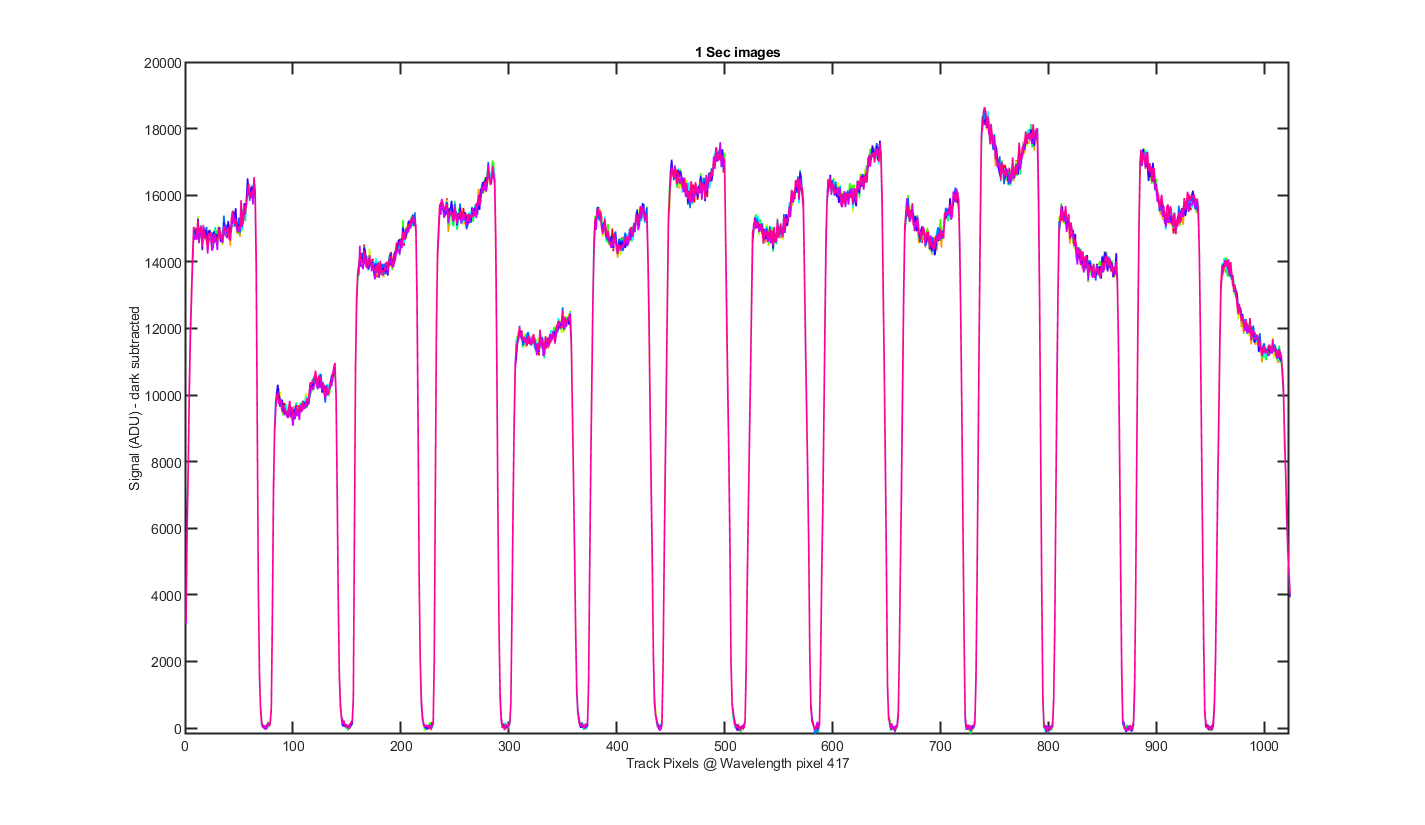
Figure 4 Same as figure 2 but for Wavelength pixel 405.
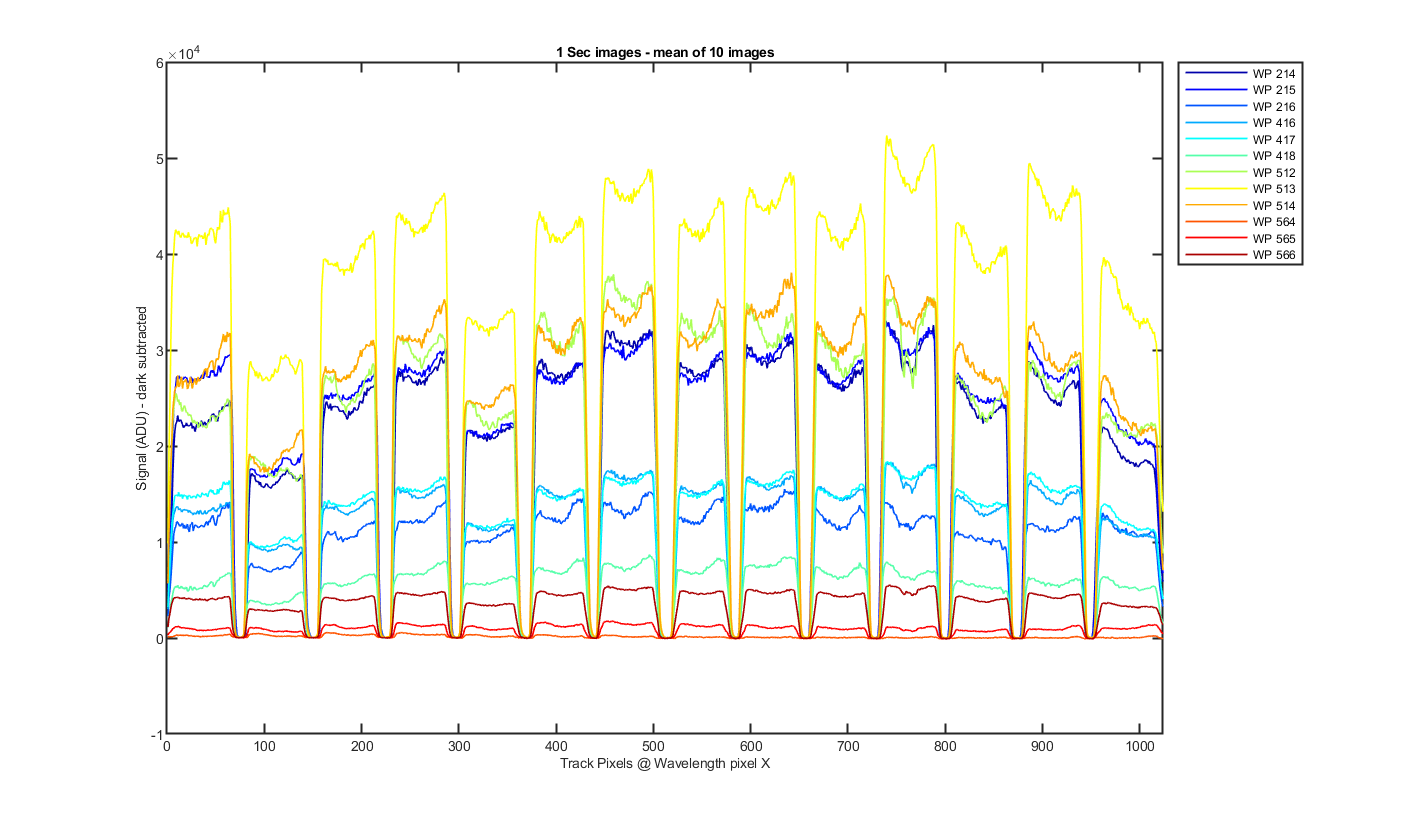
Figure 5 Again this is the mean image with slices thought the image at different wavelength pixels. The pixels choosen are where the helium peaks are and +- pixel pixel around them.
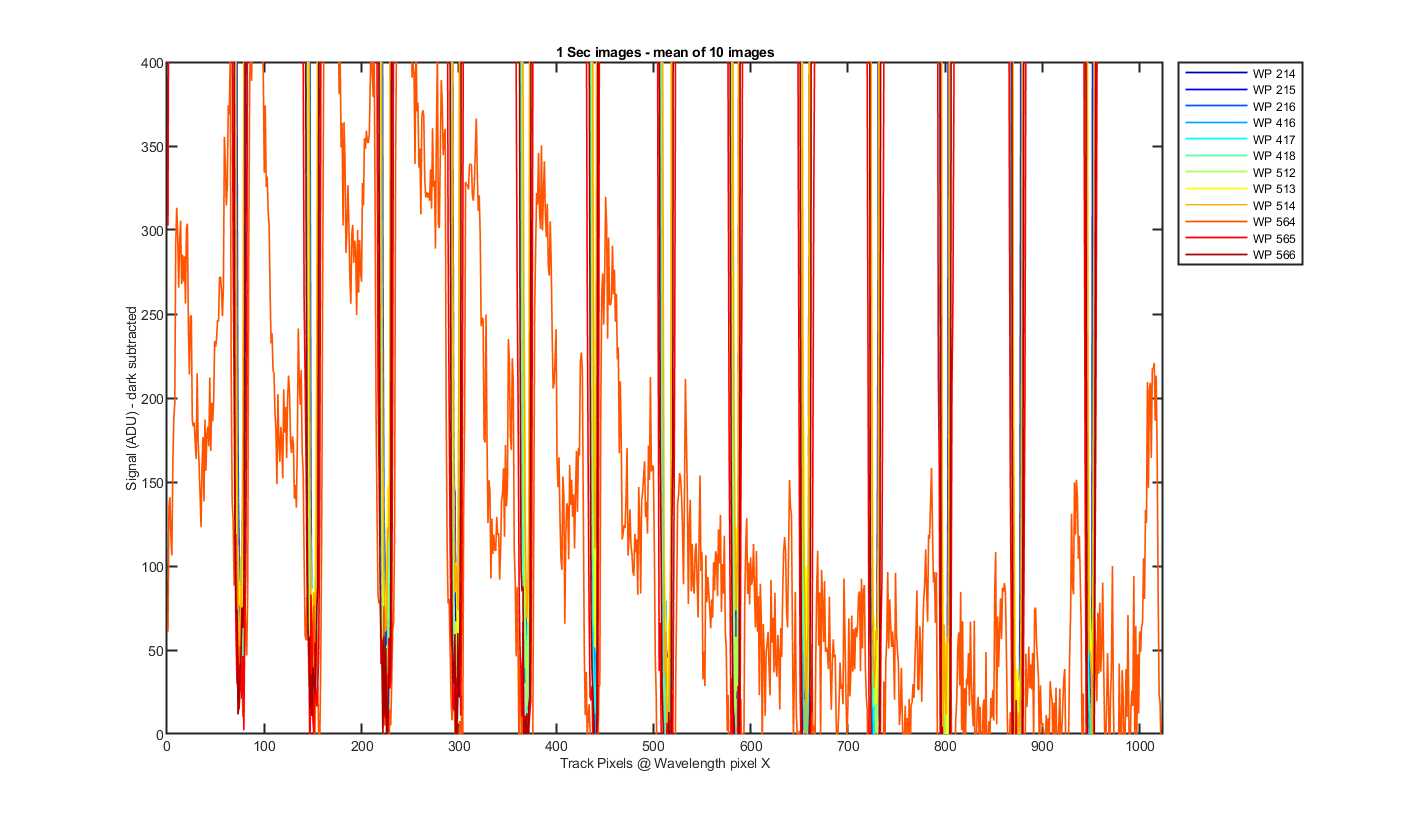
Figure 6 Same as figure 5 but zoomed to the bottom so you can see the darks between the tracks.
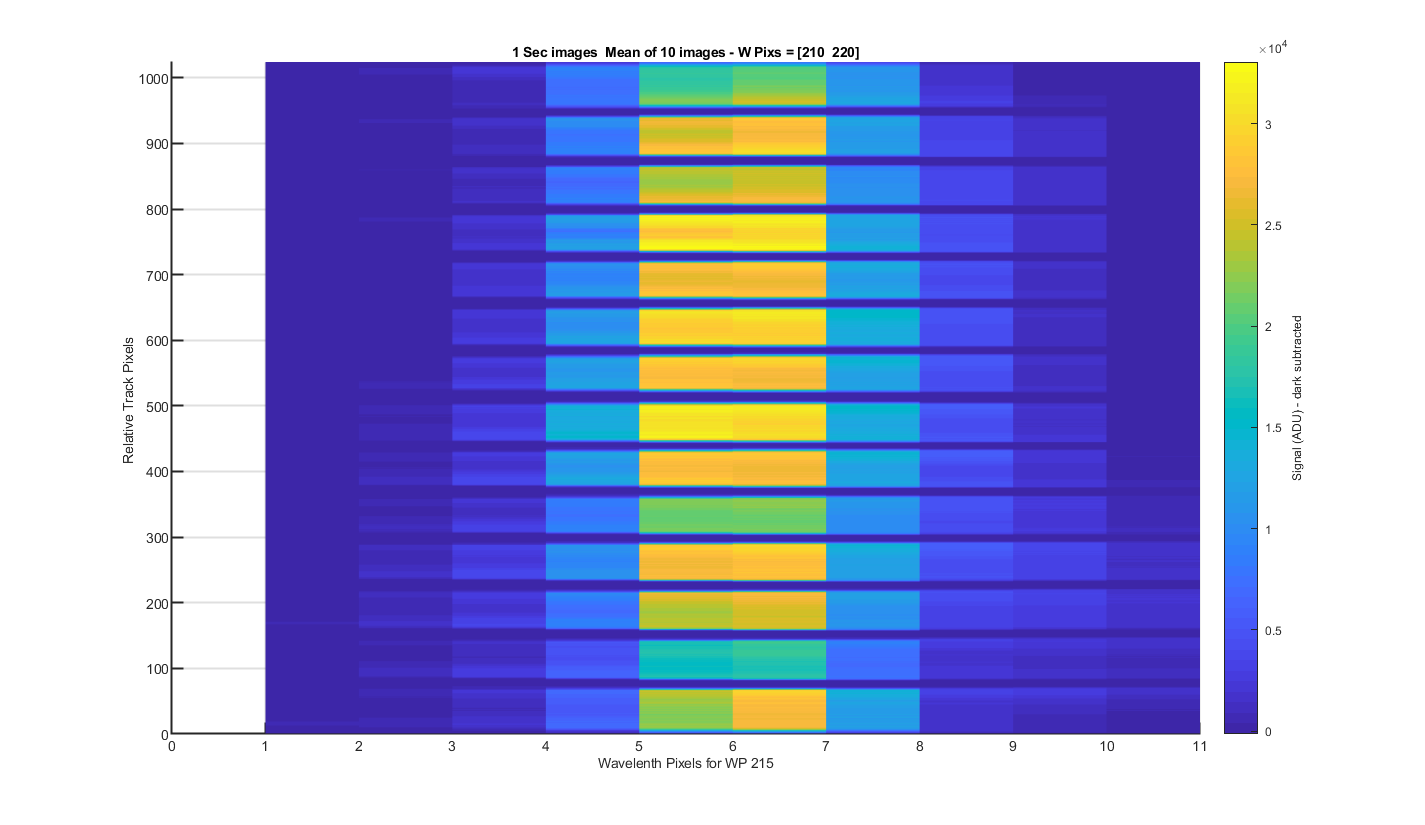
Figure 7 Helium Peak 1 (at pix 215): The same surface plot but showing how individual helium peaks line up from track to track. Looks pretty good!
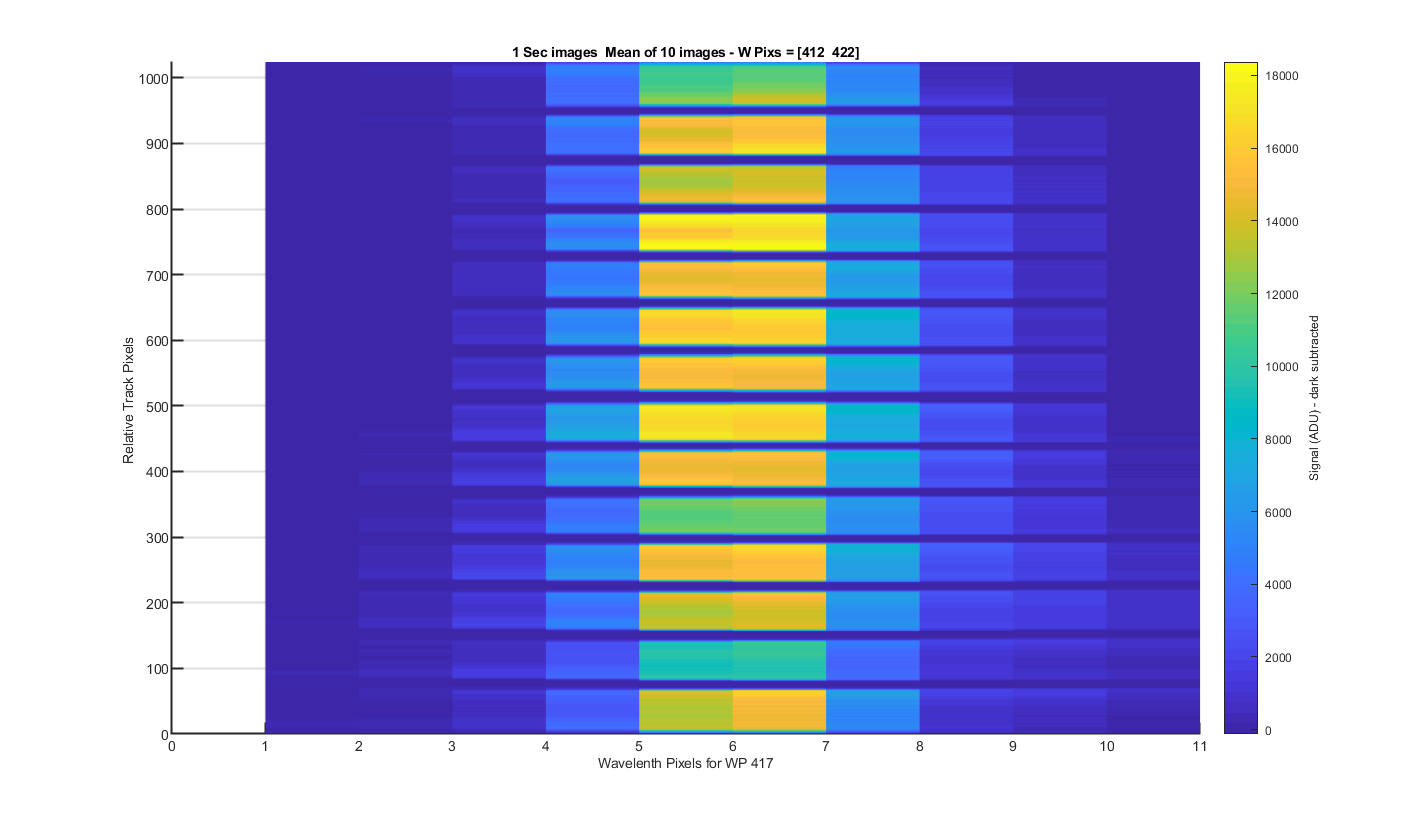
Figure 8 Helium Peak 2 (at pix 417): The same surface plot but showing how individual helium peaks line up from track to track. Looks pretty good!
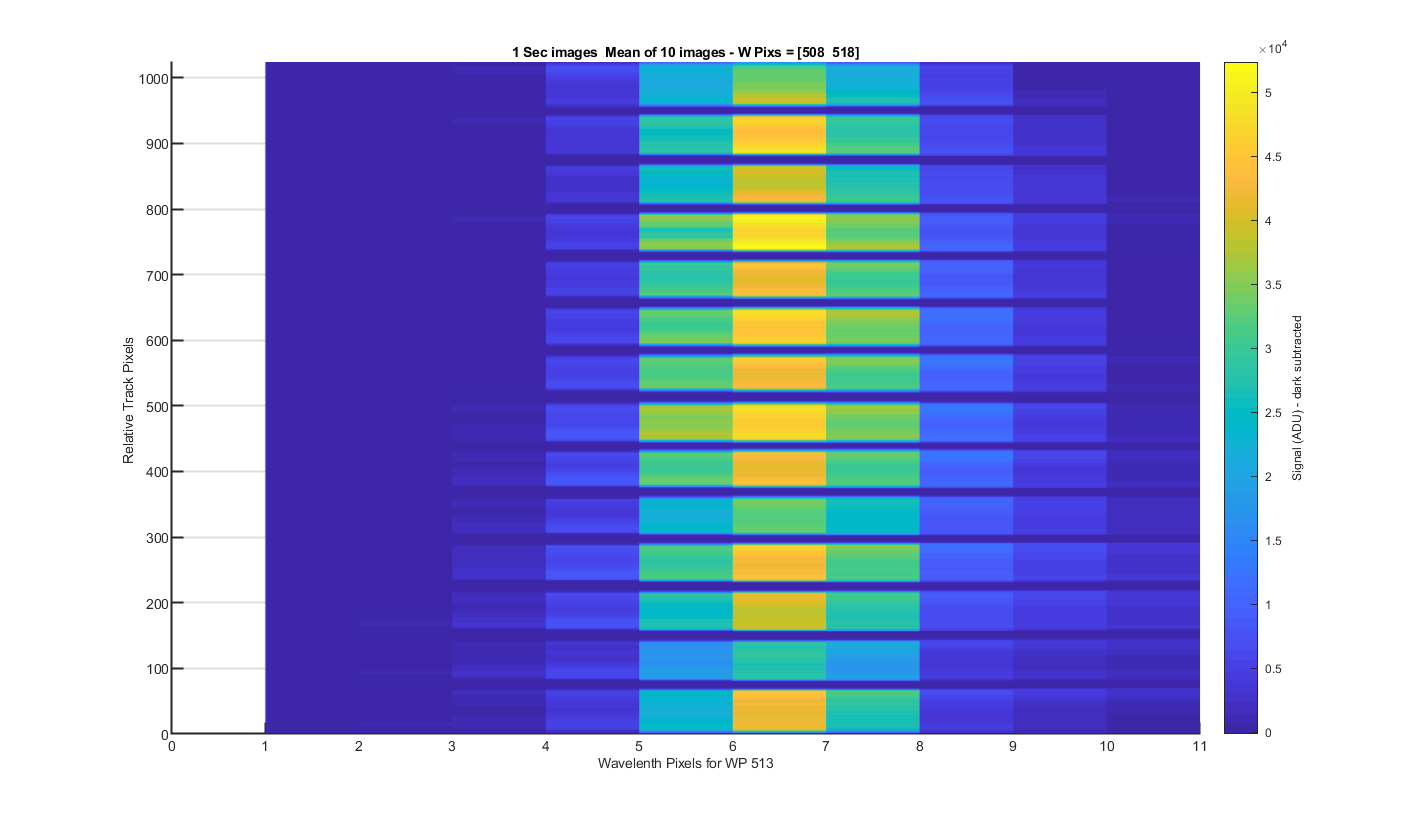
Figure 9 Helium Peak 3 (at pix 513): The same surface plot but showing how individual helium peaks line up from track to track. Looks pretty good!
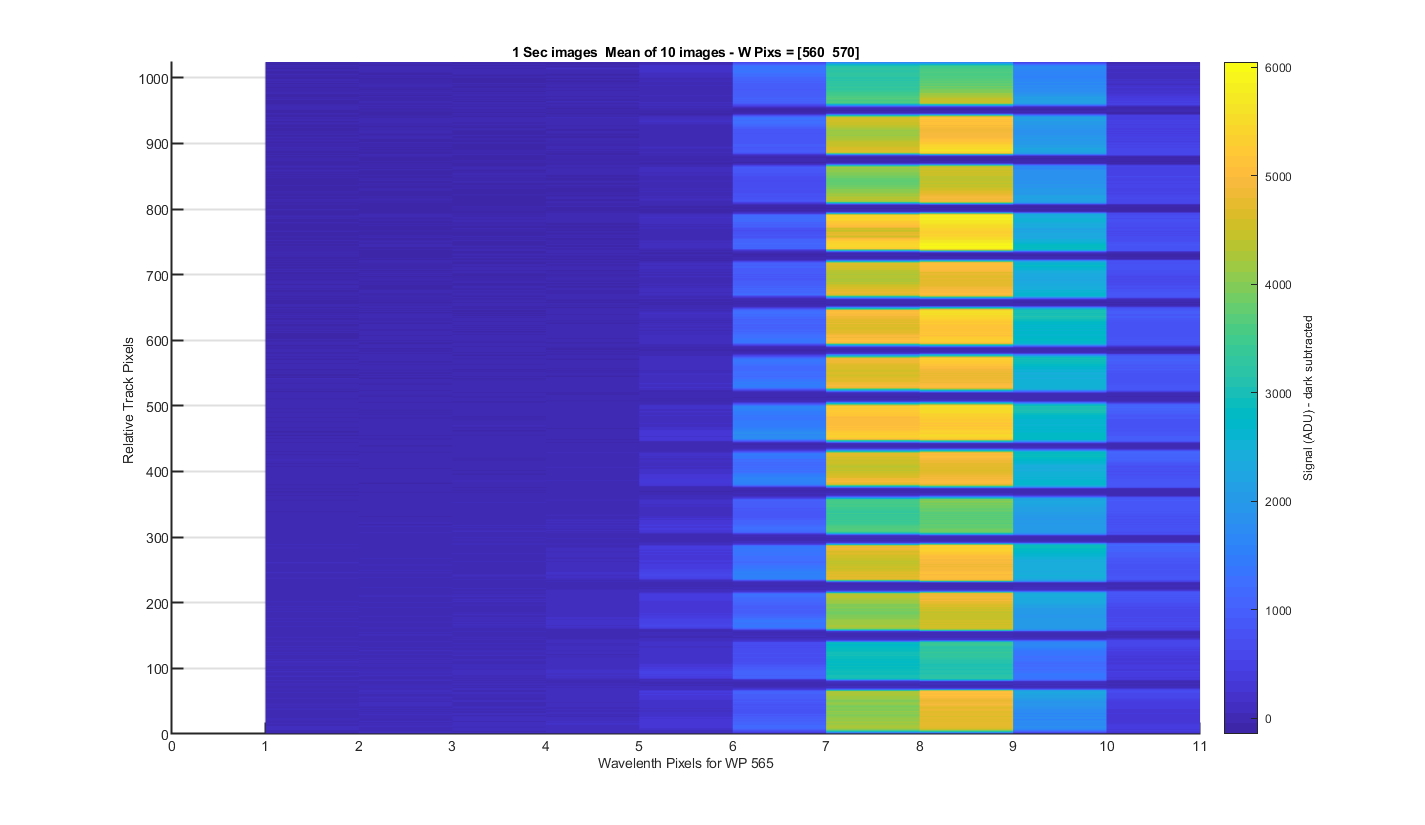
Figure 10 Helium Peak 4 (at pix 565): The same surface plot but showing how individual helium peaks line up from track to track. Looks pretty good!
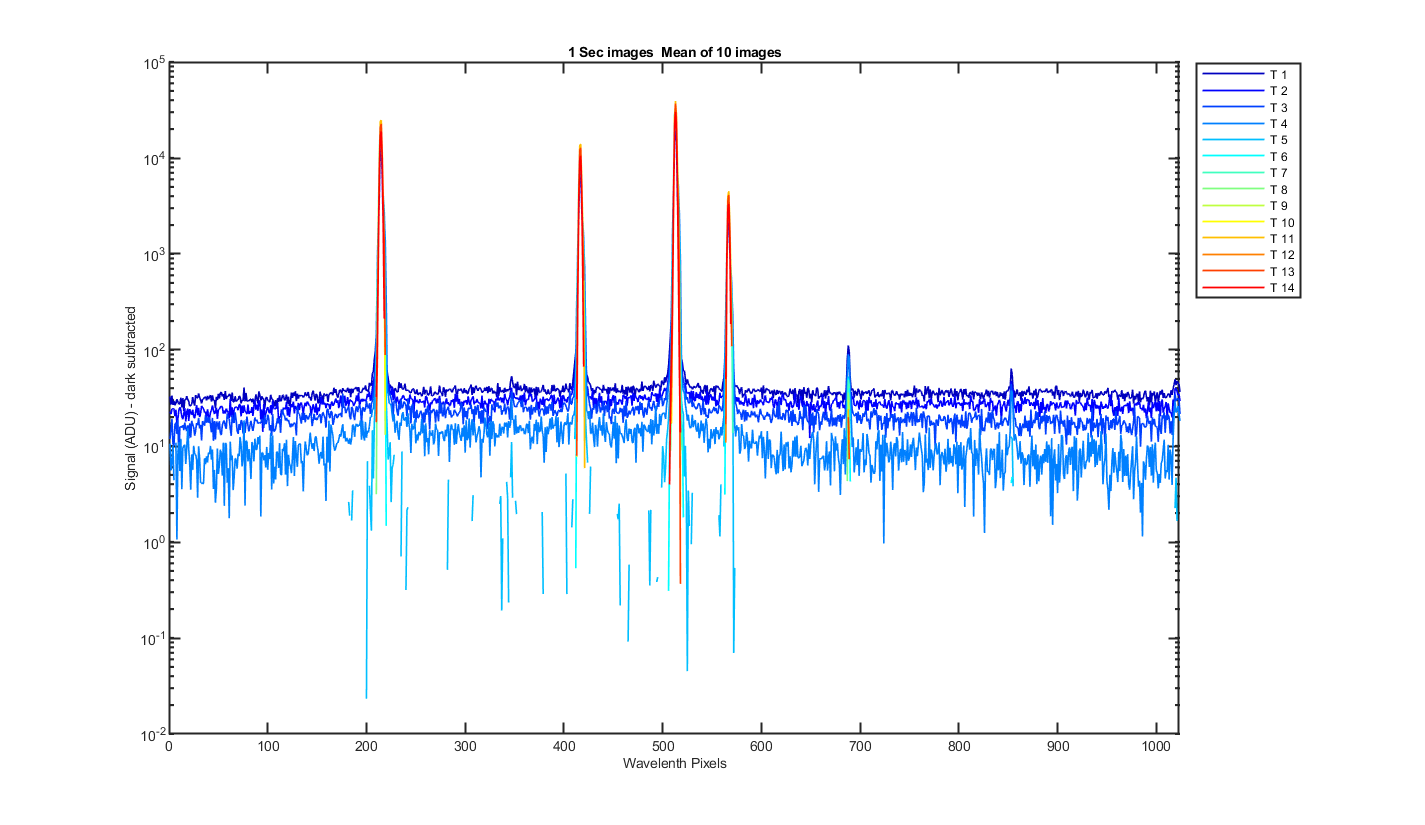
Figure 11 Mean image binned by track, the x-axis is wavelength pixels.
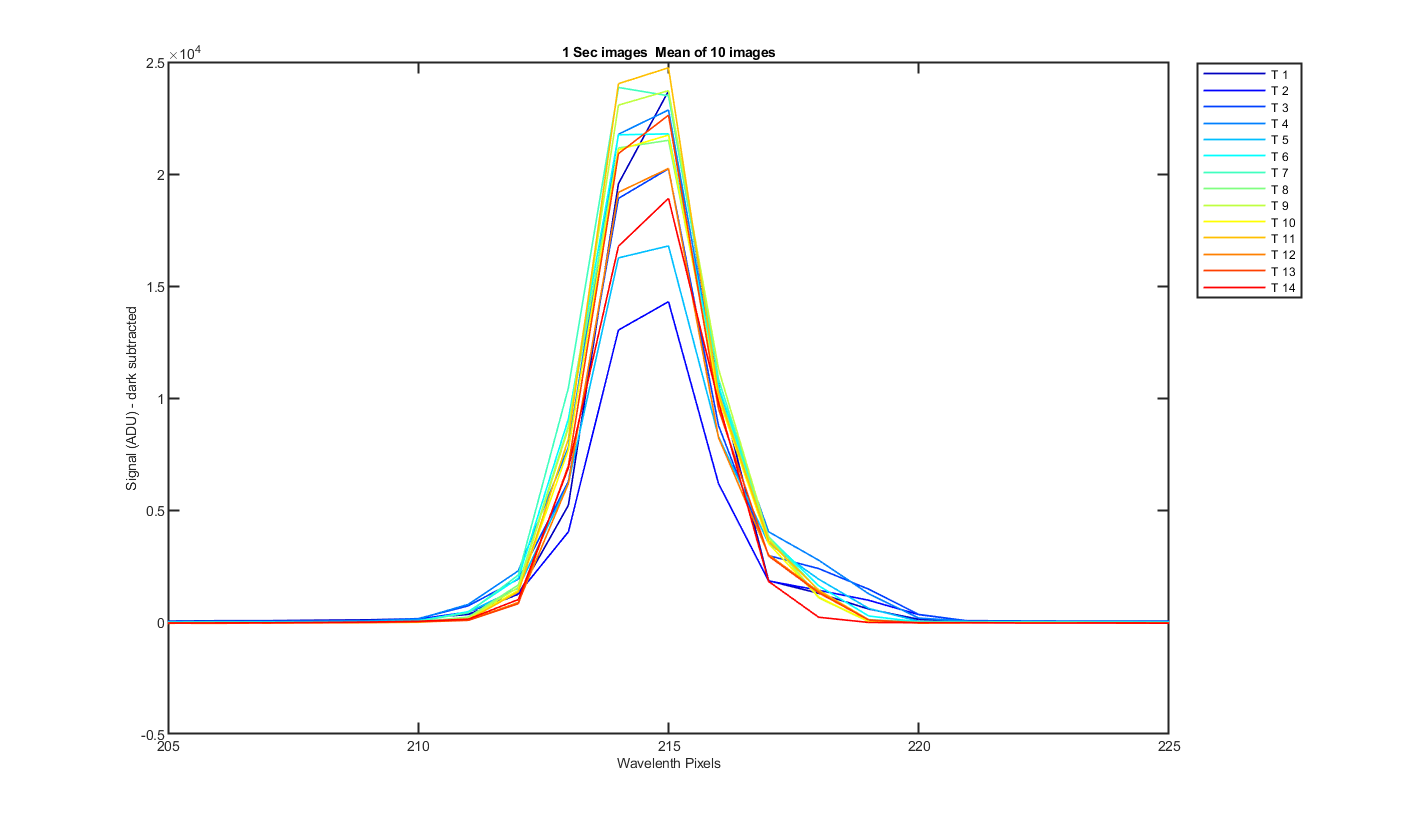
Figure 12 Close up of one of the helium peaks
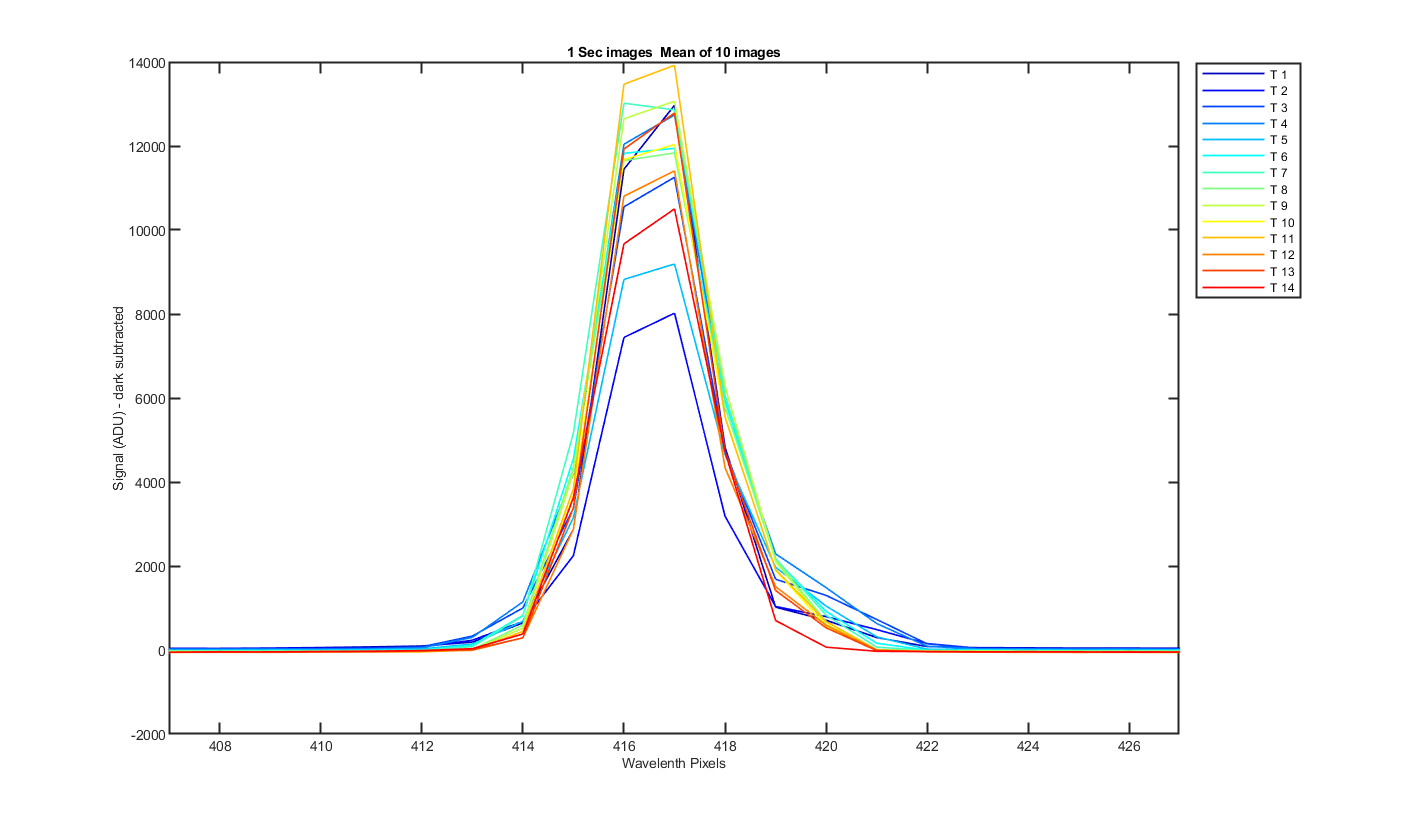
Figure 13 Close up of one of the helium peaks
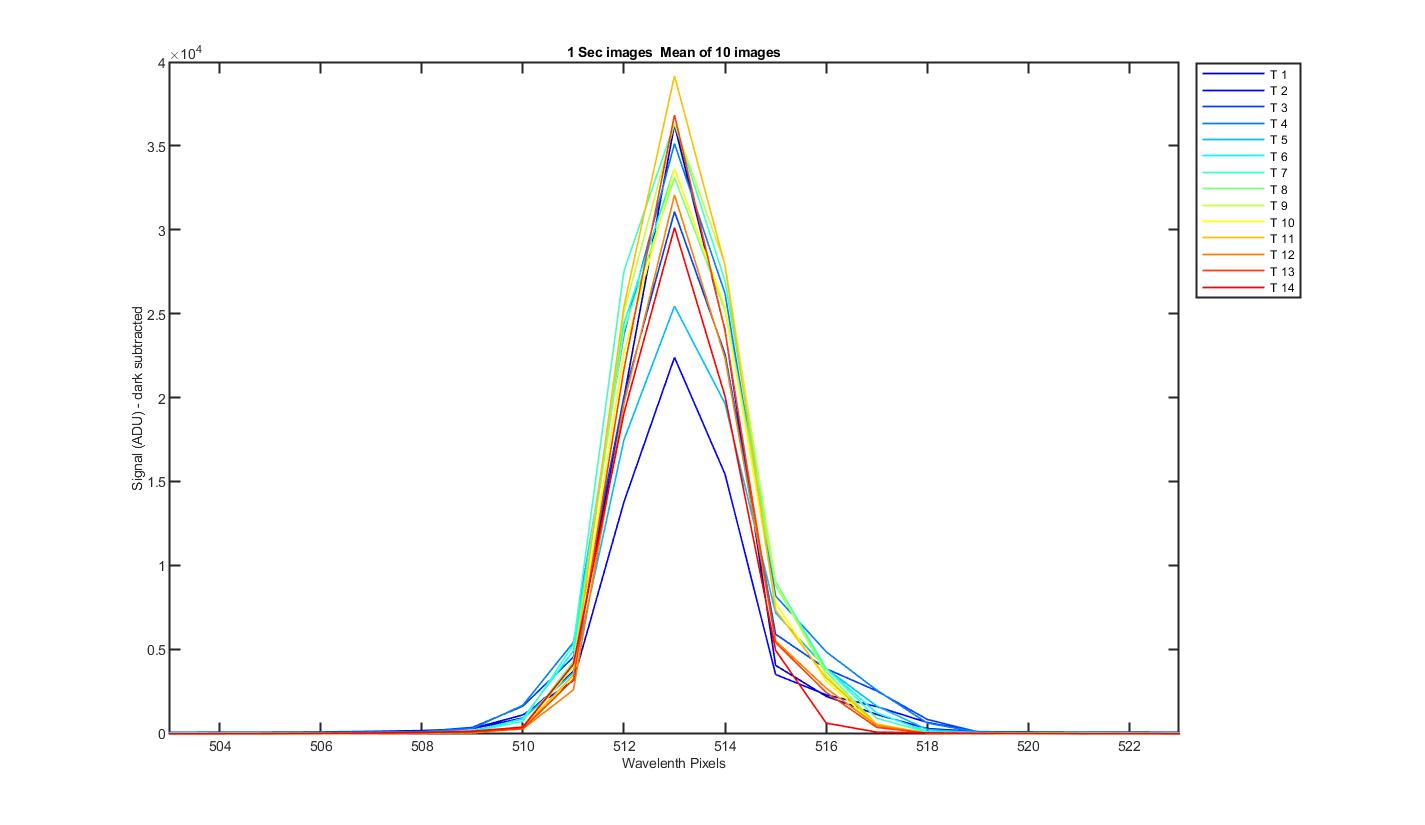
Figure 14 Close up of one of the helium peaks
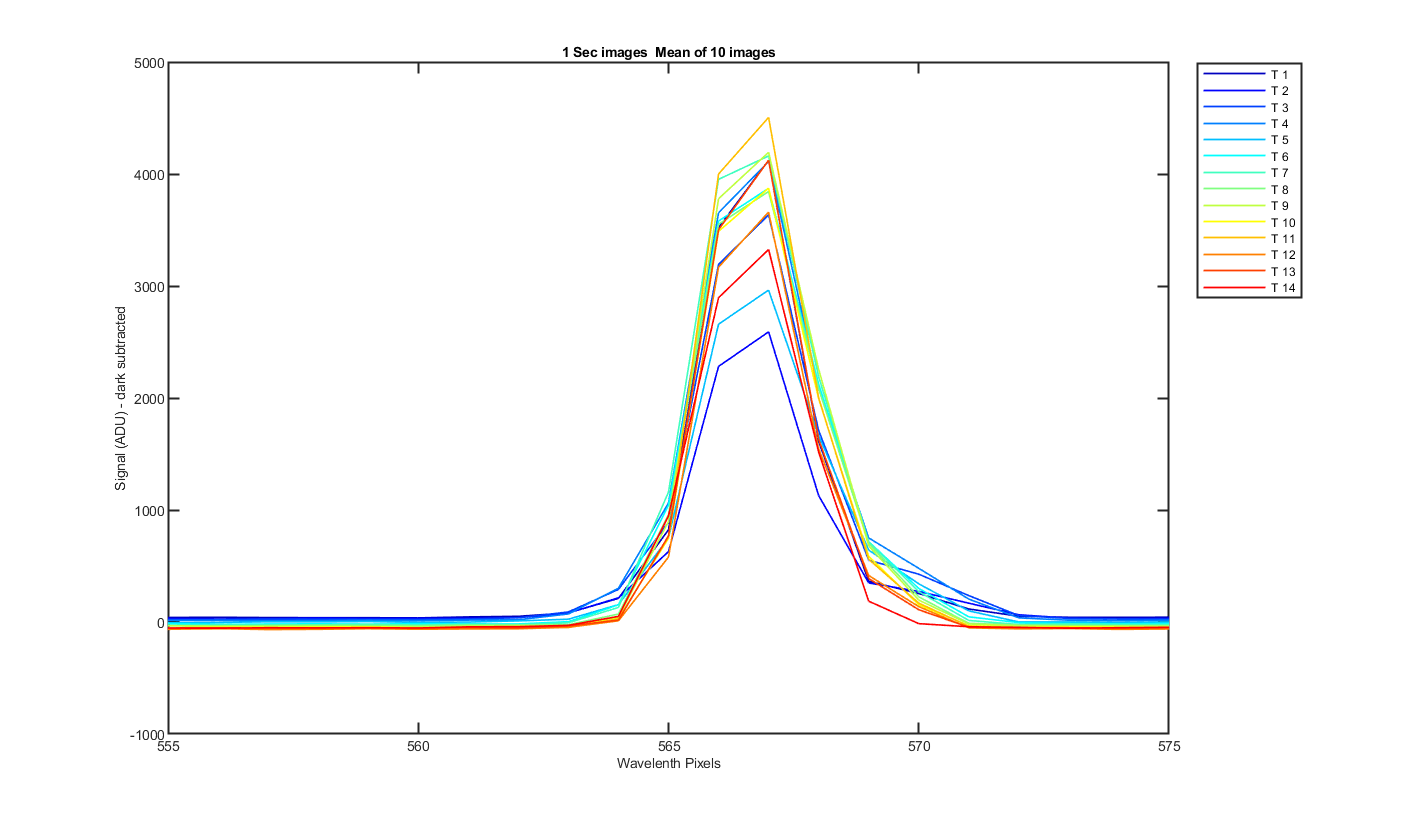
Figure 15 Close up of one of the helium peaks
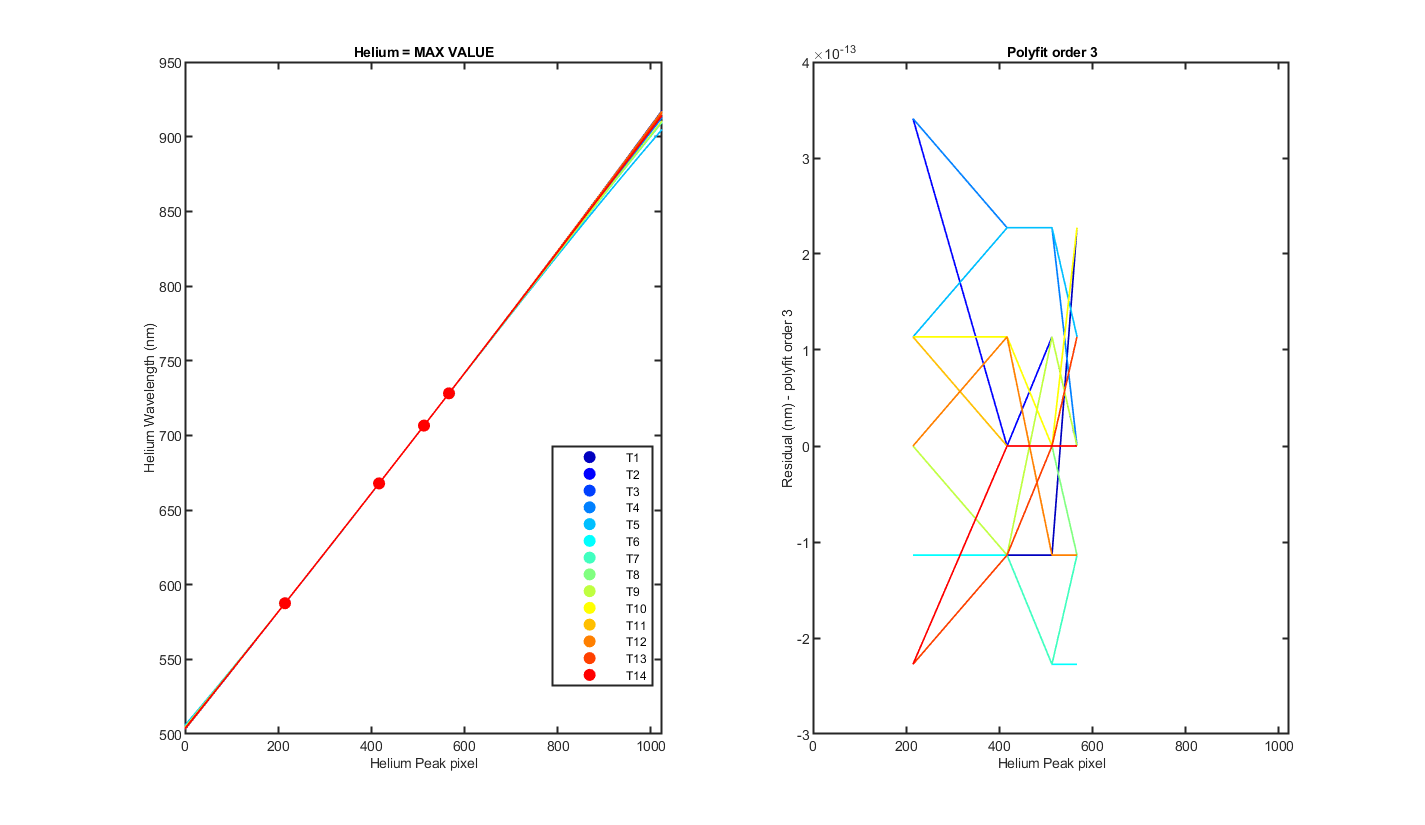
Figure 16 MY VERY ROUGH GUESS AT A WAVELENGTH CAL!!! THIS ASSUMES I GUESS CORRECTLY WHICH PEAKS WHERE WHICH HELIUM LINES. Originally I had ~ 506.51, 921.42, but after Mikes email I drop the peak at 683 and changed from 2nd order to linear. Mikes says "pix #1 = 504.70, pix #1024 = 911.97, with pixel separation = 0.40 nm"
Track, Min,    Max,     diff,    P
    1, 503.42, 917.47,  0.40   0.000000 0.000004
    2, 503.83, 915.56,  0.40   -0.000000 0.000013
    3, 503.93, 915.15,  0.40   -0.000000 0.000015
    4, 504.45, 912.80,  0.40   -0.000000 0.000027
    5, 506.18, 904.82,  0.39   -0.000000 0.000069
    6, 505.01, 910.34,  0.40   -0.000000 0.000040
    7, 505.18, 909.62,  0.40   -0.000000 0.000044
    8, 505.03, 910.24,  0.40   -0.000000 0.000040
    9, 504.96, 910.46,  0.40   -0.000000 0.000039
   10, 504.02, 915.66,  0.40   -0.000000 0.000015
   11, 503.74, 916.77,  0.40   0.000000 0.000009
   12, 503.65, 917.03,  0.40   0.000000 0.000007
   13, 503.82, 915.92,  0.40   0.000000 0.000012
   14, 504.11, 914.20,  0.40   -0.000000 0.000020
  Track = The Resonon Track number
Lwave = Laser Wavelength
Lpix1 = Laser Pixel found using the max value of the track
Lpix2 = Laser Pixel found using mygaussfit to fit the laser peak
| Track | Lwave | Lpix1 | Lpix2 |
|---|---|---|---|
| 1 | 587.56 | 215.00 | 214.72 |
| 1 | 667.82 | 417.00 | 416.64 |
| 1 | 706.52 | 513.00 | 513.09 |
| 1 | 728.13 | 567.00 | 566.64 |
| 2 | 587.56 | 215.00 | 214.64 |
| 2 | 667.82 | 417.00 | 416.61 |
| 2 | 706.52 | 513.00 | 513.07 |
| 2 | 728.13 | 567.00 | 566.68 |
| 3 | 587.56 | 215.00 | 214.61 |
| 3 | 667.82 | 417.00 | 416.61 |
| 3 | 706.52 | 513.00 | 513.08 |
| 3 | 728.13 | 567.00 | 566.71 |
| 4 | 587.56 | 215.00 | 214.60 |
| 4 | 667.82 | 417.00 | 416.61 |
| 4 | 706.52 | 513.00 | 513.05 |
| 4 | 728.13 | 567.00 | 566.72 |
| 5 | 587.56 | 215.00 | 214.71 |
| 5 | 667.82 | 417.00 | 416.75 |
| 5 | 706.52 | 513.00 | 513.08 |
| 5 | 728.13 | 567.00 | 566.89 |
| 6 | 587.56 | 215.00 | 214.56 |
| 6 | 667.82 | 417.00 | 416.60 |
| 6 | 706.52 | 513.00 | 513.02 |
| 6 | 728.13 | 567.00 | 566.74 |
| 7 | 587.56 | 214.00 | 214.51 |
| 7 | 667.82 | 416.00 | 416.56 |
| 7 | 706.52 | 513.00 | 512.97 |
| 7 | 728.13 | 567.00 | 566.71 |
| 8 | 587.56 | 215.00 | 214.56 |
| 8 | 667.82 | 417.00 | 416.60 |
| 8 | 706.52 | 513.00 | 513.02 |
| 8 | 728.13 | 567.00 | 566.75 |
| 9 | 587.56 | 215.00 | 214.60 |
| 9 | 667.82 | 417.00 | 416.63 |
| 9 | 706.52 | 513.00 | 513.06 |
| 9 | 728.13 | 567.00 | 566.78 |
| 10 | 587.56 | 215.00 | 214.59 |
| 10 | 667.82 | 417.00 | 416.63 |
| 10 | 706.52 | 513.00 | 513.06 |
| 10 | 728.13 | 567.00 | 566.64 |
| 11 | 587.56 | 215.00 | 214.57 |
| 11 | 667.82 | 417.00 | 416.60 |
| 11 | 706.52 | 513.00 | 513.06 |
| 11 | 728.13 | 567.00 | 566.63 |
| 12 | 587.56 | 215.00 | 214.59 |
| 12 | 667.82 | 417.00 | 416.61 |
| 12 | 706.52 | 513.00 | 513.08 |
| 12 | 728.13 | 567.00 | 566.64 |
| 13 | 587.56 | 215.00 | 214.60 |
| 13 | 667.82 | 417.00 | 416.59 |
| 13 | 706.52 | 513.00 | 513.05 |
| 13 | 728.13 | 567.00 | 566.65 |
| 14 | 587.56 | 215.00 | 214.65 |
| 14 | 667.82 | 417.00 | 416.60 |
| 14 | 706.52 | 513.00 | 513.03 |
| 14 | 728.13 | 567.00 | 566.66 |