Connections Time Series
These graphs will show connection problems and trys in any linux log file. The idea here is to see when we are having connection issues.
- In the legend the small dots are the successful connections on the first try, for example "Opening connection to upwrj...done."
- The color for the small dots represent which linux log file it was in.
- The X (color again is which linux log file) means the connection failed after X trys (X is usually 20).
- The squares (color again is which linux log file) means there where 20 trys to open the connection and it did not.
- The red down triangle are when the equipment was power cycled to try the connection again.
- The green up traingle is when the connection succeeded after trying repeated times.
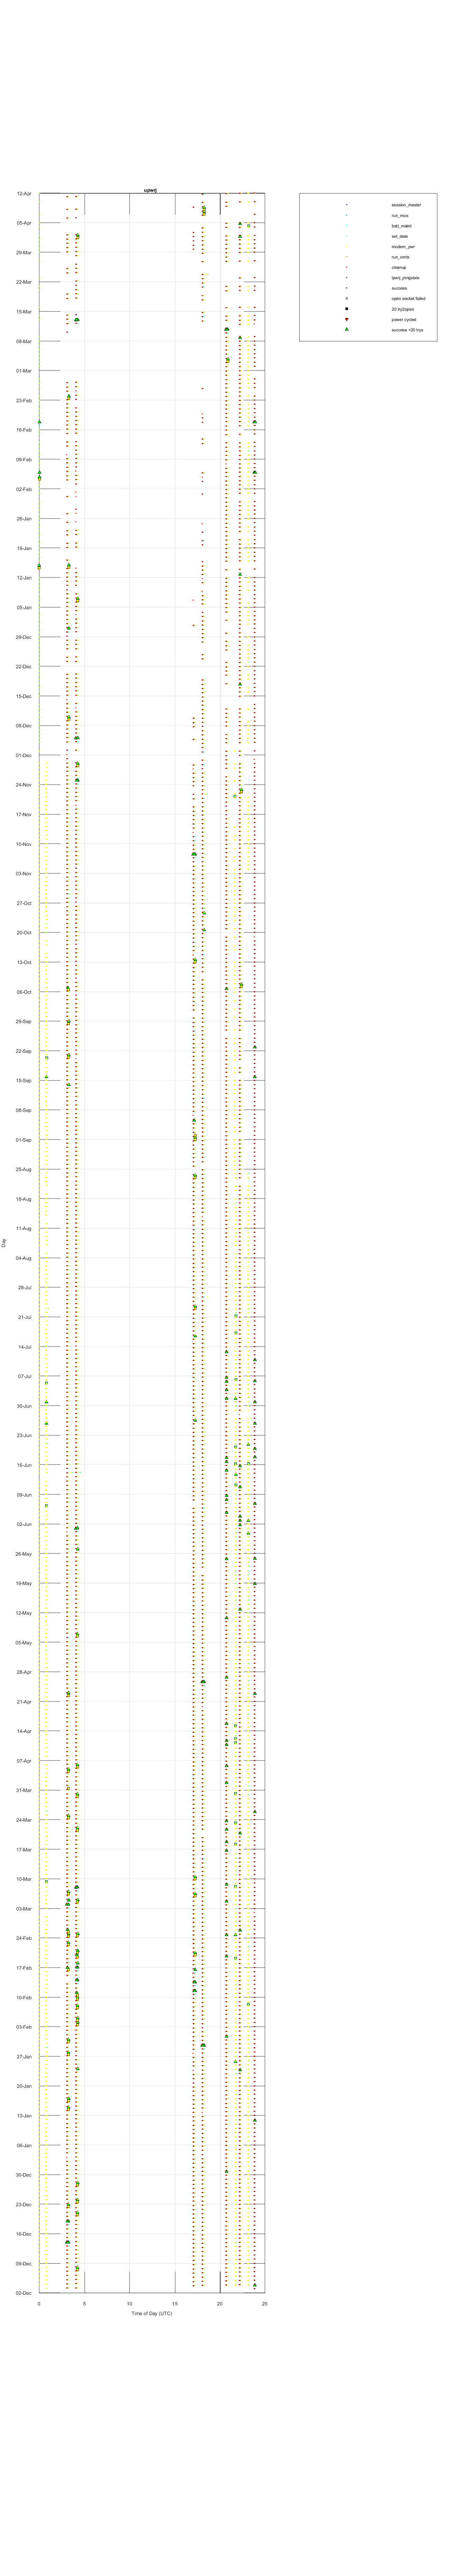
There is a figure for the Lower power junction (lpwrj) and upper power junction (upwrj).
Figure 1
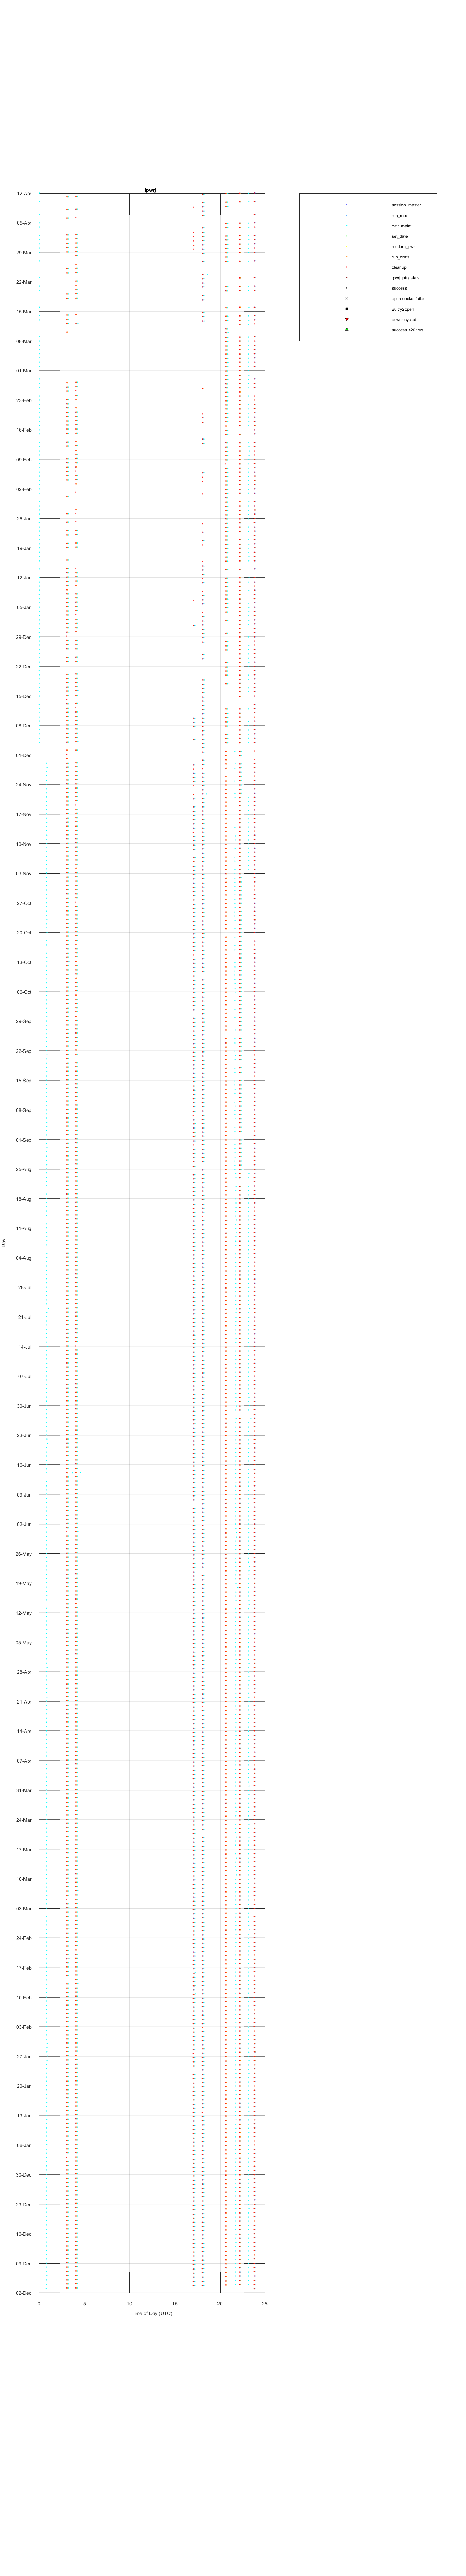 Figure 2
Stephanie Flora - Moss Landing Marine Laboratories