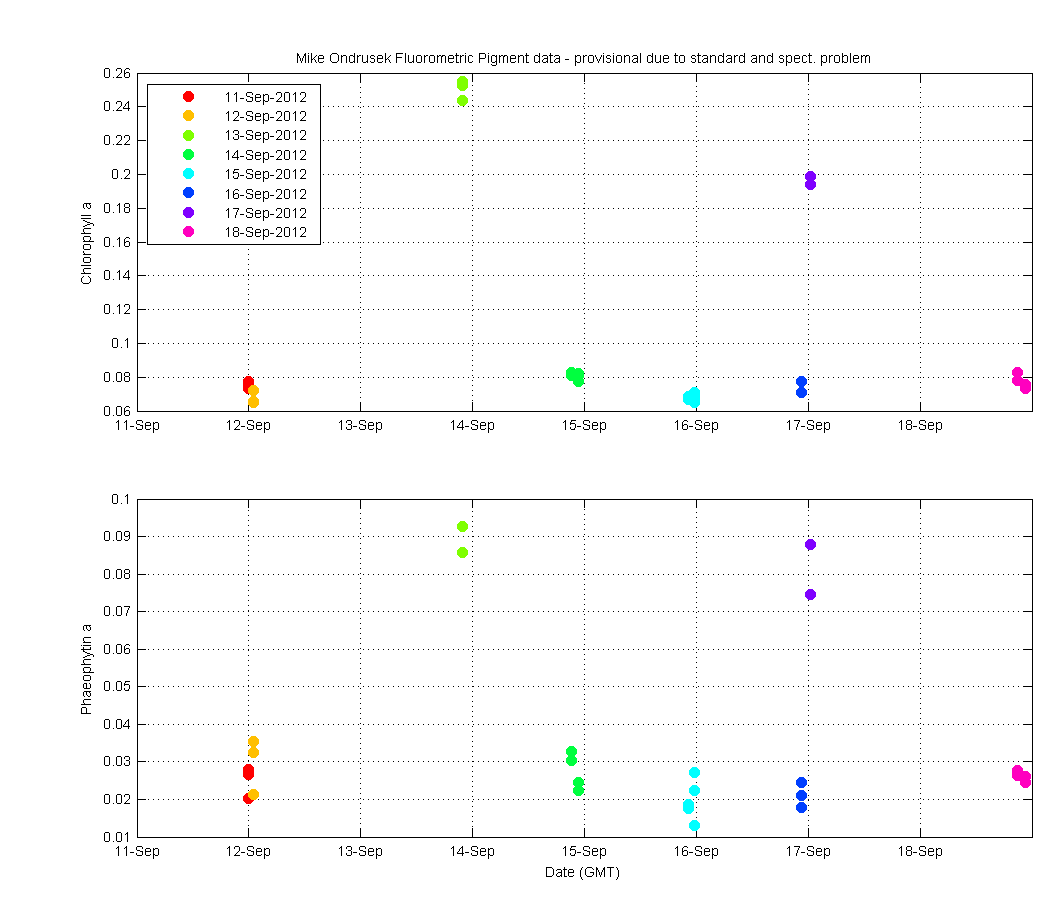
provisional due to standard and spect. problem
| Sample# | Date | Chlorophyll a | Phaeophytin a |
|---|---|---|---|
| 4 | 11-Sep-2012 23:59:00 | 0.0743 | 0.0266 |
| 5 | 11-Sep-2012 23:59:00 | 0.0731 | 0.028 |
| 6 | 11-Sep-2012 23:59:00 | 0.0777 | 0.0203 |
| 7 | 12-Sep-2012 01:00:00 | 0.072 | 0.0354 |
| 8 | 12-Sep-2012 01:00:00 | 0.0655 | 0.0325 |
| 9 | 12-Sep-2012 01:00:00 | 0.065 | 0.0214 |
| 11 | 13-Sep-2012 21:53:00 | 0.2528 | 0.0858 |
| 12 | 13-Sep-2012 21:53:00 | 0.2551 | 0.0926 |
| 13 | 13-Sep-2012 21:53:00 | 0.2438 | 0.0926 |
| 14 | 14-Sep-2012 21:18:00 | 0.0826 | 0.0305 |
| 15 | 14-Sep-2012 21:18:00 | 0.081 | 0.0327 |
| 17 | 14-Sep-2012 22:48:00 | 0.0819 | 0.0246 |
| 18 | 14-Sep-2012 22:48:00 | 0.0772 | 0.0223 |
| 19 | 14-Sep-2012 22:48:00 | 0.081 | 0.0223 |
| 20 | 15-Sep-2012 22:22:00 | 0.0668 | 0.0183 |
| 21 | 15-Sep-2012 22:22:00 | 0.0668 | 0.0187 |
| 22 | 15-Sep-2012 22:22:00 | 0.0684 | 0.0176 |
| 23 | 15-Sep-2012 23:37:00 | 0.0679 | 0.0271 |
| 24 | 15-Sep-2012 23:37:00 | 0.065 | 0.0223 |
| 25 | 15-Sep-2012 23:37:00 | 0.0707 | 0.0131 |
| 26 | 16-Sep-2012 22:29:00 | 0.0707 | 0.021 |
| 27 | 16-Sep-2012 22:29:00 | 0.0777 | 0.0178 |
| 28 | 16-Sep-2012 22:29:00 | 0.0709 | 0.0246 |
| 29 | 17-Sep-2012 00:30:00 | 0.1987 | 0.0745 |
| 30 | 17-Sep-2012 00:30:00 | 0.1941 | 0.088 |
| 33 | 18-Sep-2012 20:49:00 | 0.0826 | 0.0264 |
| 34 | 18-Sep-2012 20:49:00 | 0.0781 | 0.0278 |
| 35 | 18-Sep-2012 22:30:00 | 0.0758 | 0.0262 |
| 36 | 18-Sep-2012 22:30:00 | 0.074 | 0.0244 |
| 37 | 18-Sep-2012 22:30:00 | 0.0734 | 0.0244 |
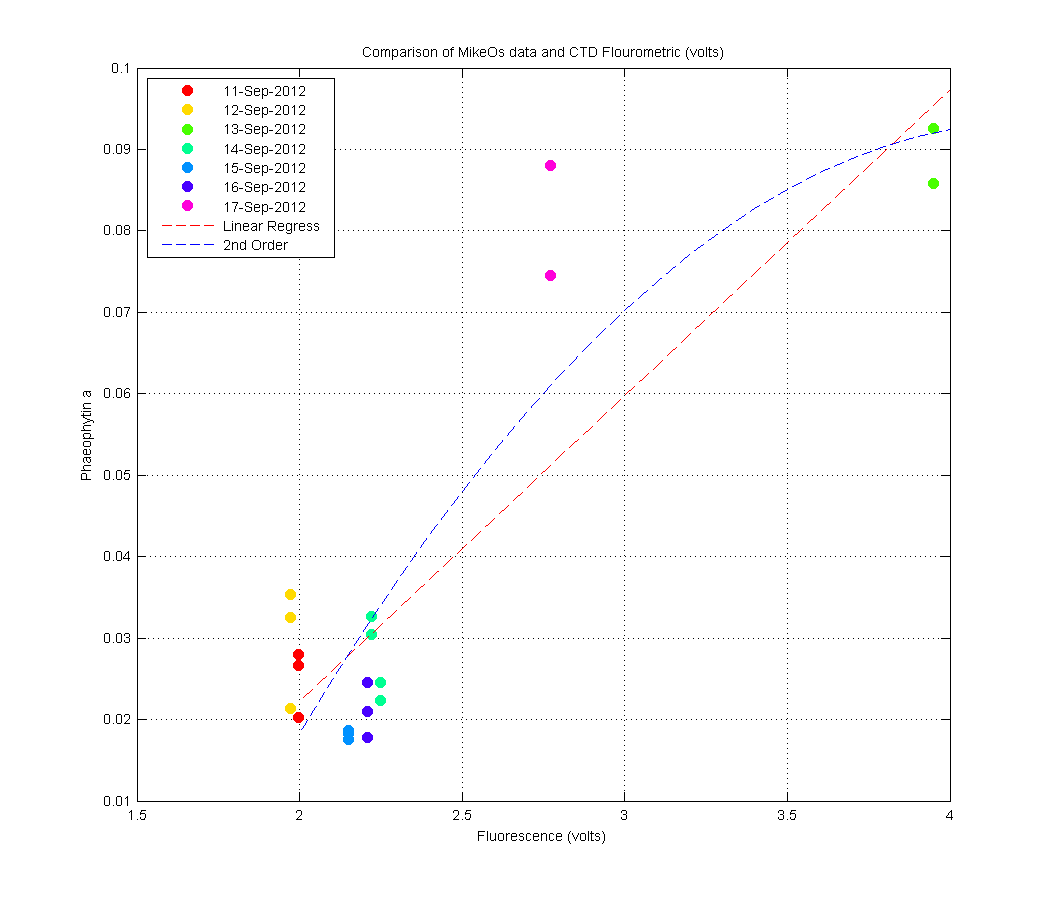
Figure 1
The figures show Cholorphyll data from other Oahu cruises. The data are the Fluorometric data Field and Lab data from the OceanColor pigment database. Mike's data are the equivalent of the Oahu (Lab) data. I threw out all the non-Oahu cruises (since most are no where near oahu) and any data more than 10 nm from where the Oahu-13 (Sep-2012) data was collected. The dates for these data range from 04-Jan-0000 to 04-Jan-0000. But so the data are plotted so you can see if with the Oahu-13 data I scaled the time to plot on the Oahu-13 data. The dates/times are not the dates and times of the data. The other Oahu cruise data is plotted to ONLY give you and idea of the range of other pigments not to say ANYTHING about the variation with time.
Figure 2
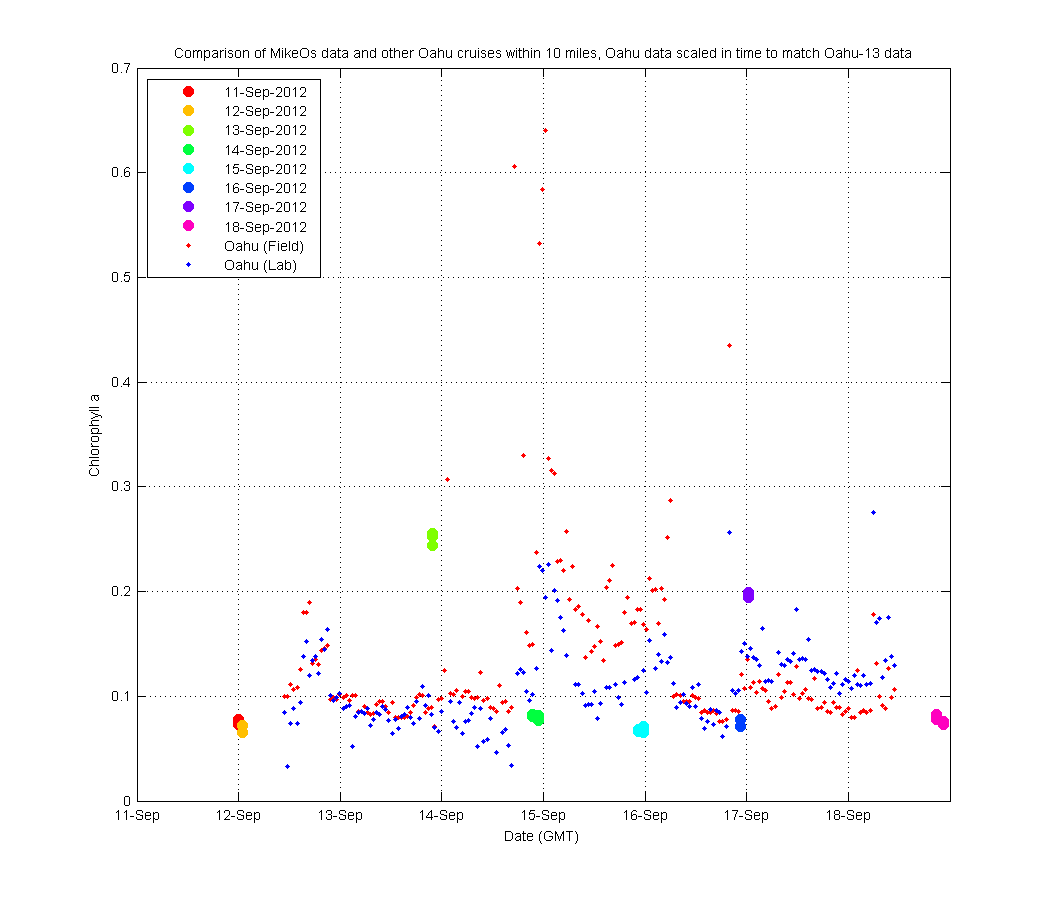
Figure 3
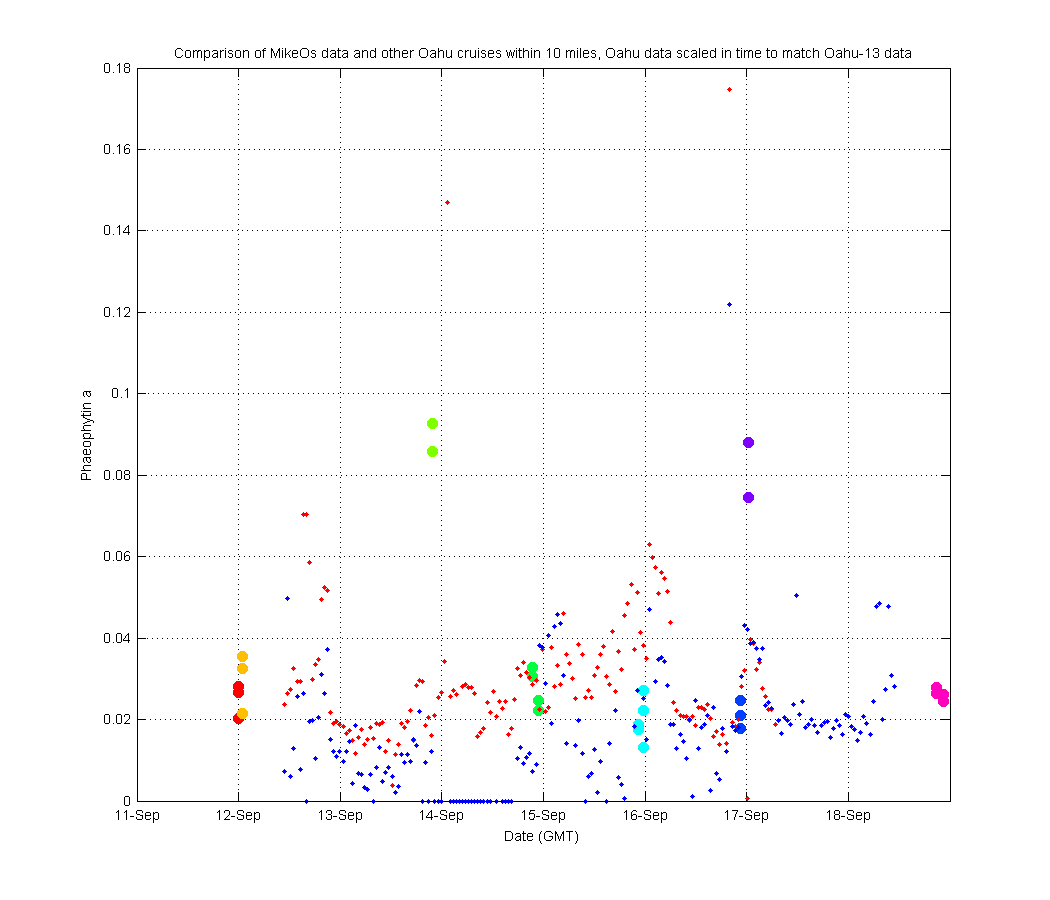
Figure 4
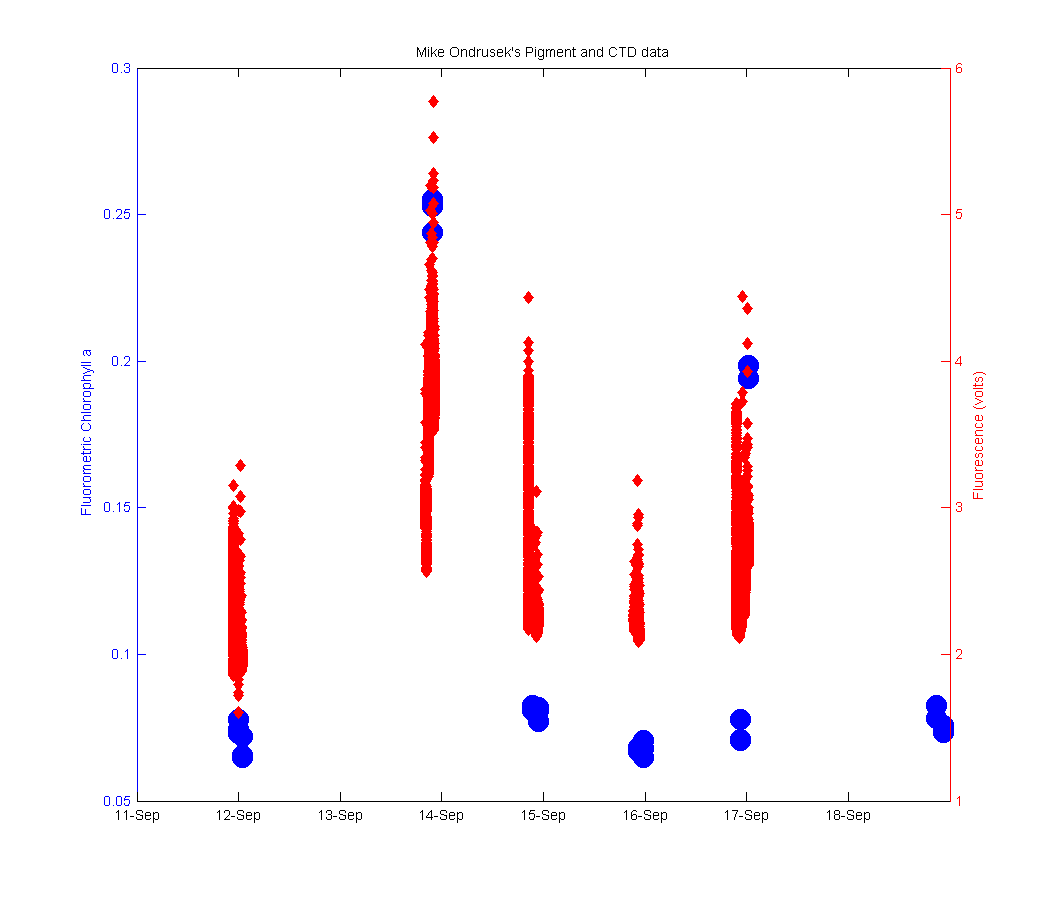
Figure 5
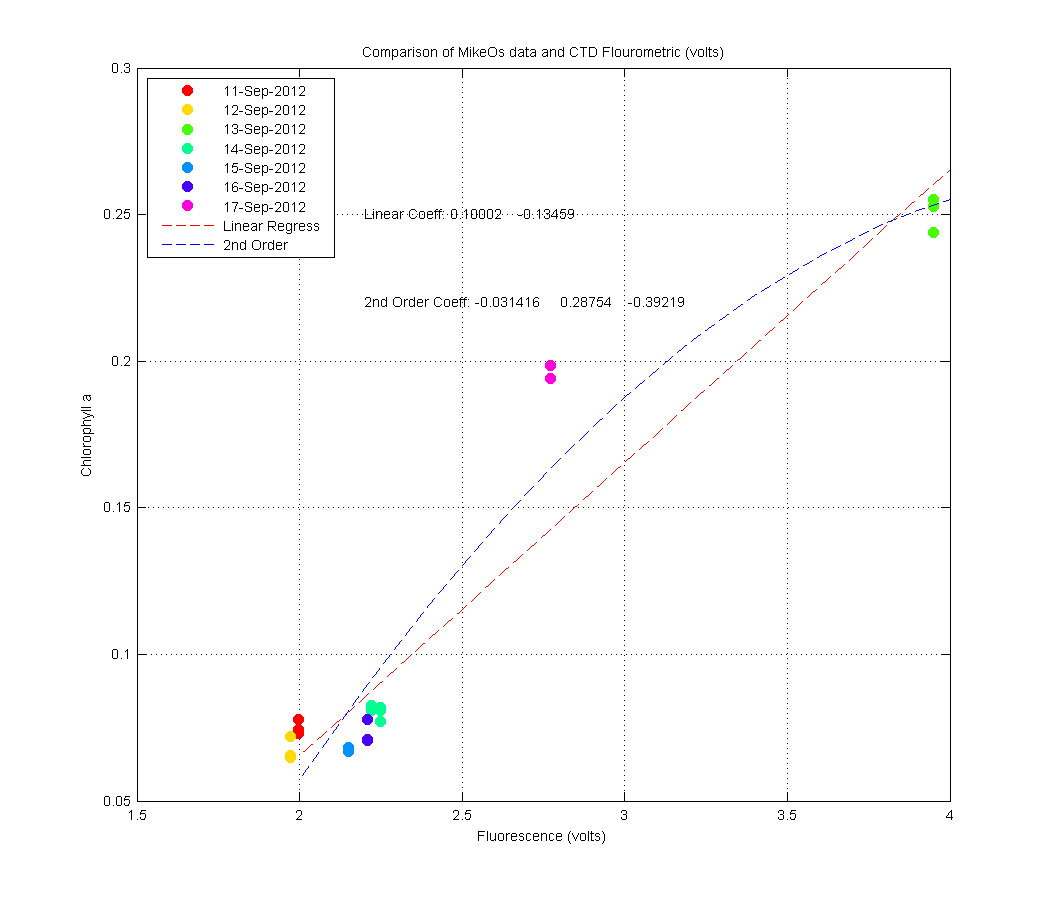
Figure 6