The purpose of this page is to look at the effects of each of the standard processing steps for the Seabird 19 SEACAT. The paragraphs below details the processing steps I used. These are the same steps in the SBEDataProcessing_7.21k.pdf porocessing document page 21.
I am using the newer software:
Seasoft V2: SBE Data Processing CTD Data Processing and Plotting Software for Windows
2000/XP File: SBEDataProcessing_Win32_V7_22_0.exe Downloaded on Sept 2012
Raw data files: HEX files and a con file
DATCNV: Convert raw data to a .cnv file, selecting ASCII as data conversion format.
convert the data, make sure the transmissometer and fluorometer are in volts.
FILTER: Low-pass filter pressure to increase pressure resolution for Loop Edit, and low-pass
filter temperature and conductivity to smooth high frequency data.
Lowpass Filter A = 0.5 sec (Cond and Temp)
Lowpass Filter B = 2 sec (Pressure)
ALIGNCTD: Advance conductivity, temperature, and oxygen relative to pressure, to align parameters in time.
This ensures that calculations of salinity, dissolved oxygen, and other parameters are made using
measurements from same parcel of water.
For a Seabird 19 salinity is 0, temp is 0.5 sec and Oxygen is 3 off pressure
CELL THERMAL MASS: Perform conductivity cell thermal mass correction if
salinity accuracy of better than 0.01 PSU is desired in regions with steep gradients.
alpha = 0.04 and anomaly 1/beta is 8
LOOPEDIT: Mark scans where CTD is moving less than minimum
velocity or traveling backwards due to ship roll.
Loop edit applied only to files which were in profiles.
Min Velocity = 0.1 ms/, exclude scans marked bad.
DERIVED Salinity, Oxygen and Denisty were calculated
ASCII then outputs all the data to an ASCII files.
No wild edit or bin average, I will do these in Matlab if needed
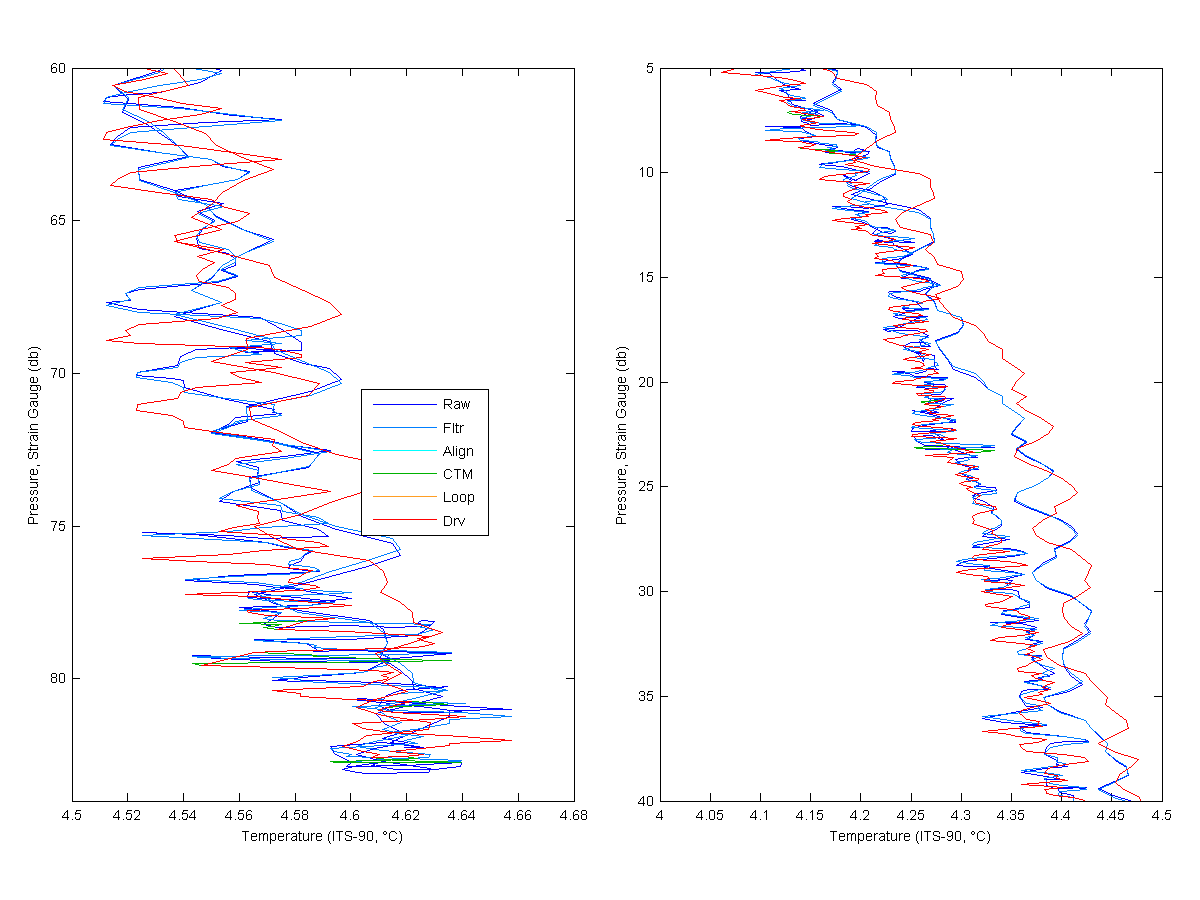
Below I show each processing step for Salinity, Temperatures and Oyxgen. The Raw line would be MikeO's processing and the Derived line would me mine. As you look at the graphs for much of the data you only see the derived, raw or filtered line. This is because the align, cell thermal mass only have large effects were the gradients are larger. You will see the cyan and green lines more near the bottom of the cast and near the top. Loop edit is only see really at the bottom of the cast.
You can see that the filtering has a pretty large effect on the data, cleaning up the noise and smoothing the data. The align effects the Salinity some but the largest effect is on the oxygen. The features in oxygen have been shifted by 3 seconds and is quite noticable. You can see the cell thermal mass correction effect in the salinity at the bottom if the cast. Loop only removed a little bit of data at the end of the cast. Then the new data is derived.
Figure 1
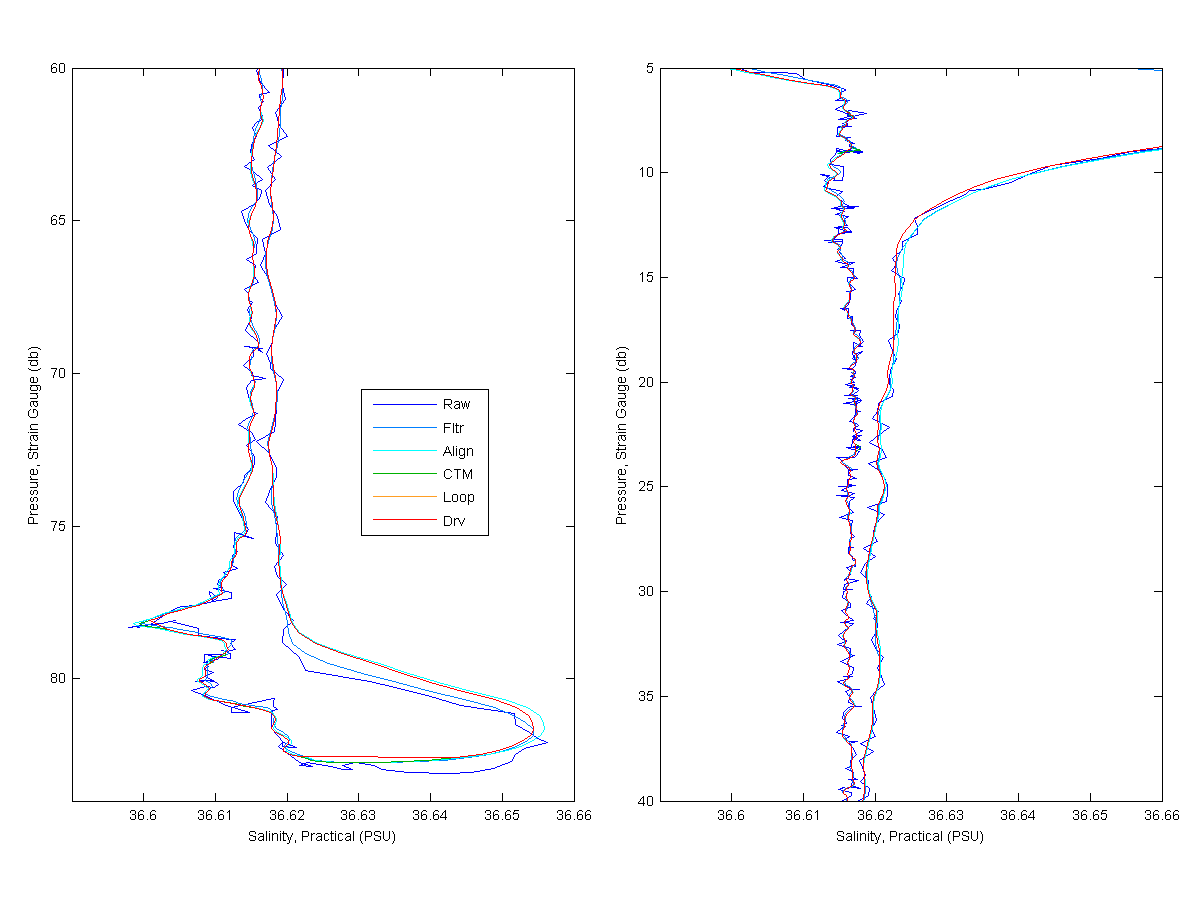
Figure 2
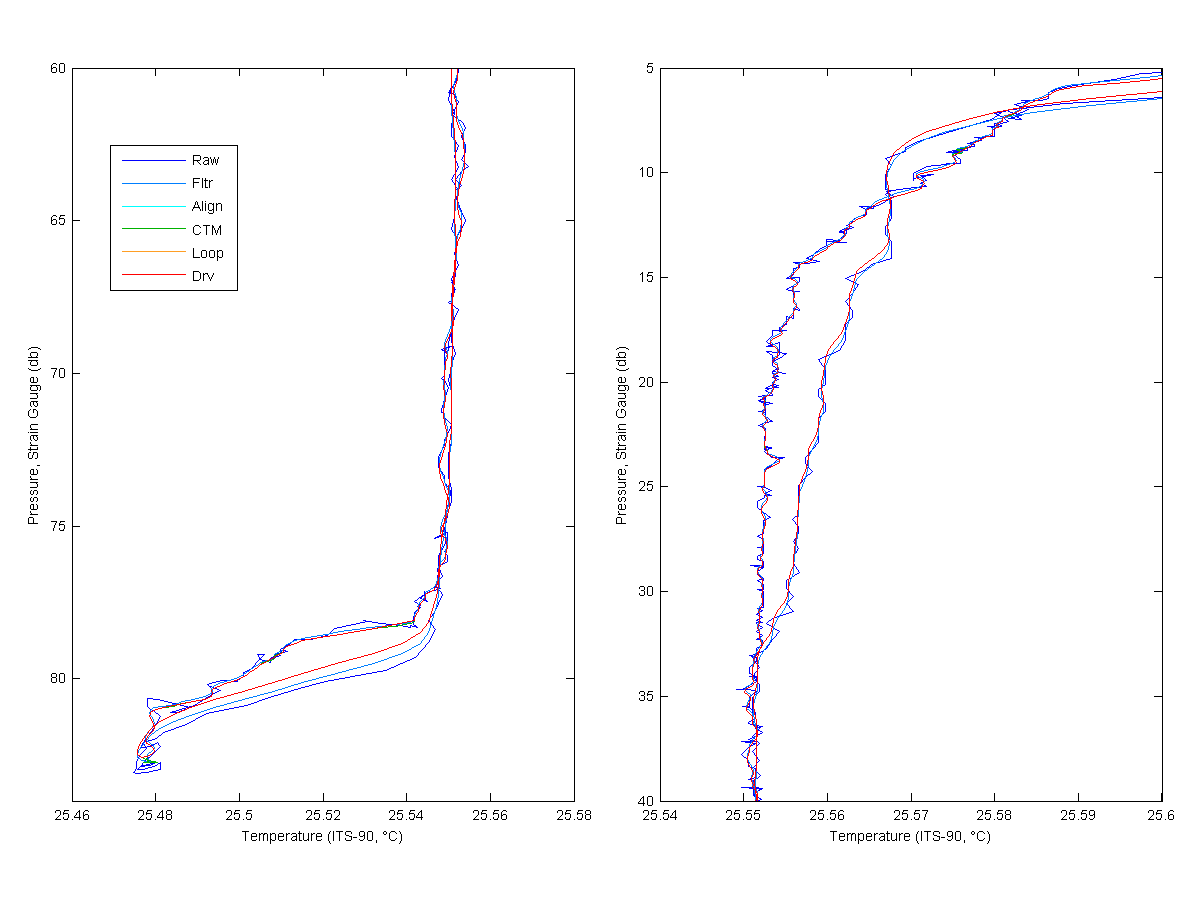
Figure 3