Mark sent a XLS spread sheet which showed a model of the keystoning of the FISH (current and revised) and wanted to compare the modeled to the real data. So I have plotted the modeled data from the XLSX spread sheet first 4 graphs. One worksheet for the revised data and the other of the current system. To look at the keystoning I used a FISH file looking at the OL420 data. The figure 5 shows the data and. figure 6 shows where the track edges are. Figure 7 shows the right and left edges of the tracks subtracted to get the width. Figure 8 shows the right and left edges sutracted from a straight center line. Figure 9 shows the right and left side of the tracks as millimeter from the center. And finally a table below tries to replicate the XLSX spreadsheet.
Carol Keystoning and Smile explaination Document (PDF)
Mike's BSG Keystoning model (XLSX)
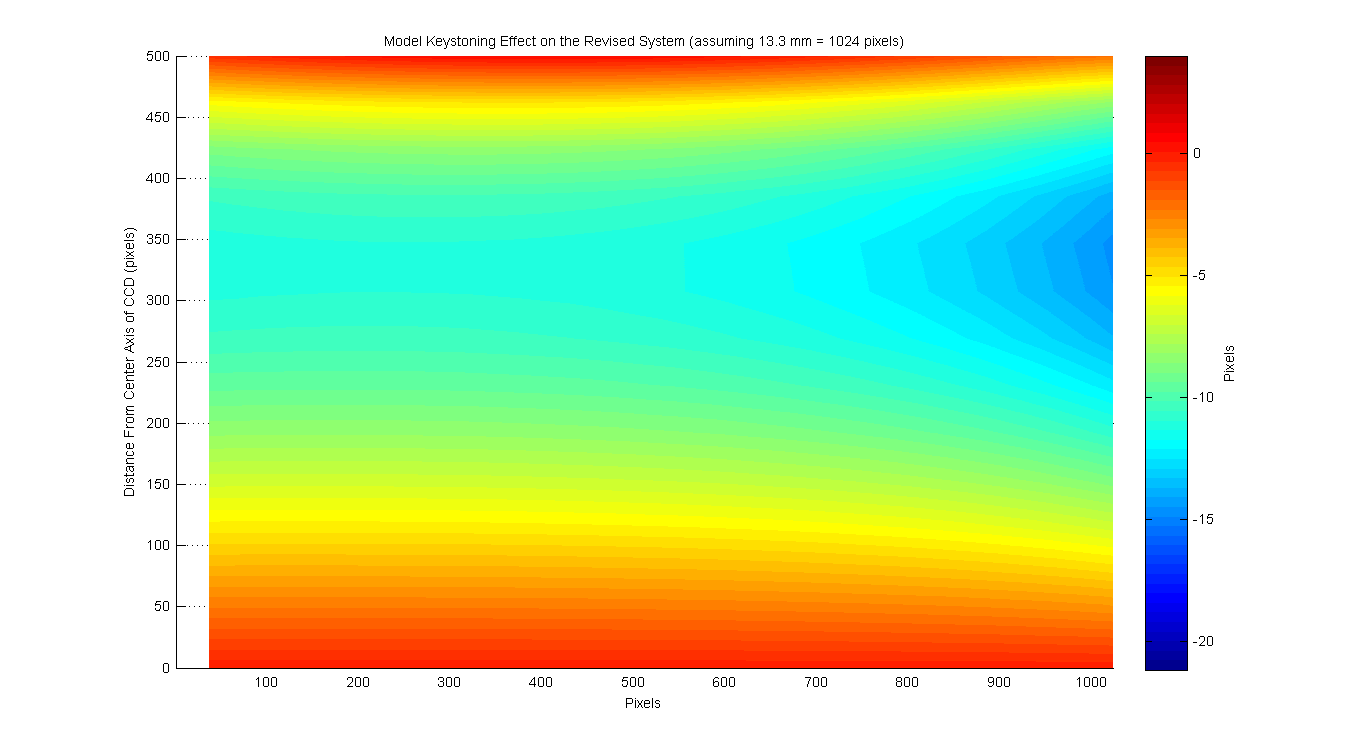
This is the modeled keystoning for the revised system. I have converted the millimeters to pixels assuming that the CCD array is 13.3mm and there are 1024 pixels.
Figure 1
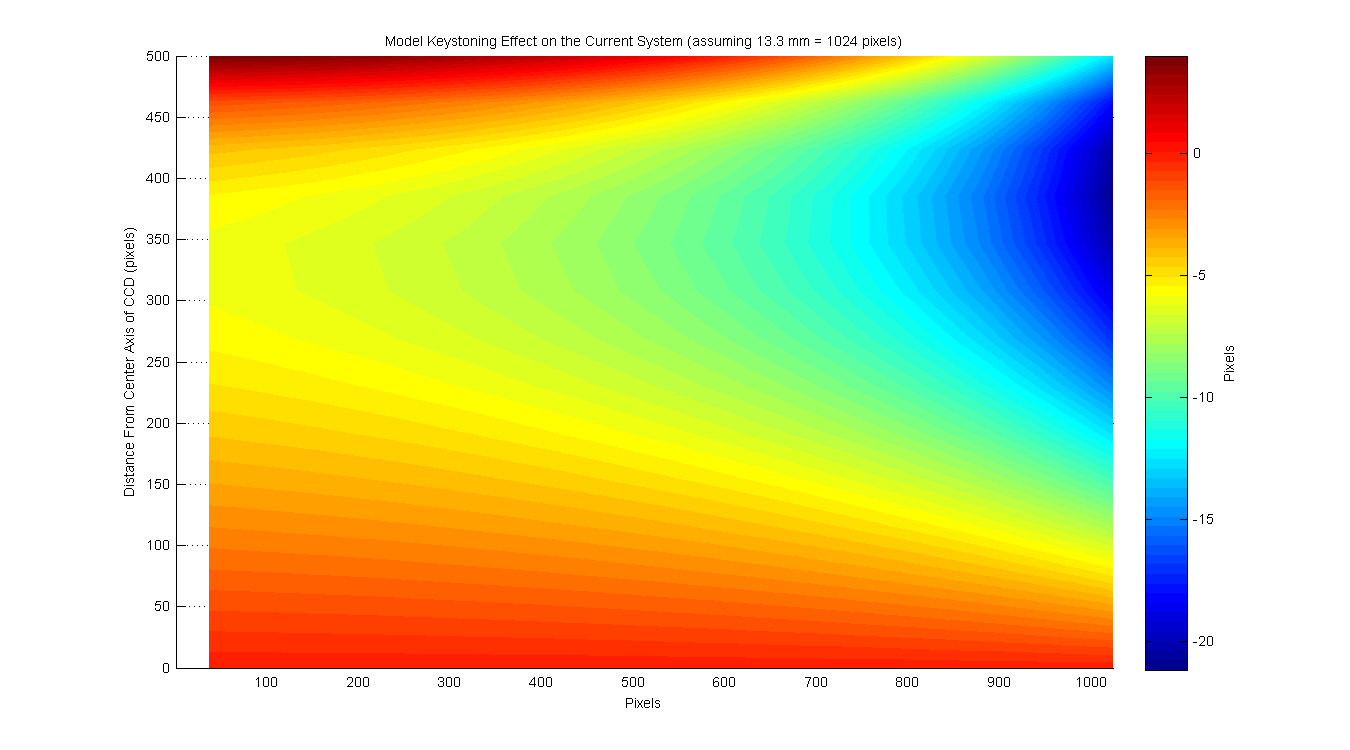
This is the modeled keystoning for the current system. I have converted the millimeters to pixels assuming that the CCD array is 13.3mm and there are 1024 pixels.
Figure 2
THis is the percent difference between the revised and current system
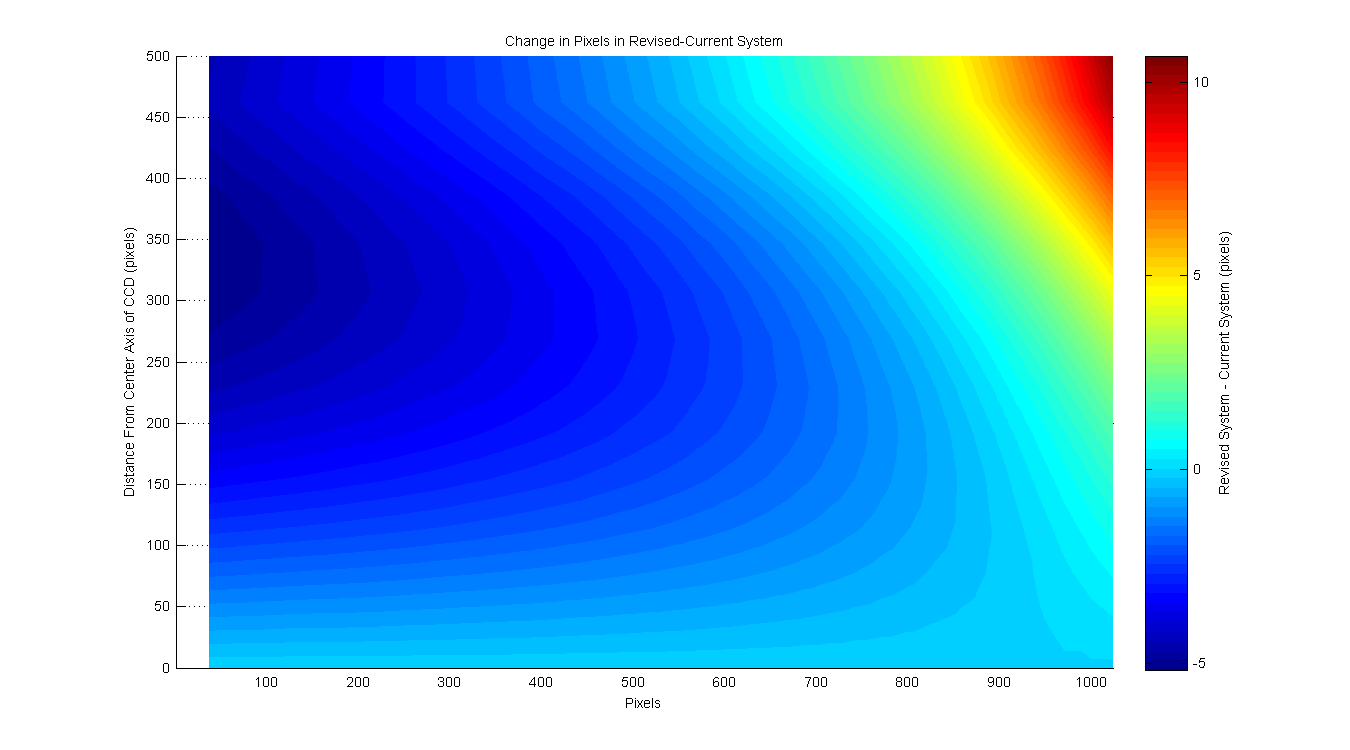
THis is the difference in pixels between the revised and current system
Figure 3
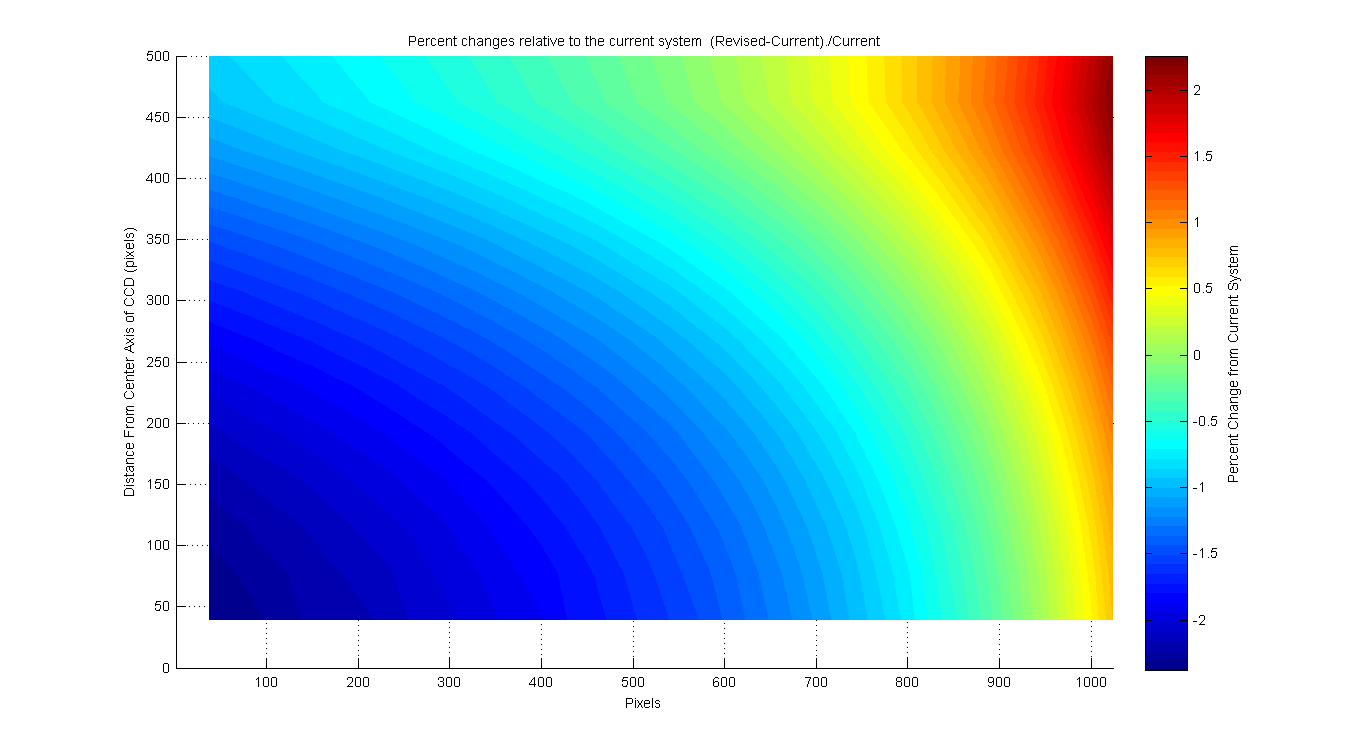
Figure 4
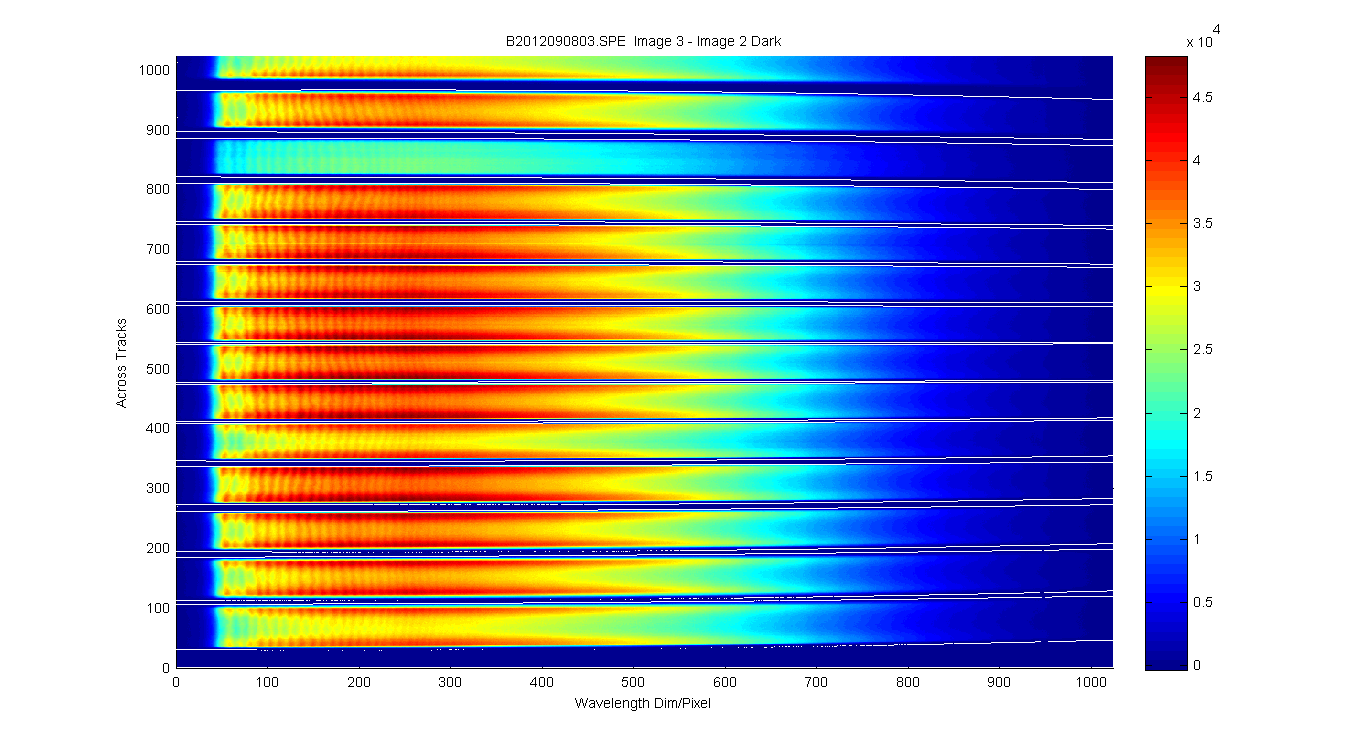
This is the image I am using. It was before the long fibers and water mirrors were attached and shows all the tracks. The white lines are where I decided the edge of the track are. Rather than picking the peaks of the track I picked the place where the track starts down near the darks. I got these positions by clicking by hand through the data to find the edges. I then interpoated the data to fill in the missing pixels. I them plotted the result in the image below to make sure it worked. Looks pretty good.
Figure 5
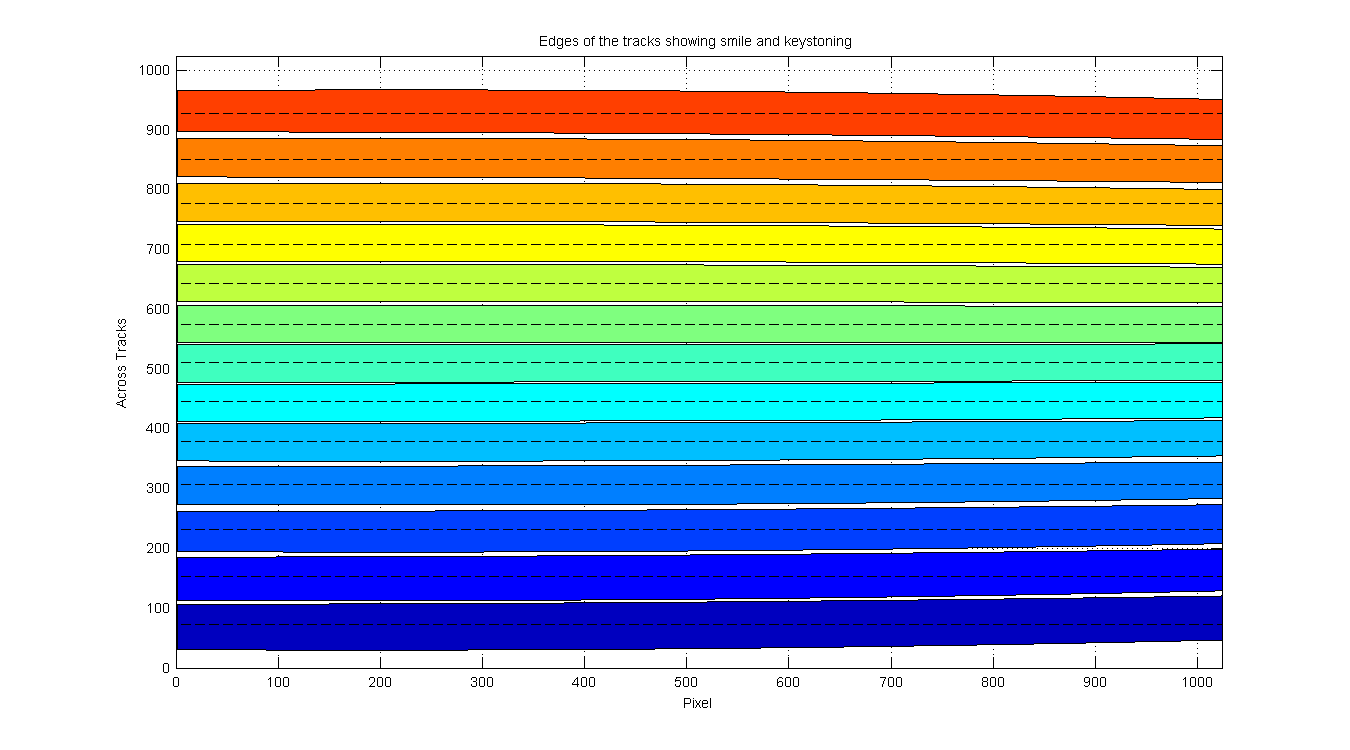
This show the result of the hand selected track edges and interpolation of the data. The Smile seems pretty obvious on this graph. The dashed line down the center is a straight center line which was subtracted from the left and right edges to create Figure 6
Figure 6
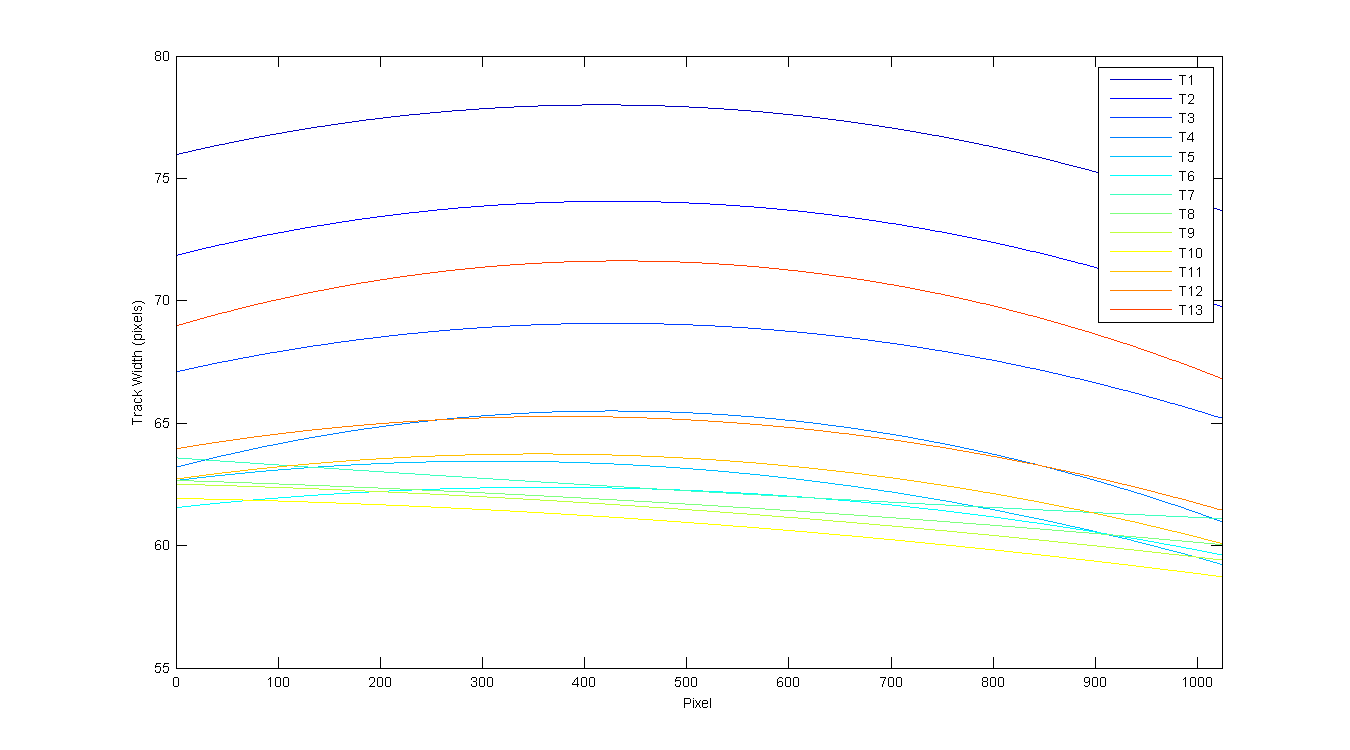
This is the width of the tracks (left side - right). Note that the data from both sides contain keystoning and smile. Not sure how to pull one from the other. Also could some of the track just be wider to start with. The "dark" strip varies quit a bit.
Figure 7
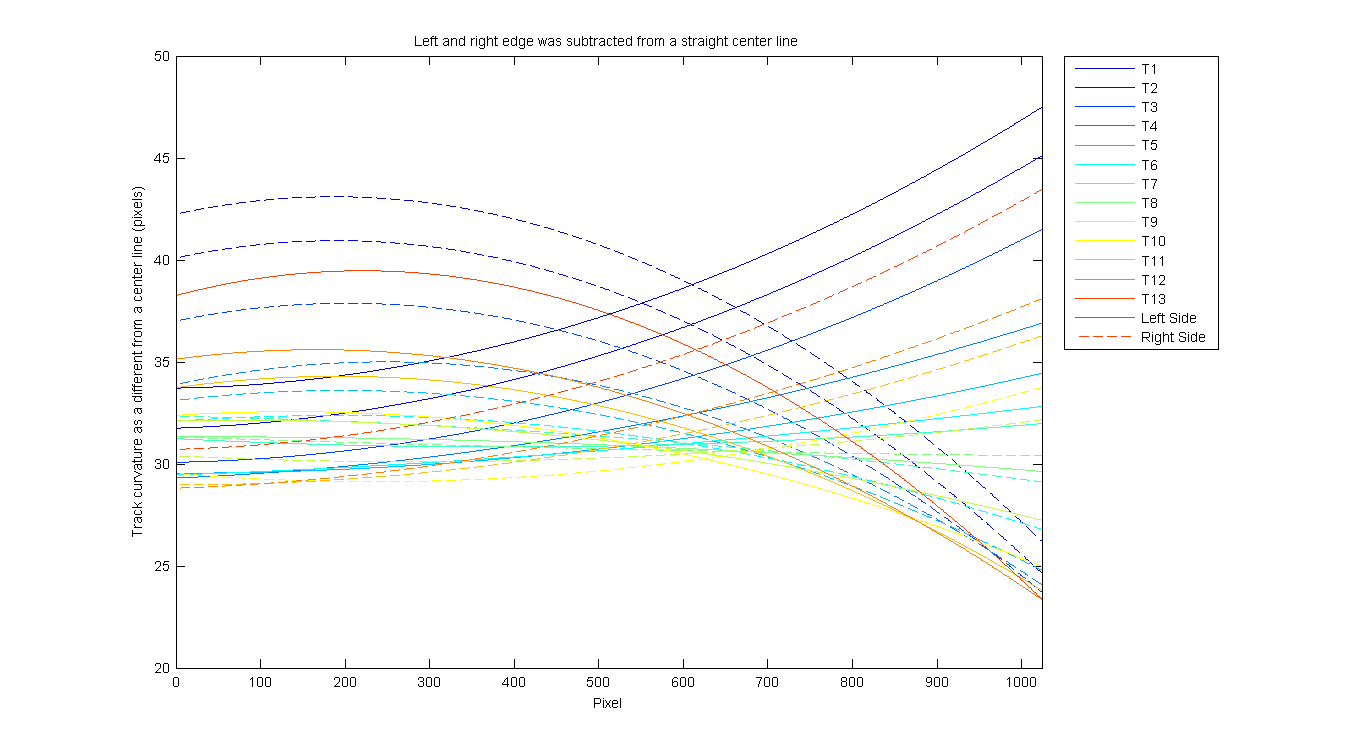
This is the right and left sides subtracted from the straight center line for each track.
Figure 8
This is the right and left sides in millimeters from the center.
Figure 9
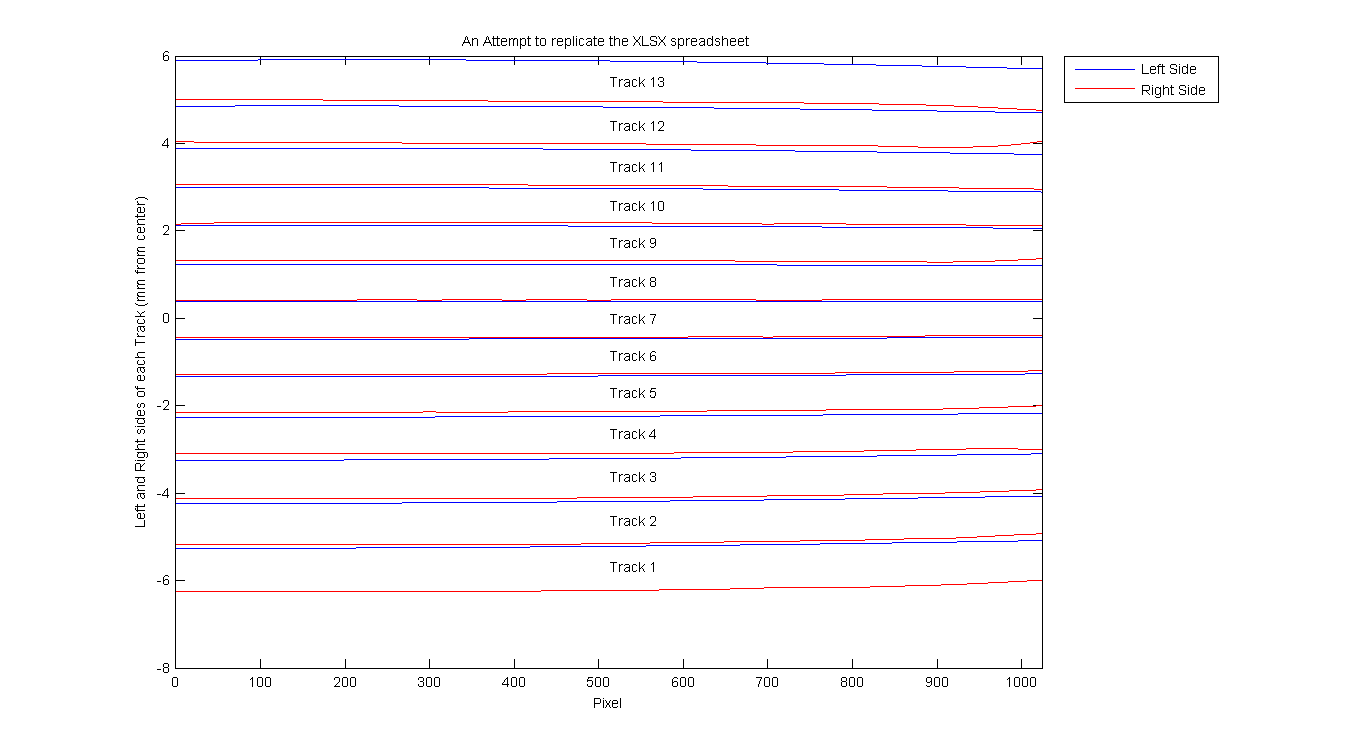
This is the right and left sides in millimeters from the center (graphical version of Figure 9). The wavelength is the closest value to the wavelengths in the XLSX file. The table has the millimeters from the center of array for each track. This will be a little different from the table because I have data on both sides of the center and teh XLSX spreadsheet has it for only one side of the array.
| Millimeters from the center of the array (pixel 512) for the left (top) side of each track | ||||||||||||||
|---|---|---|---|---|---|---|---|---|---|---|---|---|---|---|
| Wavlength (nm) | T1 | T2 | T3 | T4 | T5 | T6 | Center | T7 | T8 | T9 | T10 | T11 | T12 | T13 |
| 372.38 | -5.0852 | -4.0674 | -3.1007 | -2.1734 | -1.2720 | -0.4397 | 0 | 0.3941 | 1.2073 | 2.0579 | 2.8886 | 3.7478 | 4.6990 | 5.7042 |
| 379.93 | -5.0926 | -4.0744 | -3.1068 | -2.1771 | -1.2747 | -0.4412 | 0 | 0.3931 | 1.2083 | 2.0608 | 2.8935 | 3.7549 | 4.7071 | 5.7155 |
| 389.89 | -5.1021 | -4.0834 | -3.1147 | -2.1818 | -1.2781 | -0.4430 | 0 | 0.3918 | 1.2095 | 2.0646 | 2.8996 | 3.7640 | 4.7174 | 5.7299 |
| 399.87 | -5.1114 | -4.0921 | -3.1223 | -2.1865 | -1.2815 | -0.4448 | 0 | 0.3906 | 1.2107 | 2.0682 | 2.9056 | 3.7727 | 4.7274 | 5.7438 |
| 409.87 | -5.1204 | -4.1006 | -3.1297 | -2.1910 | -1.2847 | -0.4466 | 0 | 0.3895 | 1.2119 | 2.0718 | 2.9114 | 3.7811 | 4.7370 | 5.7571 |
| 419.89 | -5.1291 | -4.1088 | -3.1368 | -2.1954 | -1.2879 | -0.4483 | 0 | 0.3884 | 1.2130 | 2.0752 | 2.9169 | 3.7892 | 4.7462 | 5.7699 |
| 429.92 | -5.1375 | -4.1168 | -3.1438 | -2.1997 | -1.2909 | -0.4500 | 0 | 0.3873 | 1.2141 | 2.0785 | 2.9222 | 3.7970 | 4.7550 | 5.7822 |
| 439.98 | -5.1457 | -4.1245 | -3.1505 | -2.2038 | -1.2939 | -0.4517 | 0 | 0.3864 | 1.2151 | 2.0816 | 2.9274 | 3.8044 | 4.7635 | 5.7938 |
| 450.05 | -5.1536 | -4.1320 | -3.1570 | -2.2079 | -1.2967 | -0.4533 | 0 | 0.3855 | 1.2161 | 2.0847 | 2.9323 | 3.8115 | 4.7717 | 5.8050 |
| 460.14 | -5.1612 | -4.1393 | -3.1633 | -2.2118 | -1.2995 | -0.4549 | 0 | 0.3846 | 1.2171 | 2.0876 | 2.9370 | 3.8183 | 4.7794 | 5.8156 |
| 469.90 | -5.1683 | -4.1460 | -3.1691 | -2.2155 | -1.3021 | -0.4564 | 0 | 0.3839 | 1.2180 | 2.0903 | 2.9413 | 3.8245 | 4.7866 | 5.8253 |
| 480.03 | -5.1754 | -4.1528 | -3.1750 | -2.2192 | -1.3046 | -0.4579 | 0 | 0.3832 | 1.2189 | 2.0930 | 2.9456 | 3.8306 | 4.7936 | 5.8348 |
| 490.17 | -5.1822 | -4.1593 | -3.1806 | -2.2227 | -1.3071 | -0.4594 | 0 | 0.3825 | 1.2197 | 2.0956 | 2.9497 | 3.8364 | 4.8003 | 5.8438 |
| 499.99 | -5.1886 | -4.1654 | -3.1858 | -2.2261 | -1.3093 | -0.4608 | 0 | 0.3819 | 1.2205 | 2.0979 | 2.9534 | 3.8417 | 4.8064 | 5.8520 |
| 510.17 | -5.1948 | -4.1714 | -3.1910 | -2.2294 | -1.3116 | -0.4622 | 0 | 0.3814 | 1.2213 | 2.1002 | 2.9571 | 3.8468 | 4.8124 | 5.8599 |
| 520.02 | -5.2006 | -4.1770 | -3.1958 | -2.2325 | -1.3137 | -0.4635 | 0 | 0.3809 | 1.2220 | 2.1024 | 2.9605 | 3.8514 | 4.8178 | 5.8670 |
| 529.88 | -5.2062 | -4.1823 | -3.2004 | -2.2355 | -1.3156 | -0.4648 | 0 | 0.3805 | 1.2227 | 2.1044 | 2.9636 | 3.8558 | 4.8229 | 5.8736 |
| 540.12 | -5.2117 | -4.1876 | -3.2049 | -2.2384 | -1.3176 | -0.4661 | 0 | 0.3801 | 1.2234 | 2.1064 | 2.9666 | 3.8599 | 4.8278 | 5.8800 |
| 550.02 | -5.2167 | -4.1925 | -3.2091 | -2.2412 | -1.3194 | -0.4673 | 0 | 0.3798 | 1.2240 | 2.1082 | 2.9694 | 3.8636 | 4.8321 | 5.8855 |
| 559.94 | -5.2215 | -4.1971 | -3.2131 | -2.2439 | -1.3211 | -0.4685 | 0 | 0.3796 | 1.2246 | 2.1099 | 2.9719 | 3.8670 | 4.8362 | 5.8906 |
| 569.87 | -5.2260 | -4.2015 | -3.2168 | -2.2464 | -1.3227 | -0.4696 | 0 | 0.3794 | 1.2252 | 2.1114 | 2.9743 | 3.8701 | 4.8399 | 5.8952 |
| 580.18 | -5.2305 | -4.2059 | -3.2205 | -2.2489 | -1.3243 | -0.4708 | 0 | 0.3793 | 1.2257 | 2.1129 | 2.9765 | 3.8730 | 4.8434 | 5.8994 |
| 590.15 | -5.2345 | -4.2098 | -3.2239 | -2.2512 | -1.3257 | -0.4719 | 0 | 0.3792 | 1.2262 | 2.1143 | 2.9785 | 3.8755 | 4.8464 | 5.9029 |
| 600.13 | -5.2382 | -4.2135 | -3.2270 | -2.2534 | -1.3270 | -0.4729 | 0 | 0.3792 | 1.2267 | 2.1155 | 2.9802 | 3.8776 | 4.8490 | 5.9059 |
| 610.14 | -5.2417 | -4.2170 | -3.2299 | -2.2555 | -1.3282 | -0.4739 | 0 | 0.3793 | 1.2271 | 2.1166 | 2.9818 | 3.8795 | 4.8514 | 5.9084 |
| 620.16 | -5.2450 | -4.2203 | -3.2326 | -2.2575 | -1.3294 | -0.4749 | 0 | 0.3794 | 1.2275 | 2.1176 | 2.9832 | 3.8810 | 4.8534 | 5.9104 |
| 629.84 | -5.2479 | -4.2232 | -3.2351 | -2.2593 | -1.3304 | -0.4758 | 0 | 0.3795 | 1.2278 | 2.1185 | 2.9843 | 3.8822 | 4.8550 | 5.9119 |
| 639.89 | -5.2506 | -4.2260 | -3.2374 | -2.2610 | -1.3313 | -0.4767 | 0 | 0.3797 | 1.2281 | 2.1193 | 2.9853 | 3.8831 | 4.8563 | 5.9129 |
| 649.96 | -5.2531 | -4.2285 | -3.2395 | -2.2627 | -1.3322 | -0.4775 | 0 | 0.3800 | 1.2284 | 2.1199 | 2.9861 | 3.8838 | 4.8573 | 5.9134 |
| 660.05 | -5.2554 | -4.2309 | -3.2414 | -2.2642 | -1.3329 | -0.4784 | 0 | 0.3803 | 1.2286 | 2.1205 | 2.9867 | 3.8841 | 4.8579 | 5.9134 |
| 670.16 | -5.2574 | -4.2330 | -3.2431 | -2.2656 | -1.3336 | -0.4792 | 0 | 0.3807 | 1.2289 | 2.1209 | 2.9871 | 3.8841 | 4.8582 | 5.9128 |
| 679.92 | -5.2590 | -4.2348 | -3.2445 | -2.2669 | -1.3342 | -0.4799 | 0 | 0.3811 | 1.2290 | 2.1213 | 2.9873 | 3.8838 | 4.8582 | 5.9119 |
| 690.06 | -5.2605 | -4.2364 | -3.2458 | -2.2681 | -1.3346 | -0.4806 | 0 | 0.3816 | 1.2292 | 2.1215 | 2.9873 | 3.8832 | 4.8578 | 5.9103 |
| 699.85 | -5.2617 | -4.2378 | -3.2468 | -2.2691 | -1.3350 | -0.4813 | 0 | 0.3822 | 1.2293 | 2.1216 | 2.9871 | 3.8823 | 4.8572 | 5.9084 |
| 710.02 | -5.2627 | -4.2390 | -3.2477 | -2.2701 | -1.3353 | -0.4819 | 0 | 0.3828 | 1.2293 | 2.1216 | 2.9867 | 3.8811 | 4.8561 | 5.9059 |
| 719.85 | -5.2635 | -4.2399 | -3.2484 | -2.2709 | -1.3355 | -0.4825 | 0 | 0.3834 | 1.2294 | 2.1215 | 2.9862 | 3.8797 | 4.8548 | 5.9030 |
| Min | -5.2641 | -4.2409 | -3.2490 | -2.2720 | -1.3357 | -0.4834 | 0.3792 | 0 | 1.2073 | 2.0579 | 2.8886 | 3.7478 | 4.6990 | 5.7042 |
| Max | -5.0852 | -4.0674 | -3.1007 | -2.1734 | -1.2720 | -0.4397 | 0.3941 | 0 | 1.2294 | 2.1216 | 2.9873 | 3.8841 | 4.8582 | 5.9134 |
| peak-to-peak keystone (mm) | 0.1789 | 0.1735 | 0.1483 | 0.0986 | 0.0637 | 0.0436 | 0.0149 | 0 | 0.0221 | 0.0637 | 0.0987 | 0.1364 | 0.1592 | 0.2092 |
| Millimeters from the center of the array (pixel 512) for the right (bottom) side of each track | ||||||||||||||
|---|---|---|---|---|---|---|---|---|---|---|---|---|---|---|
| Wavlength (nm) | T1 | T2 | T3 | T4 | T5 | T6 | T7 | Center | T8 | T9 | T10 | T11 | T12 | T13 |
| 372.38 | -5.9911 | -4.9304 | -3.9239 | -3.0037 | -2.0016 | -1.2017 | -0.4026 | 0 | 0.4286 | 1.3657 | 2.1109 | 2.9551 | 4.0485 | 4.7572 |
| 379.93 | -6.0141 | -4.9467 | -3.9384 | -2.9924 | -2.0161 | -1.2074 | -0.4026 | 0 | 0.4286 | 1.3399 | 2.1166 | 2.9608 | 3.9916 | 4.7802 |
| 389.89 | -6.0436 | -4.9758 | -3.9588 | -2.9864 | -2.0365 | -1.2149 | -0.4026 | 0 | 0.4286 | 1.3135 | 2.1241 | 2.9683 | 3.9435 | 4.8098 |
| 399.87 | -6.0709 | -5.0066 | -3.9782 | -2.9882 | -2.0560 | -1.2225 | -0.4026 | 0 | 0.4286 | 1.2959 | 2.1316 | 2.9759 | 3.9189 | 4.8370 |
| 409.87 | -6.0944 | -5.0314 | -3.9943 | -2.9954 | -2.0720 | -1.2300 | -0.4026 | 0 | 0.4286 | 1.2870 | 2.1392 | 2.9834 | 3.9102 | 4.8605 |
| 419.89 | -6.1125 | -5.0438 | -4.0044 | -3.0068 | -2.0831 | -1.2383 | -0.4051 | 0 | 0.4286 | 1.2883 | 2.1474 | 2.9909 | 3.9135 | 4.8791 |
| 429.92 | -6.1269 | -5.0503 | -4.0112 | -3.0234 | -2.0907 | -1.2464 | -0.4149 | 0 | 0.4286 | 1.2981 | 2.1556 | 2.9985 | 3.9323 | 4.8939 |
| 439.98 | -6.1428 | -5.0636 | -4.0246 | -3.0326 | -2.0911 | -1.2469 | -0.4156 | 0 | 0.4286 | 1.2988 | 2.1561 | 3.0074 | 3.9418 | 4.9029 |
| 450.05 | -6.1568 | -5.0788 | -4.0397 | -3.0395 | -2.0911 | -1.2469 | -0.4156 | 0 | 0.4286 | 1.2988 | 2.1561 | 3.0133 | 3.9487 | 4.9098 |
| 460.14 | -6.1665 | -5.0866 | -4.0476 | -3.0471 | -2.0977 | -1.2553 | -0.4156 | 0 | 0.4202 | 1.2988 | 2.1645 | 3.0133 | 3.9581 | 4.9174 |
| 469.90 | -6.1694 | -5.0935 | -4.0544 | -3.0546 | -2.1065 | -1.2599 | -0.4165 | 0 | 0.4156 | 1.2988 | 2.1682 | 3.0133 | 3.9614 | 4.9249 |
| 480.03 | -6.1694 | -5.1010 | -4.0620 | -3.0637 | -2.1156 | -1.2599 | -0.4264 | 0 | 0.4156 | 1.2988 | 2.1582 | 3.0133 | 3.9614 | 4.9340 |
| 490.17 | -6.1745 | -5.1086 | -4.0695 | -3.0652 | -2.1171 | -1.2599 | -0.4255 | 0 | 0.4188 | 1.3020 | 2.1592 | 3.0164 | 3.9646 | 4.9355 |
| 499.99 | -6.1928 | -5.1158 | -4.0768 | -3.0652 | -2.1171 | -1.2599 | -0.4161 | 0 | 0.4281 | 1.3113 | 2.1685 | 3.0258 | 3.9739 | 4.9355 |
| 510.17 | -6.2020 | -5.1234 | -4.0843 | -3.0695 | -2.1213 | -1.2656 | -0.4213 | 0 | 0.4286 | 1.3118 | 2.1690 | 3.0263 | 3.9744 | 4.9355 |
| 520.02 | -6.2087 | -5.1306 | -4.0916 | -3.0785 | -2.1303 | -1.2729 | -0.4286 | 0 | 0.4286 | 1.3118 | 2.1691 | 3.0263 | 3.9744 | 4.9356 |
| 529.88 | -6.2159 | -5.1379 | -4.1007 | -3.0876 | -2.1394 | -1.2729 | -0.4286 | 0 | 0.4286 | 1.3118 | 2.1771 | 3.0343 | 3.9825 | 4.9516 |
| 540.12 | -6.2237 | -5.1454 | -4.1043 | -3.0912 | -2.1431 | -1.2729 | -0.4286 | 0 | 0.4277 | 1.3118 | 2.1820 | 3.0393 | 3.9874 | 4.9606 |
| 550.02 | -6.2326 | -5.1527 | -4.1043 | -3.0912 | -2.1431 | -1.2729 | -0.4286 | 0 | 0.4181 | 1.3118 | 2.1820 | 3.0393 | 3.9874 | 4.9510 |
| 559.94 | -6.2344 | -5.1607 | -4.1068 | -3.0912 | -2.1431 | -1.2729 | -0.4286 | 0 | 0.4181 | 1.3118 | 2.1820 | 3.0393 | 3.9874 | 4.9510 |
| 569.87 | -6.2344 | -5.1687 | -4.1164 | -3.0912 | -2.1431 | -1.2729 | -0.4286 | 0 | 0.4277 | 1.3118 | 2.1820 | 3.0393 | 3.9874 | 4.9606 |
| 580.18 | -6.2393 | -5.1693 | -4.1173 | -3.0962 | -2.1431 | -1.2778 | -0.4286 | 0 | 0.4237 | 1.3118 | 2.1820 | 3.0442 | 3.9924 | 4.9615 |
| 590.15 | -6.2473 | -5.1693 | -4.1173 | -3.1042 | -2.1431 | -1.2858 | -0.4286 | 0 | 0.4156 | 1.3118 | 2.1820 | 3.0522 | 4.0004 | 4.9615 |
| 600.13 | -6.2474 | -5.1766 | -4.1173 | -3.1042 | -2.1503 | -1.2858 | -0.4286 | 0 | 0.4229 | 1.3118 | 2.1820 | 3.0522 | 4.0004 | 4.9688 |
| 610.14 | -6.2477 | -5.1823 | -4.1176 | -3.1042 | -2.1557 | -1.2858 | -0.4290 | 0 | 0.4282 | 1.3118 | 2.1820 | 3.0522 | 4.0004 | 4.9745 |
| 620.16 | -6.2569 | -5.1823 | -4.1268 | -3.1042 | -2.1465 | -1.2858 | -0.4381 | 0 | 0.4191 | 1.3118 | 2.1820 | 3.0522 | 4.0004 | 4.9745 |
| 629.84 | -6.2604 | -5.1823 | -4.1303 | -3.1042 | -2.1444 | -1.2858 | -0.4403 | 0 | 0.4170 | 1.3118 | 2.1820 | 3.0522 | 4.0017 | 4.9759 |
| 639.89 | -6.2604 | -5.1823 | -4.1303 | -3.1042 | -2.1542 | -1.2858 | -0.4305 | 0 | 0.4267 | 1.3118 | 2.1820 | 3.0522 | 4.0115 | 4.9856 |
| 649.96 | -6.2604 | -5.1823 | -4.1303 | -3.1042 | -2.1561 | -1.2858 | -0.4318 | 0 | 0.4255 | 1.3118 | 2.1820 | 3.0522 | 4.0134 | 4.9875 |
| 660.05 | -6.2604 | -5.1823 | -4.1303 | -3.1042 | -2.1561 | -1.2858 | -0.4411 | 0 | 0.4161 | 1.3118 | 2.1820 | 3.0522 | 4.0134 | 4.9875 |
| 670.16 | -6.2604 | -5.1823 | -4.1303 | -3.1042 | -2.1561 | -1.2858 | -0.4416 | 0 | 0.4156 | 1.3118 | 2.1874 | 3.0576 | 4.0134 | 4.9919 |
| 679.92 | -6.2604 | -5.1823 | -4.1303 | -3.1042 | -2.1561 | -1.2858 | -0.4416 | 0 | 0.4156 | 1.3118 | 2.1950 | 3.0652 | 4.0134 | 5.0003 |
| 690.06 | -6.2604 | -5.1823 | -4.1303 | -3.1042 | -2.1561 | -1.2858 | -0.4416 | 0 | 0.4156 | 1.3118 | 2.1948 | 3.0652 | 4.0146 | 5.0052 |
| 699.85 | -6.2604 | -5.1823 | -4.1303 | -3.1042 | -2.1561 | -1.2858 | -0.4416 | 0 | 0.4156 | 1.3118 | 2.1930 | 3.0652 | 4.0177 | 5.0092 |
| 710.02 | -6.2604 | -5.1823 | -4.1303 | -3.1042 | -2.1561 | -1.2858 | -0.4416 | 0 | 0.4156 | 1.3118 | 2.1879 | 3.0652 | 4.0226 | 5.0123 |
| 719.85 | -6.2604 | -5.1823 | -4.1303 | -3.1042 | -2.1561 | -1.2858 | -0.4416 | 0 | 0.4156 | 1.3118 | 2.1782 | 3.0652 | 4.0283 | 5.0138 |
| Min | -6.2604 | -5.1823 | -4.1303 | -3.1042 | -2.1561 | -1.2858 | -0.4416 | 0 | 0.4156 | 1.2858 | 2.1109 | 2.9551 | 3.9095 | 4.7572 |
| Max | -5.9911 | -4.9304 | -3.9239 | -2.9862 | -2.0016 | -1.2017 | -0.4026 | 0 | 0.4286 | 1.3657 | 2.1950 | 3.0652 | 4.0485 | 5.0138 |
| peak-to-peak keystone (mm) | 0.2693 | 0.2519 | 0.2064 | 0.1180 | 0.1544 | 0.0842 | 0.0390 | 0 | 0.0130 | 0.0799 | 0.0842 | 0.1101 | 0.1390 | 0.2566 |