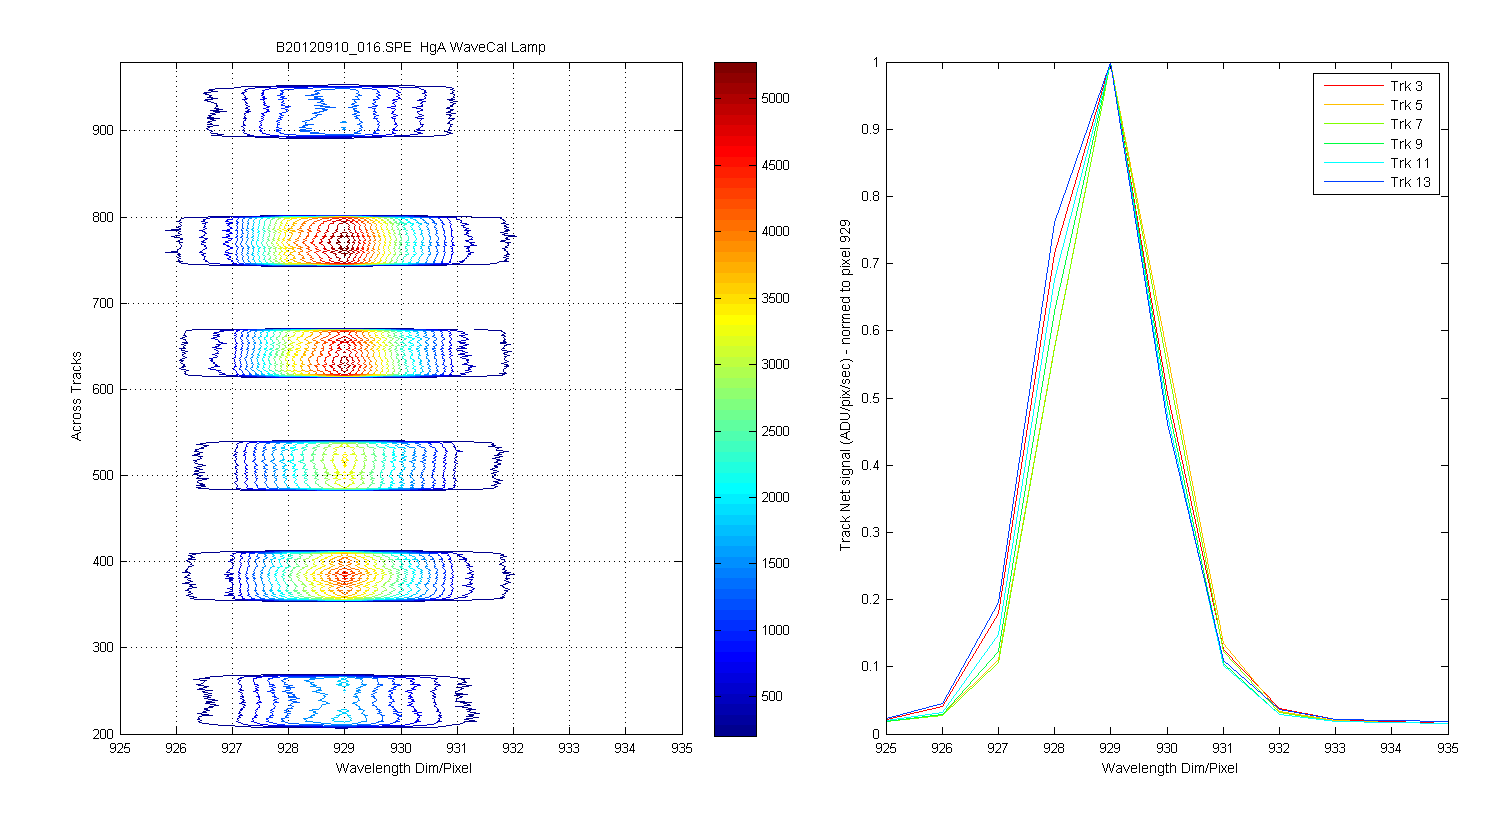
Carol asked me to make some images which zoomed into the peaks created by the pen lamps during wavelength calibrations. These would show any smile if there was any. What I did was take the images of the blue spec HgA and Ne lamps and zoomed in on a few peaks across the array. Thre first figure shows the data for the Ne pen lamp as contours and then there are three more graphs zoomed in on the peaks with the red dashed lines. The left panel in the figures shows the zoomed peak with contour lines and the right panel is the net data normalized to a pixel (see ylabel for pixel number). There is a similar set of graphs for the HgA pen lamps.
For the most part the peaks are in the same pixel so the smile is within on pixels,except possibly for the peak around pixe 84. You can also notice that the peaks are a little wider at the base of the peak for Track 3 and narrower for 13. I dont know if this is smile or keystoning but it is in all the peaks across wavelengths.
Figure 1
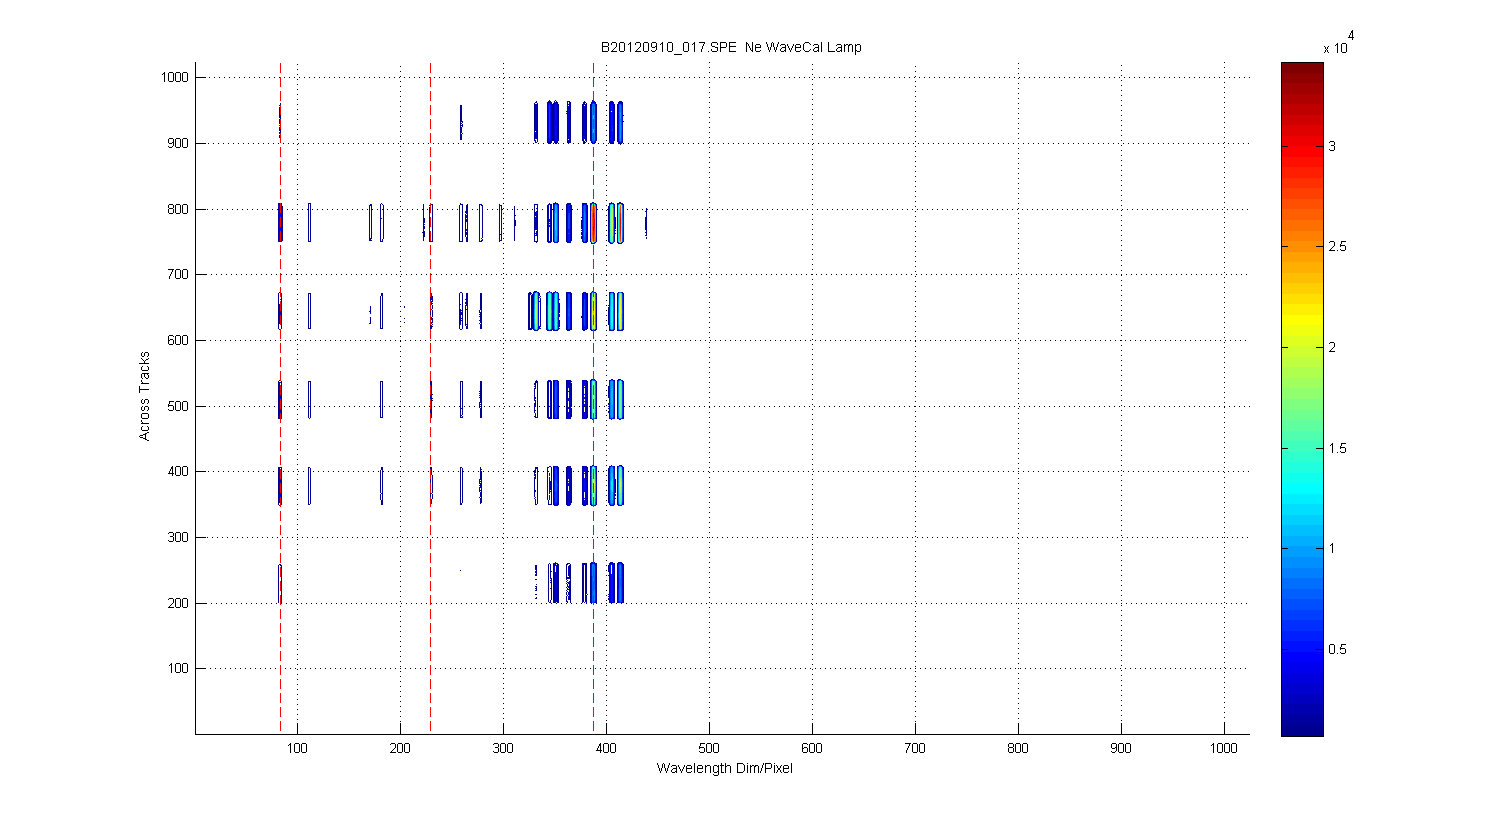
Figure 2
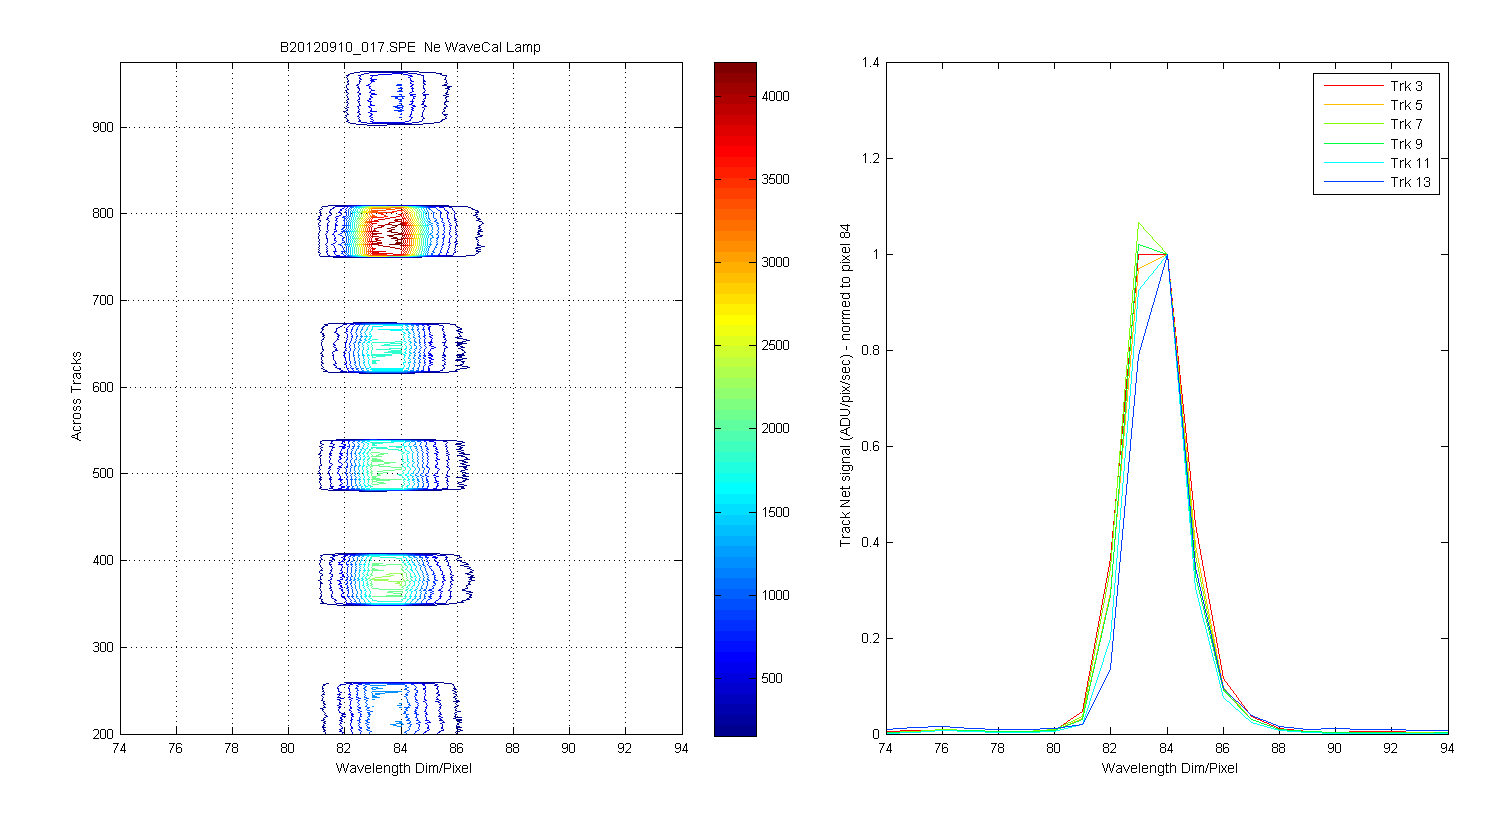
Figure 3
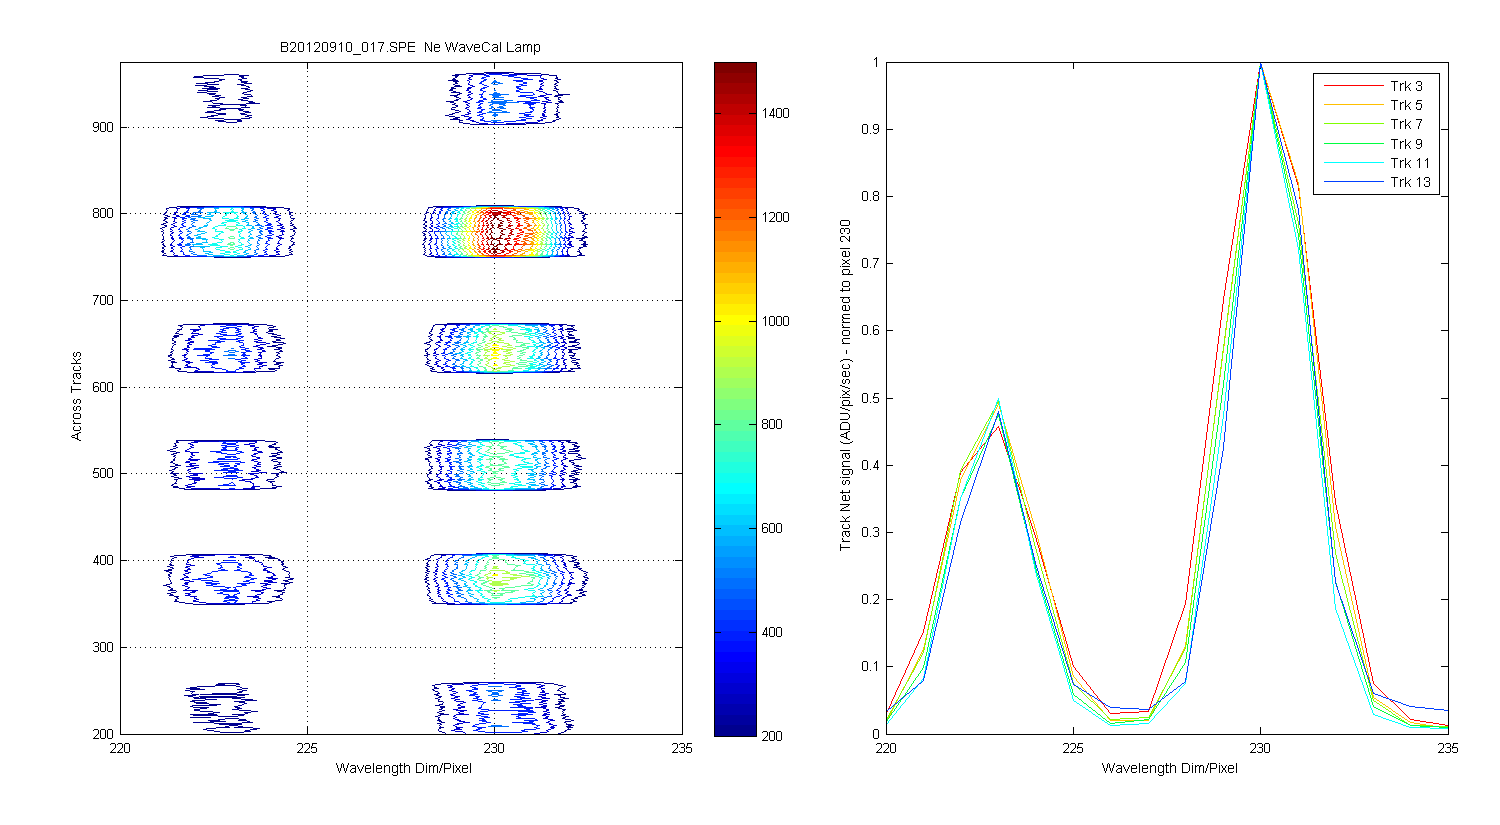
Figure 4
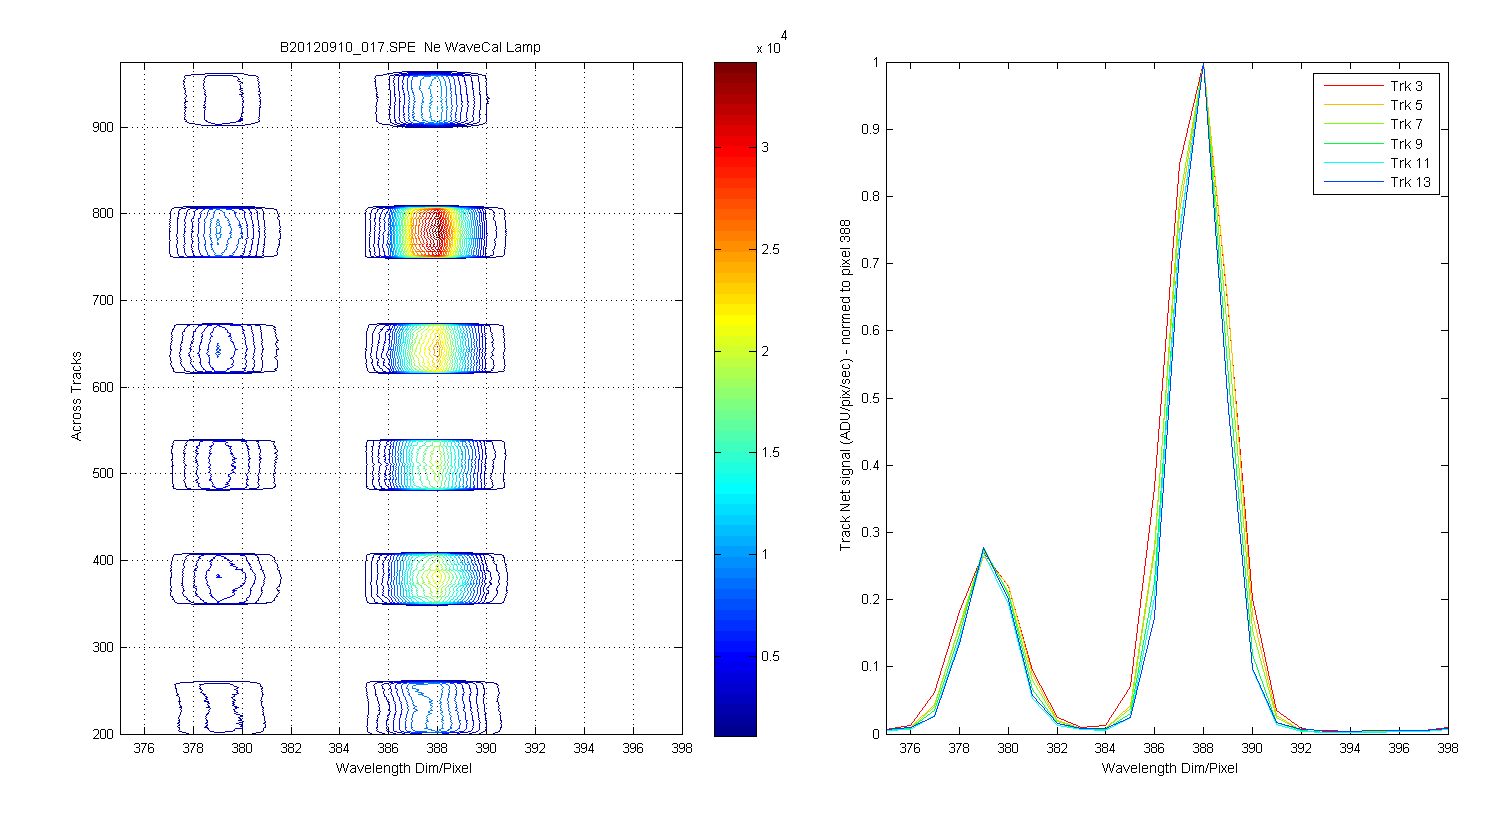
Figure 5
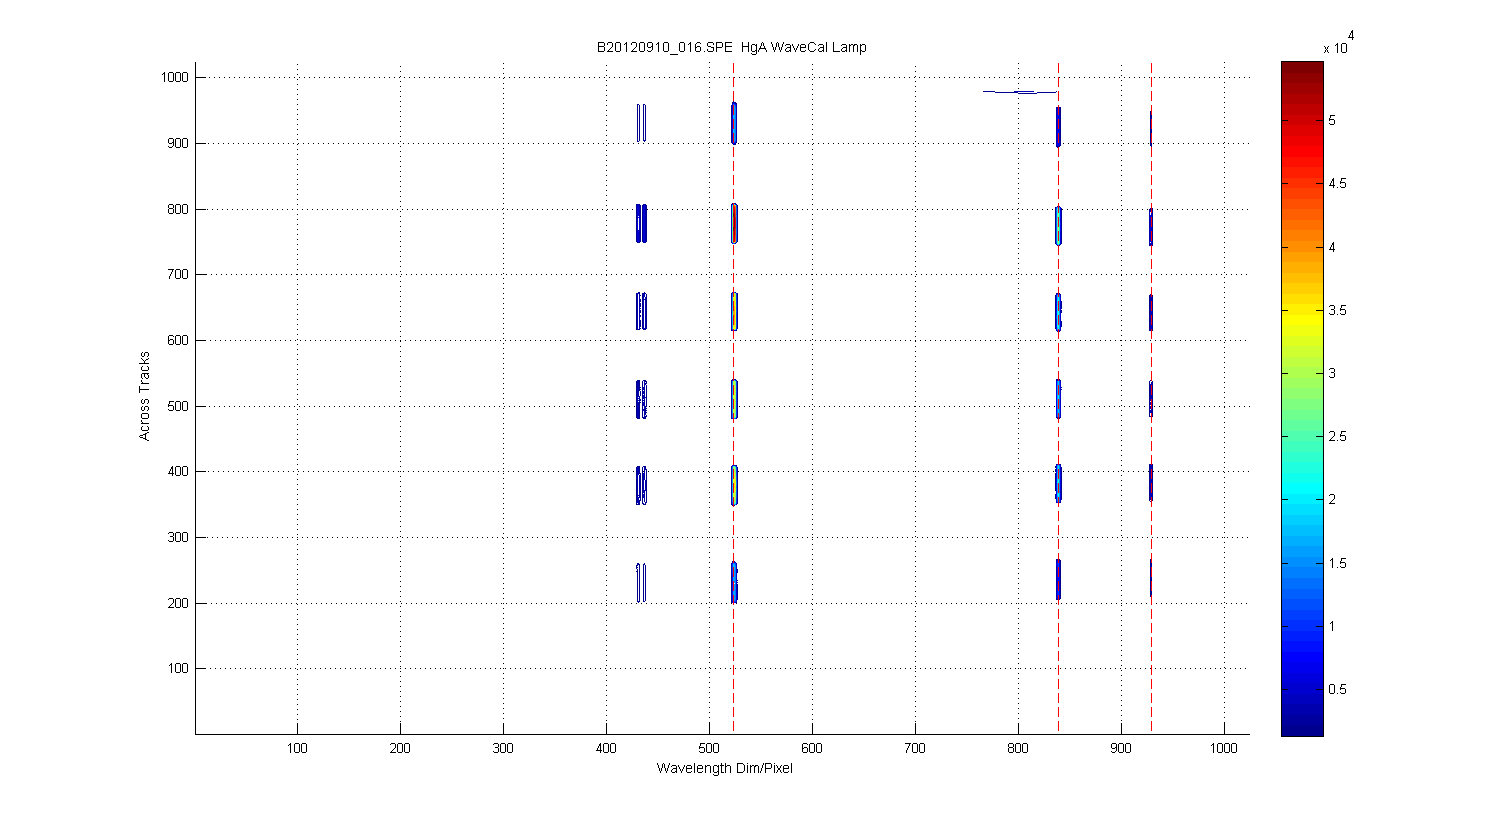
Figure 6
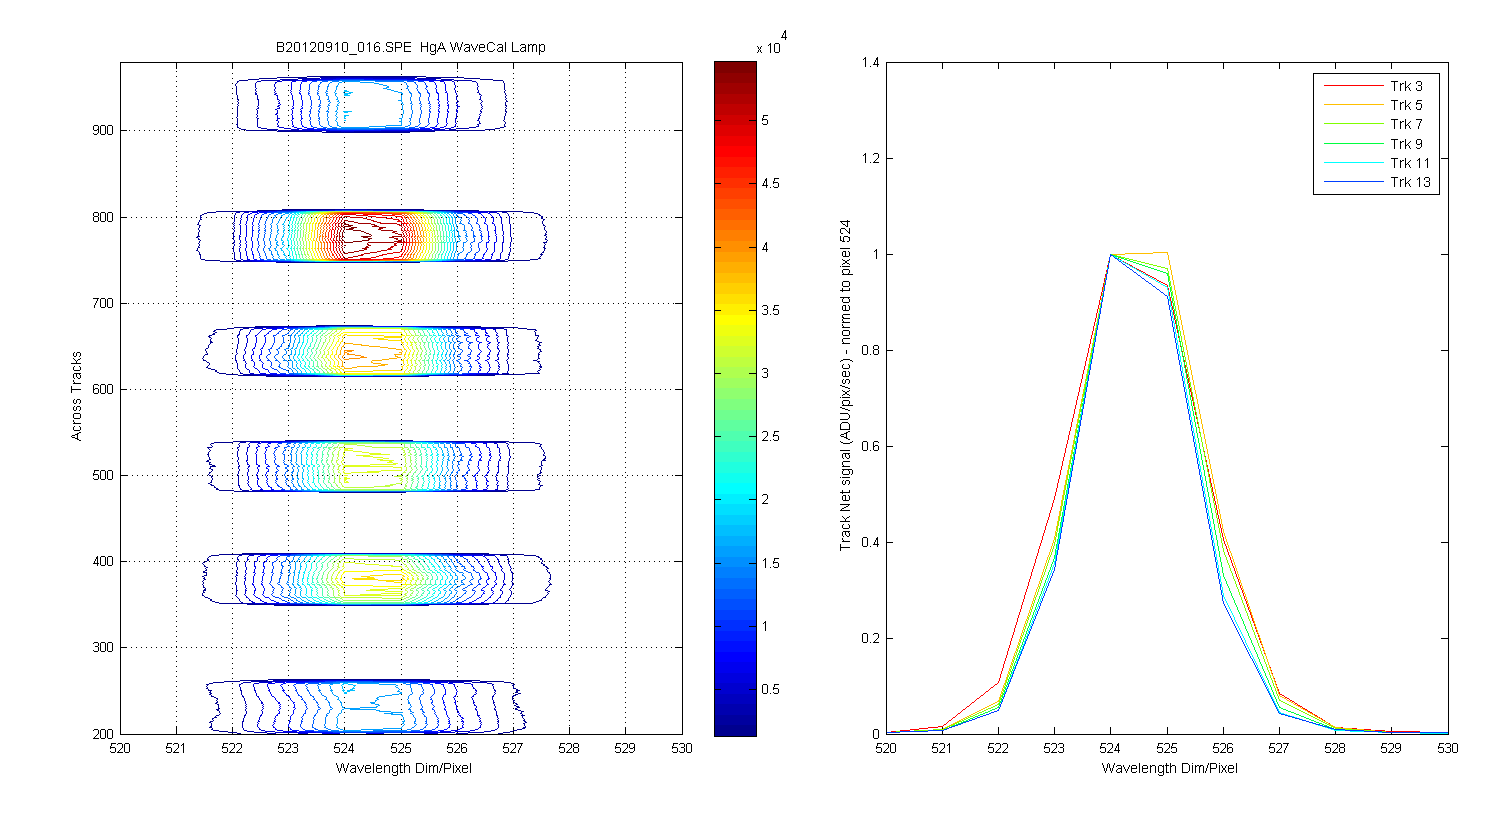
Figure 7
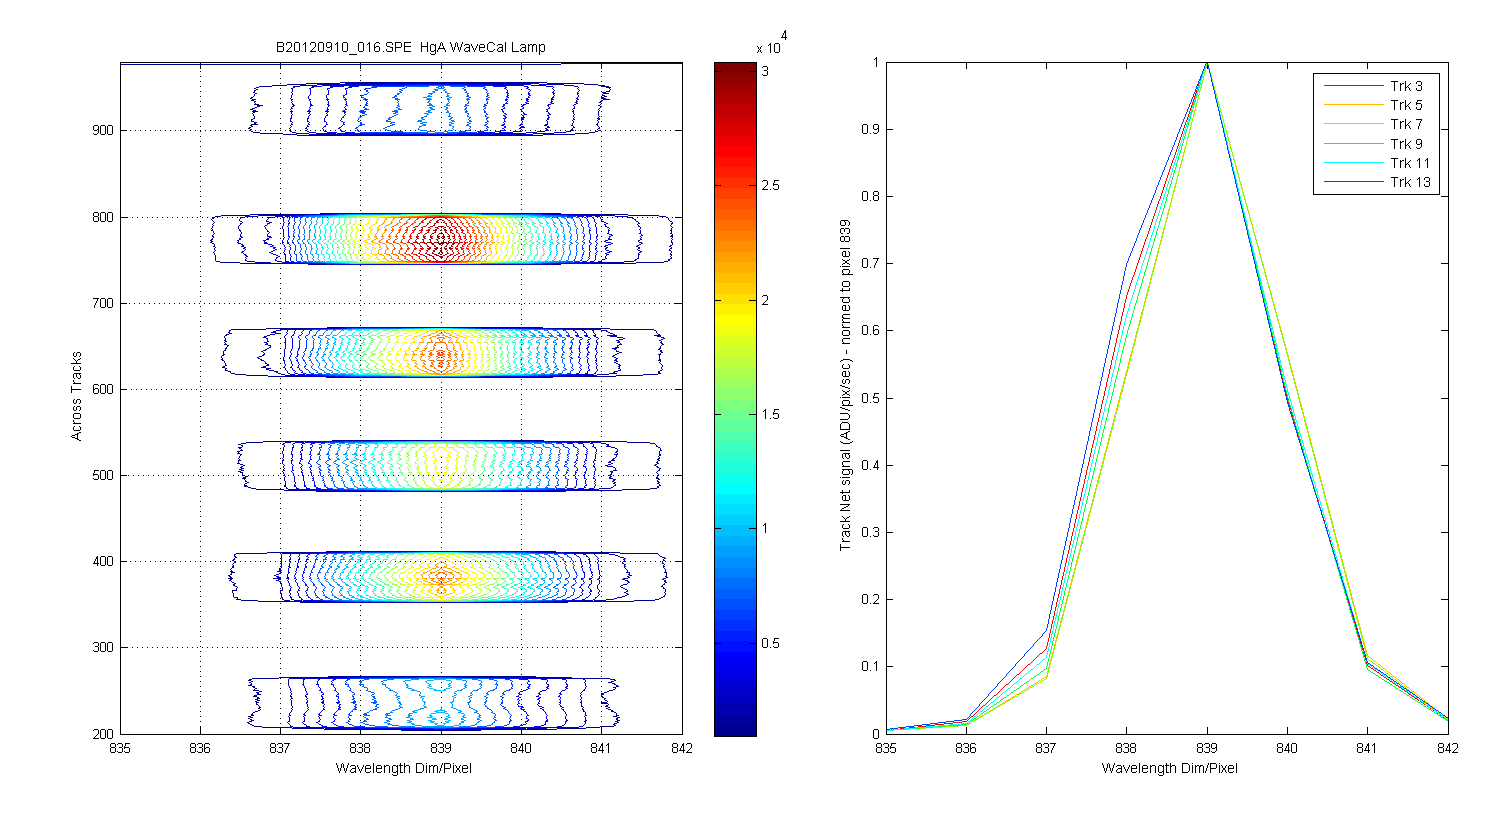
Figure 8