REVISION DATE: 29-Jan-2013 10:41:21
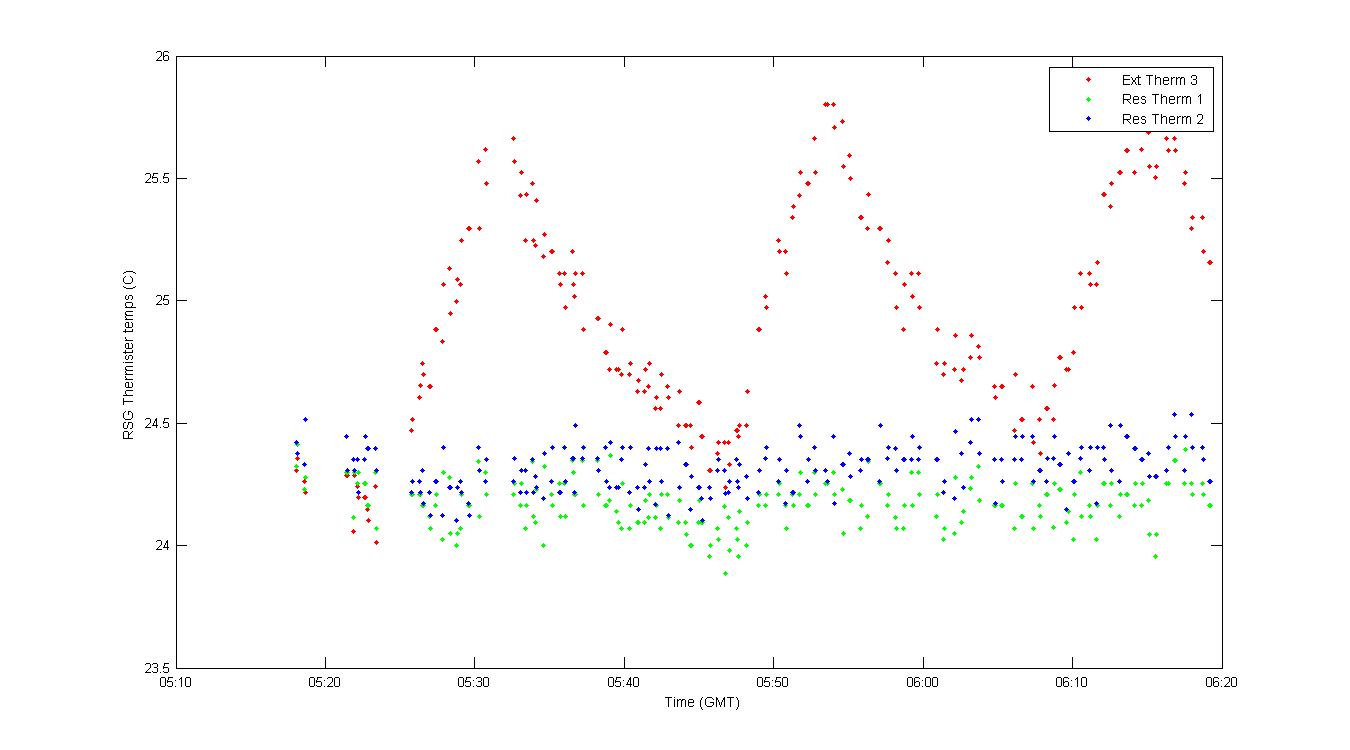
Mike took some data during warmup of the FISH in preperation to take a second linearity data set. The idea was to look at what the darks are doing during warmup. Each file has 4 darks, 2 collected before the lights (D1 and D2) and 2 collected after the lights (D3 and D4). For each dark I meaned pixels 500:520, this results in 4 darks for each file. This is what you see in the first figure. Note the up and down patter follows the Res Therm 3 very nicely. I then took the mean of the 4 darks for a file and subtracted the indidual mean dark. This is the second figure. There is an interesting pattern where the darks before and after separate and come back together. Not sure what that means. Or if it is related to Therm 3. The first three figure are the BSG and the second three are the RSG.
Figure 1
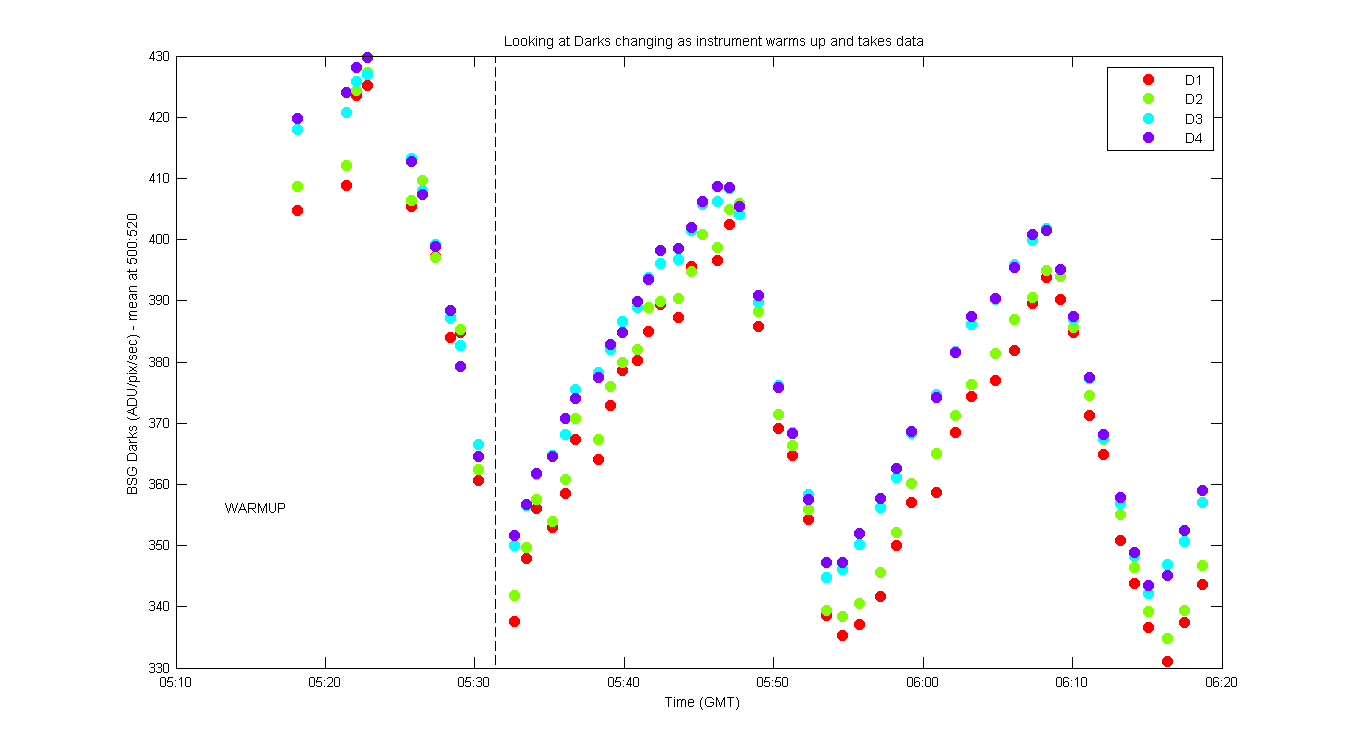
Figure 2
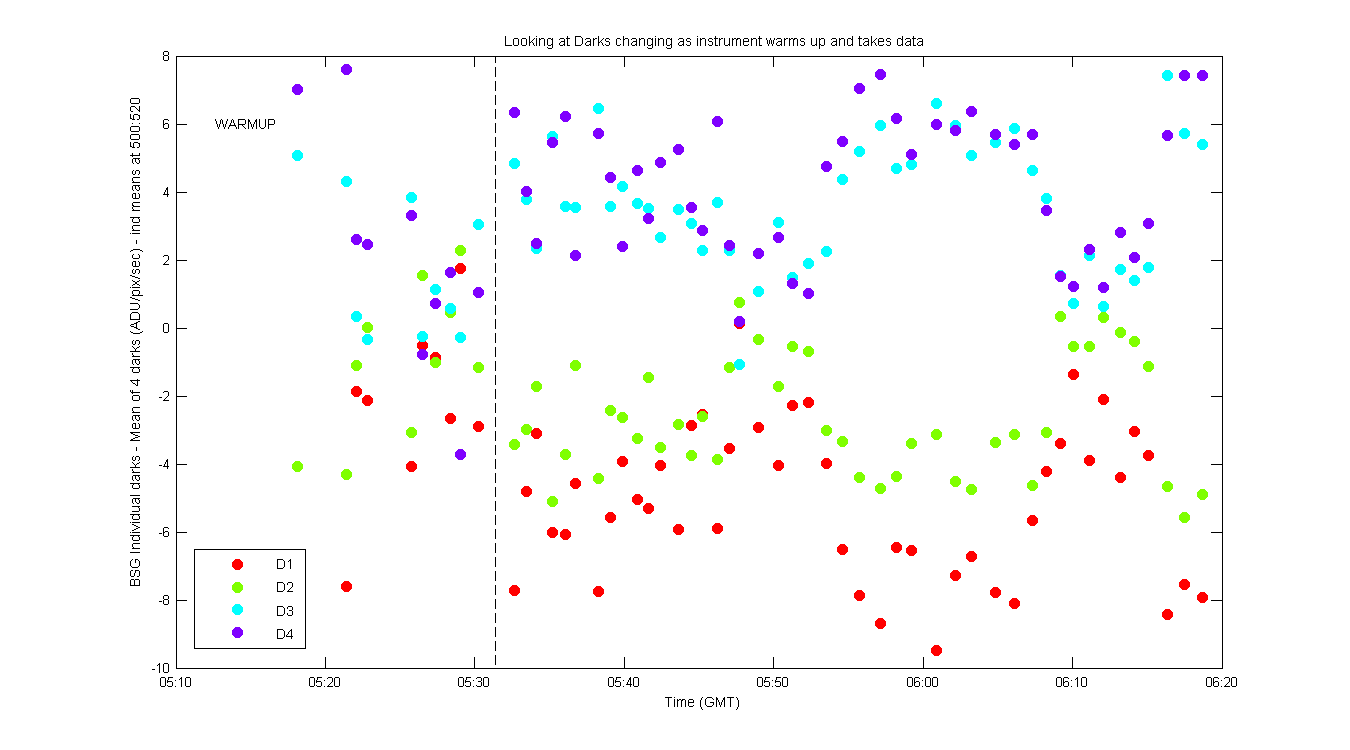
Figure 3
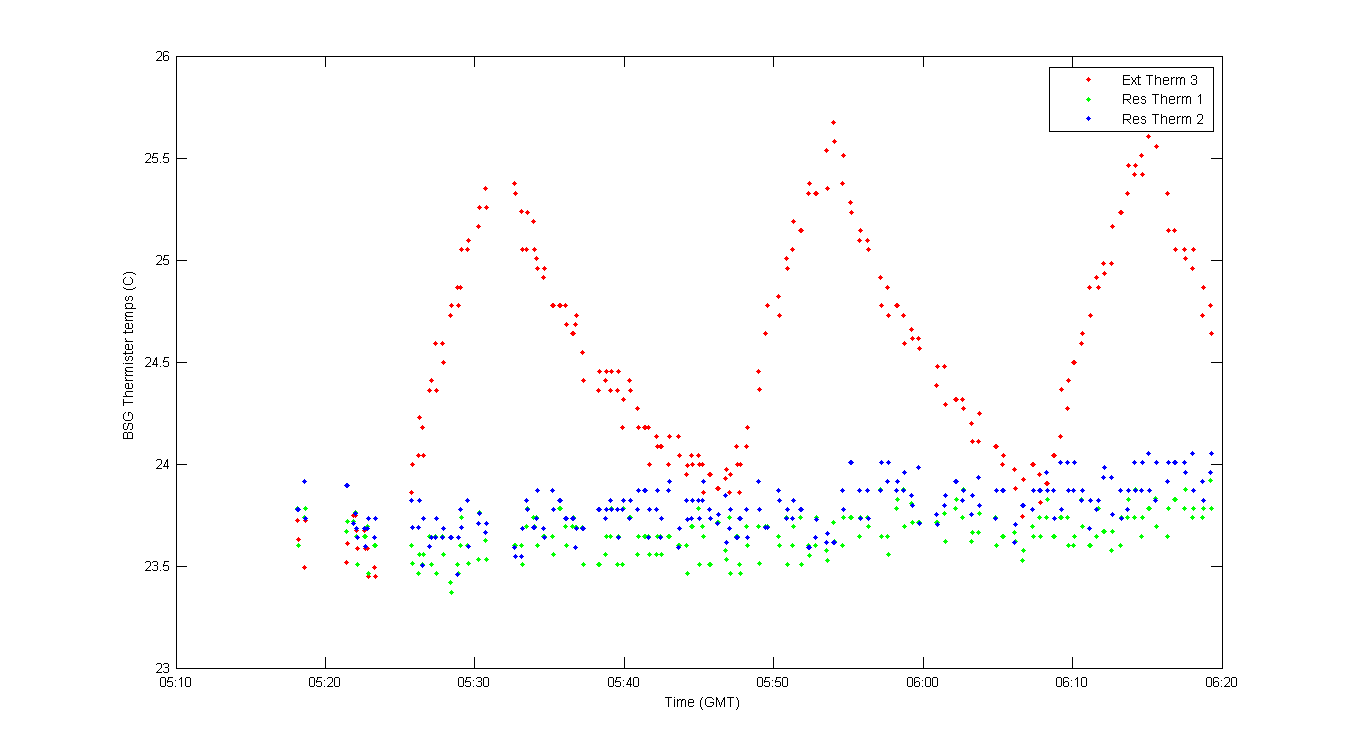
Figure 4
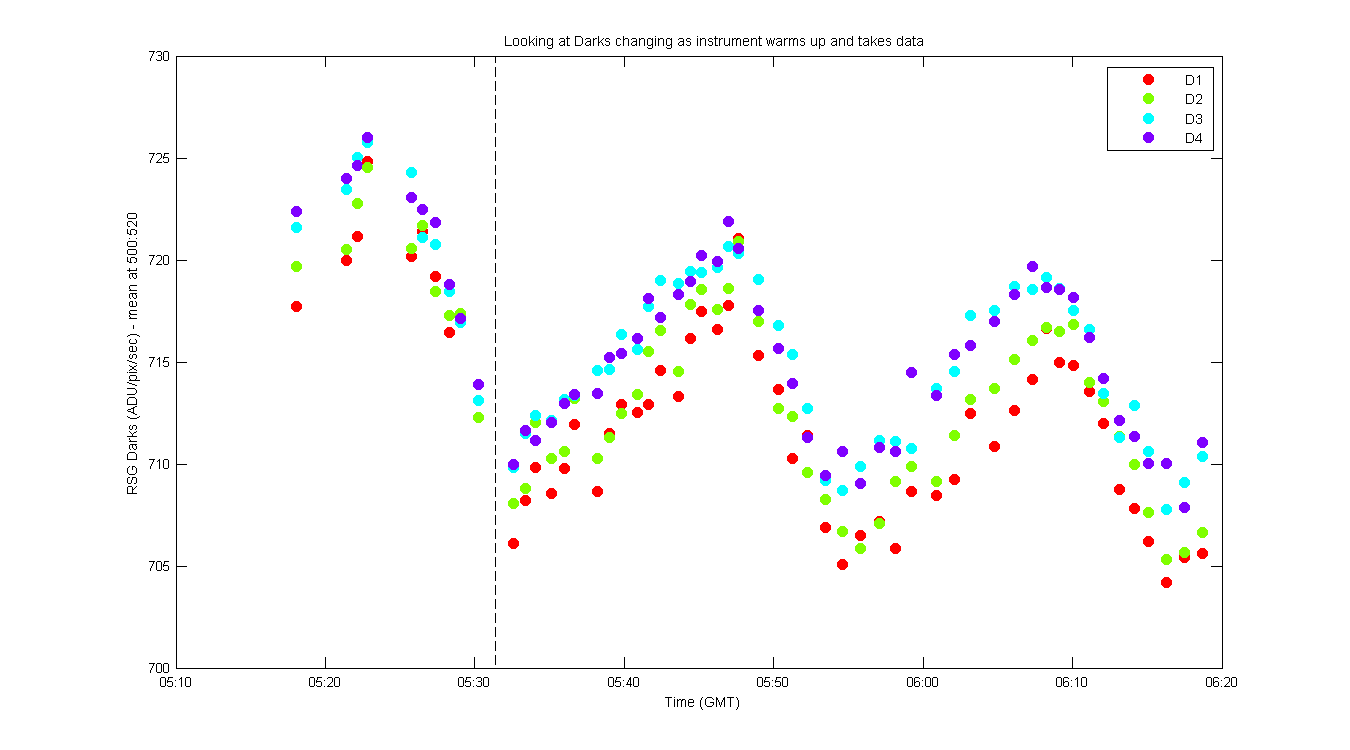
Figure 5
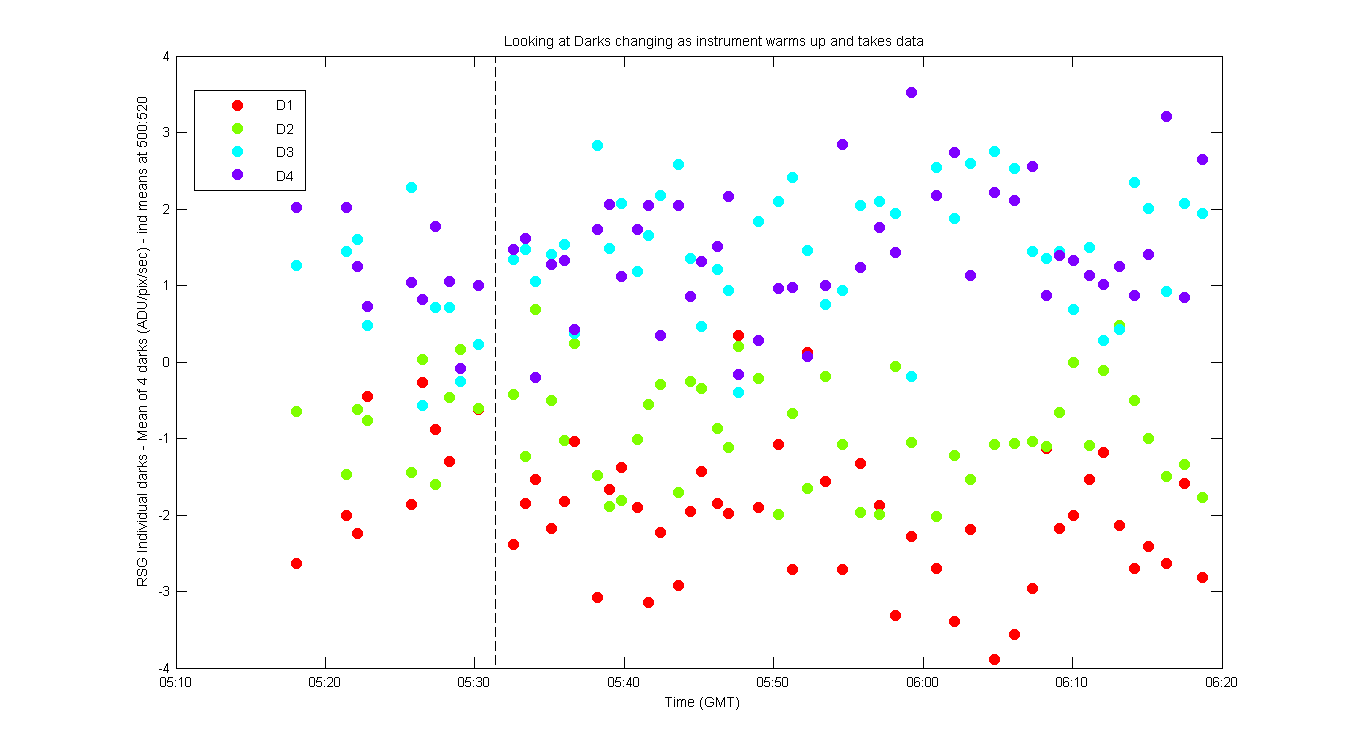
Figure 6