Mike F. suggested I make some overlay plots so you can see the asymetry in the laser data.
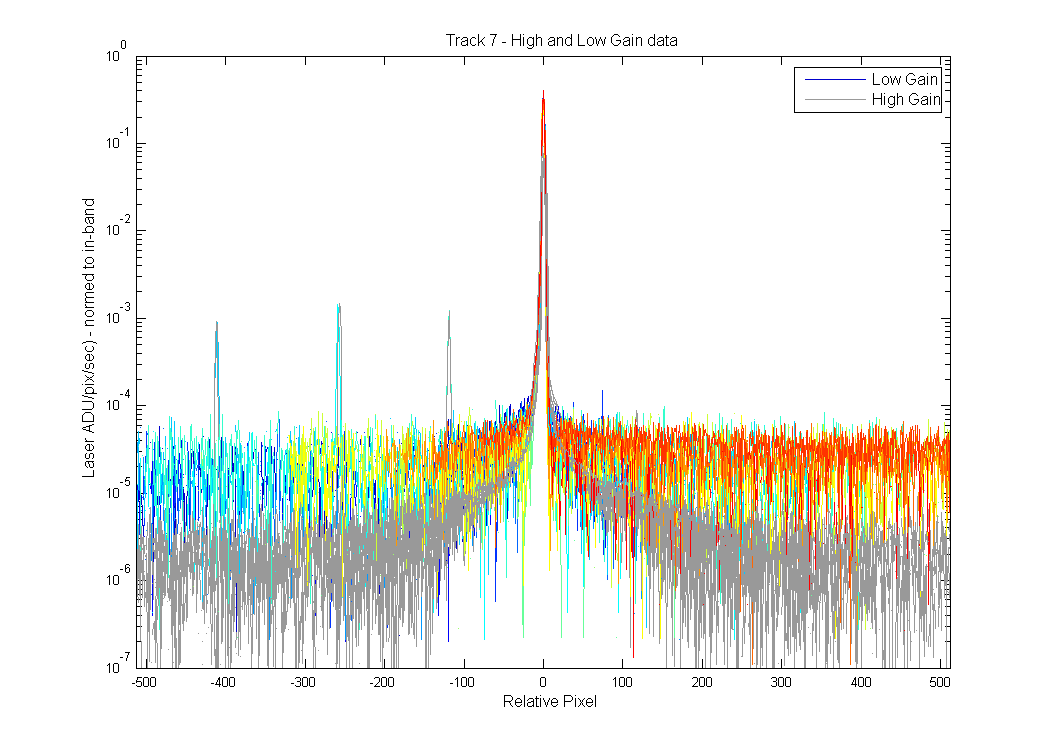
All high and low gain laser data for Track 7.
Figure 1
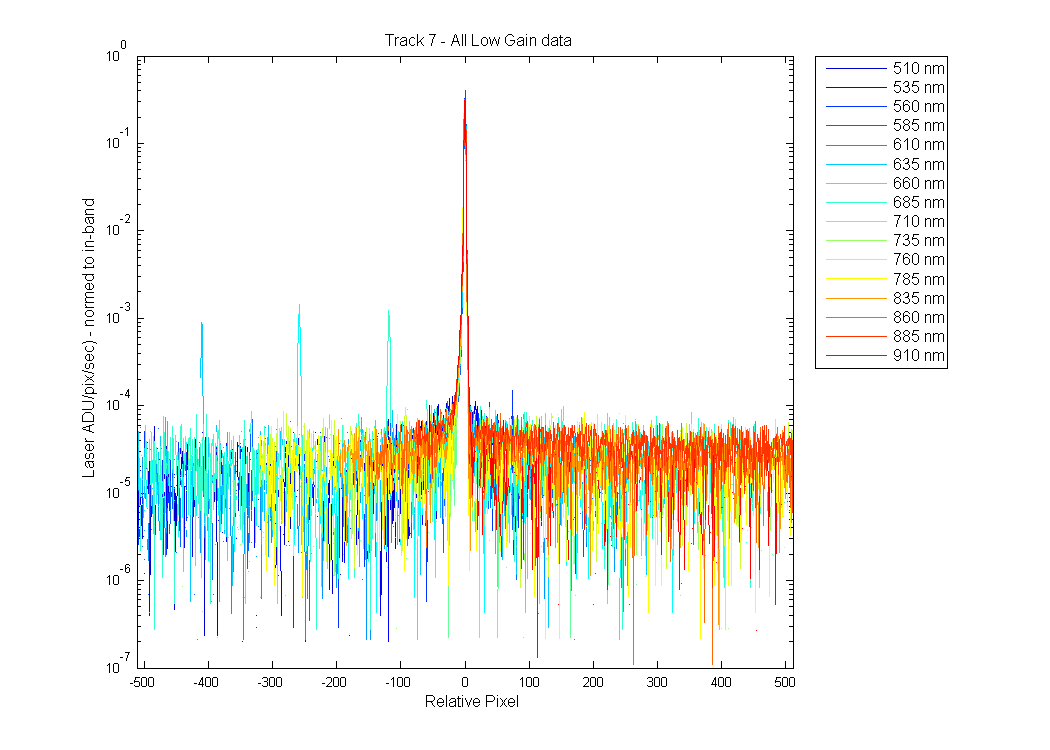
All low gain laser data for Track 7.
Figure 2
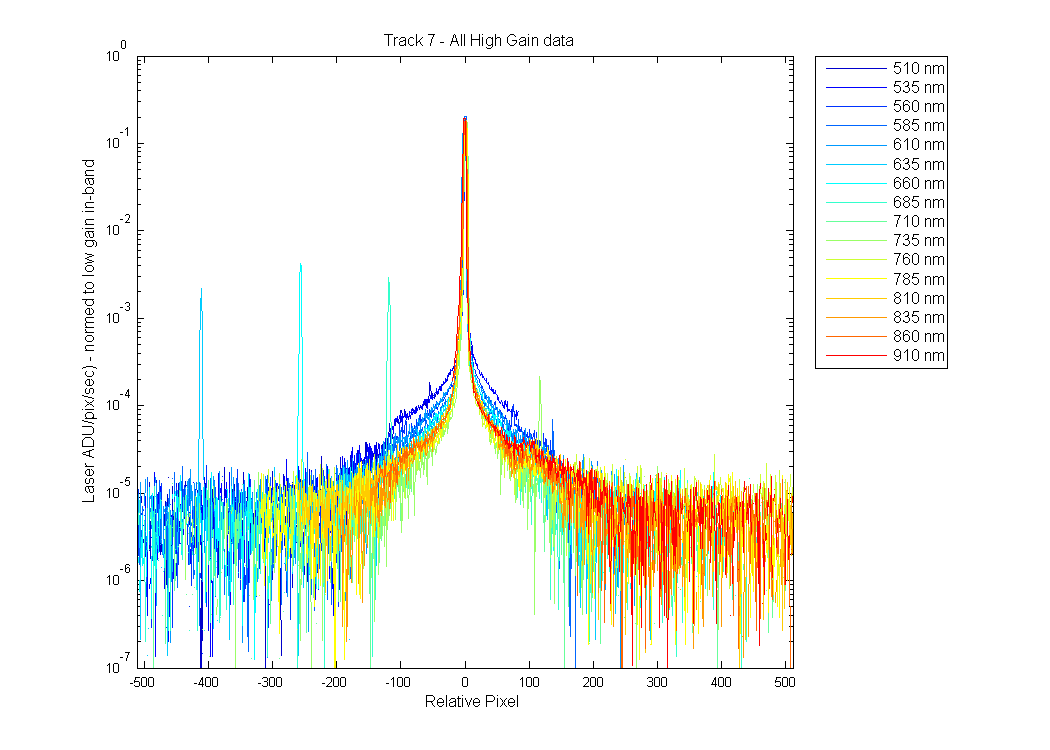
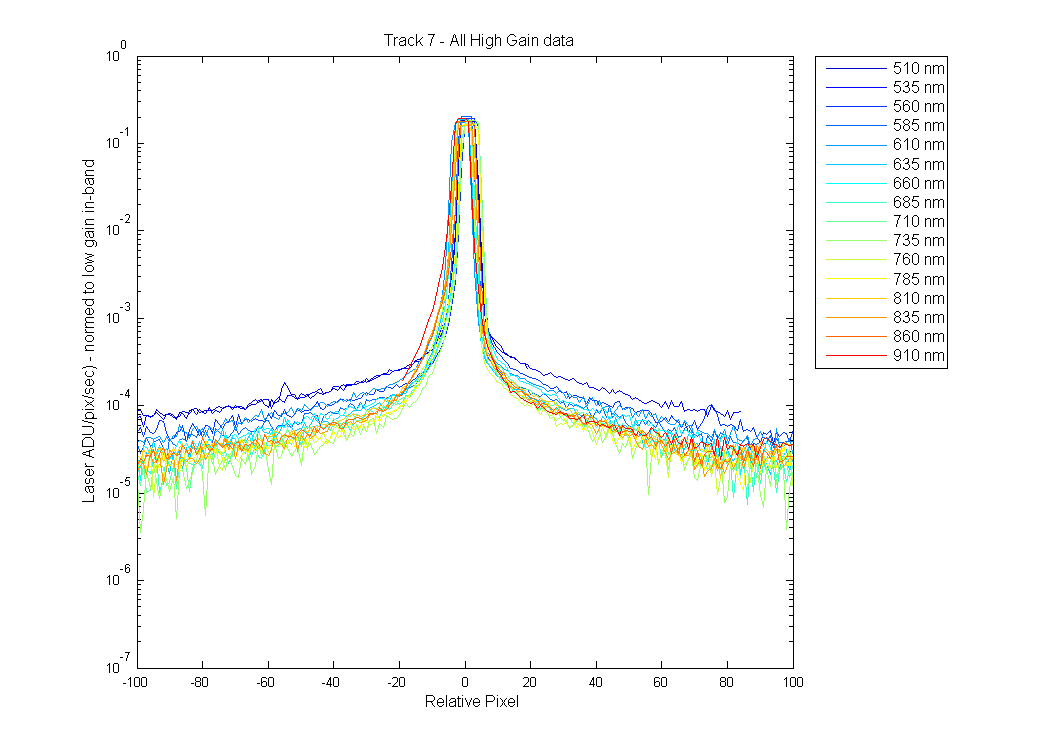
All High gain laser data for Track 7.
Figure 3
All High gain laser data for Track 7 - zoomed in.
Figure 4
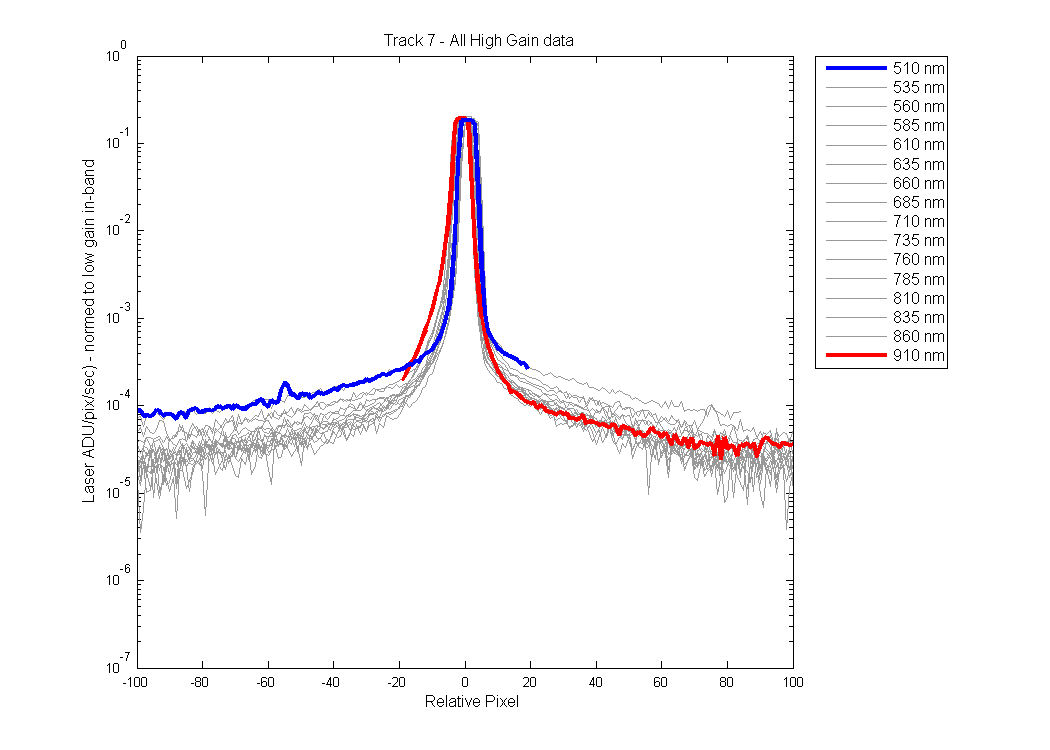
EMAIL from MIKE F: In the overplot page, last Fig.4, could you maybe make a Fig.5 where all lines are gray, then only the 510 nm is blue, and the 910 nm is red ? So maybe the change in peak shape is easier to see at the extremes...
Figure 5