Images of all SPE files
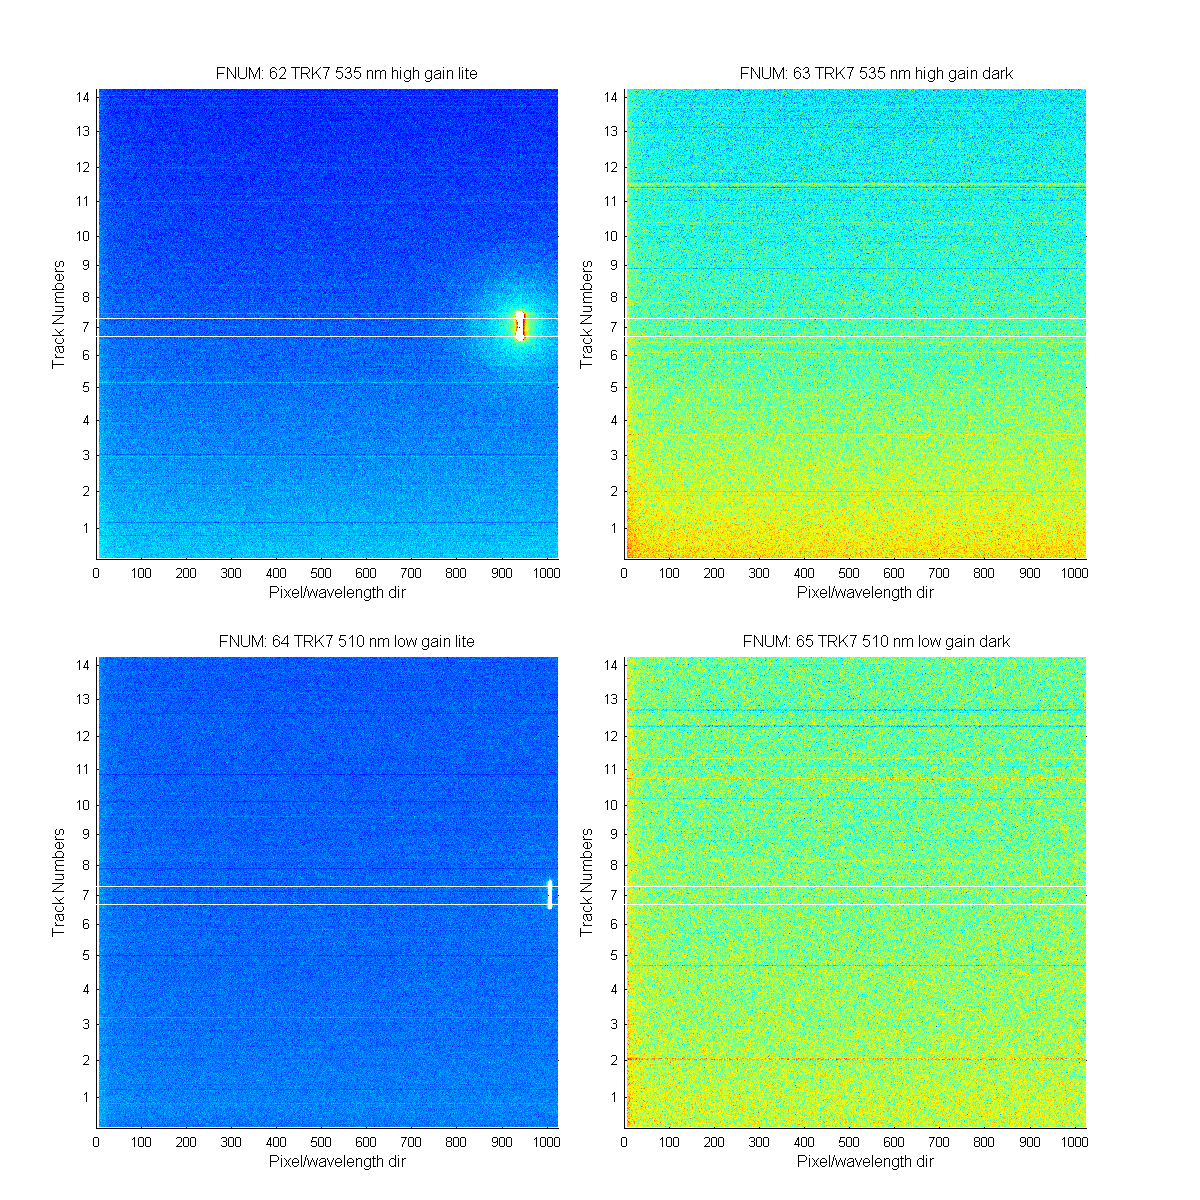
I wanted to look at all the SPE file images for the cross and along track features. So I created the following graphs.
I loaded each SPE file, I then removed
all values greater than 1000 ADU and logged the data. This way we can see the cross track and stray light better.
Only frame 2 was used and the below images are the lite and dark images.
Email from Mike F on 11/17/2010 5:36 PM
Hi StePh,
Are these the "base" of laser image ( ADU < 1000 ) for a lite scan ?
Answer: Yes for the lite scans. The darks cans are also shown.
Is the wavelength direction along the X axis, with shorter nm at larger pixel ? And the Y axis
would be track direction ?
Answer: Yes, Pixel 1 is ~915 nm and Pixel 1024 is ~503 nm .
Do you have an idea what are the pixel limits for "TRK 7", and maybe could you put a pair of
black lines on maybe the first couple images for these limits ?
Answer: I have added white lines for the edges of track 7.
Do the lite/dark high/low get out of sync because of file acquisition order ? I.E. all 4 Fig.1 are 910nm,
but Fig.2 is missing 885nm high gain dark, and Fig.4/5 has no 810nm low gain light, etc. ?
Answer: Yes, Mike L changed the aquistion order so the files are not in order. Also
because all the ancillary data (wavelength and darl/lite grouping) are not in the files but in an
excel file ordering the images it a little harder. So I just left them in the order the data was taken.
I would suggest that we might want to ask for a finer resolution wavelength interval
around the beginning & end of the refl peak, and where it goes through the main peak:
i.e. between 735 & 760 nm ( r.p. start ), around 710 nm ( r.p. goes through main peak )
between 585 & 560 nm ( r.p. goes off CCD ).
Answer: I agree, this data set is just a fast initial set to see if we see any problems with
the data. When we start taking more data we will be doing a finer scale and more frames (11 rather than
the 2-3 taken for this data set)
And, do you have a good enough feel for what happens when the main peak
goes off the CCD edge ? I.E. nm just above 910, and nm just below 510.
Answer: No we will definately need to get closer to the edge with a fine spacing.
For the images zoomed around the high-gain peak, did "we" ever decide which direction the CCD
readout is scanning in ? I.E. The dumbell shape is interesting...
Answer: No Mark said for the Kiaser it was reading out the wavelength side. My guess is is must
be reading out the wavelenght side otherwise we would not be able to bin the tracks. Which side (top pr botton) of the
wavelength side I don't know. A question for Mark.
Thanks, MF
Figure 1
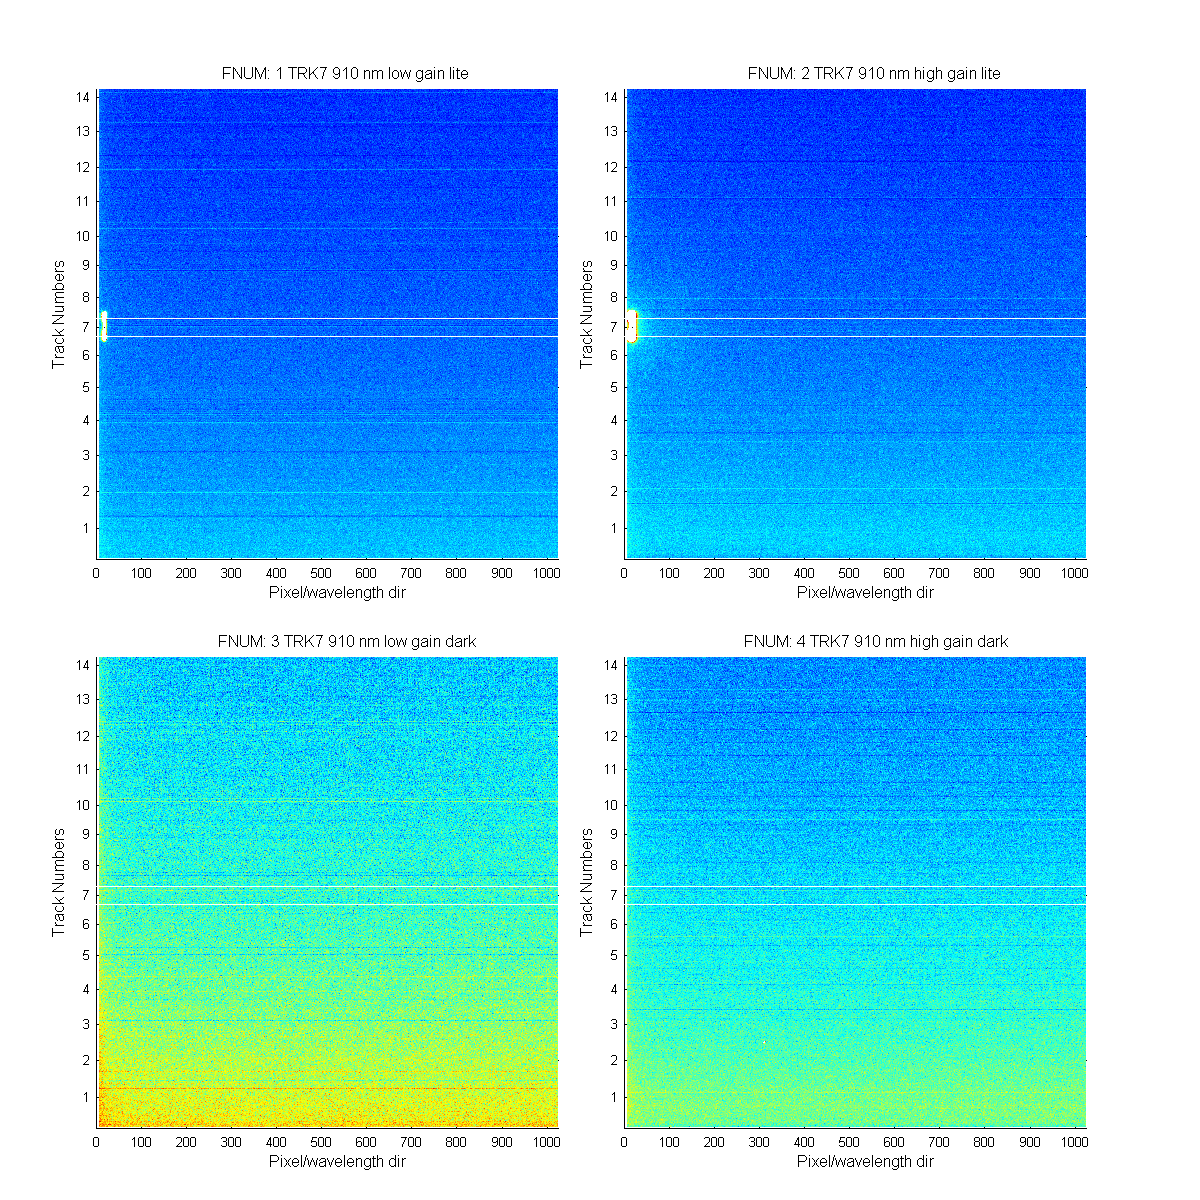
Figure 2
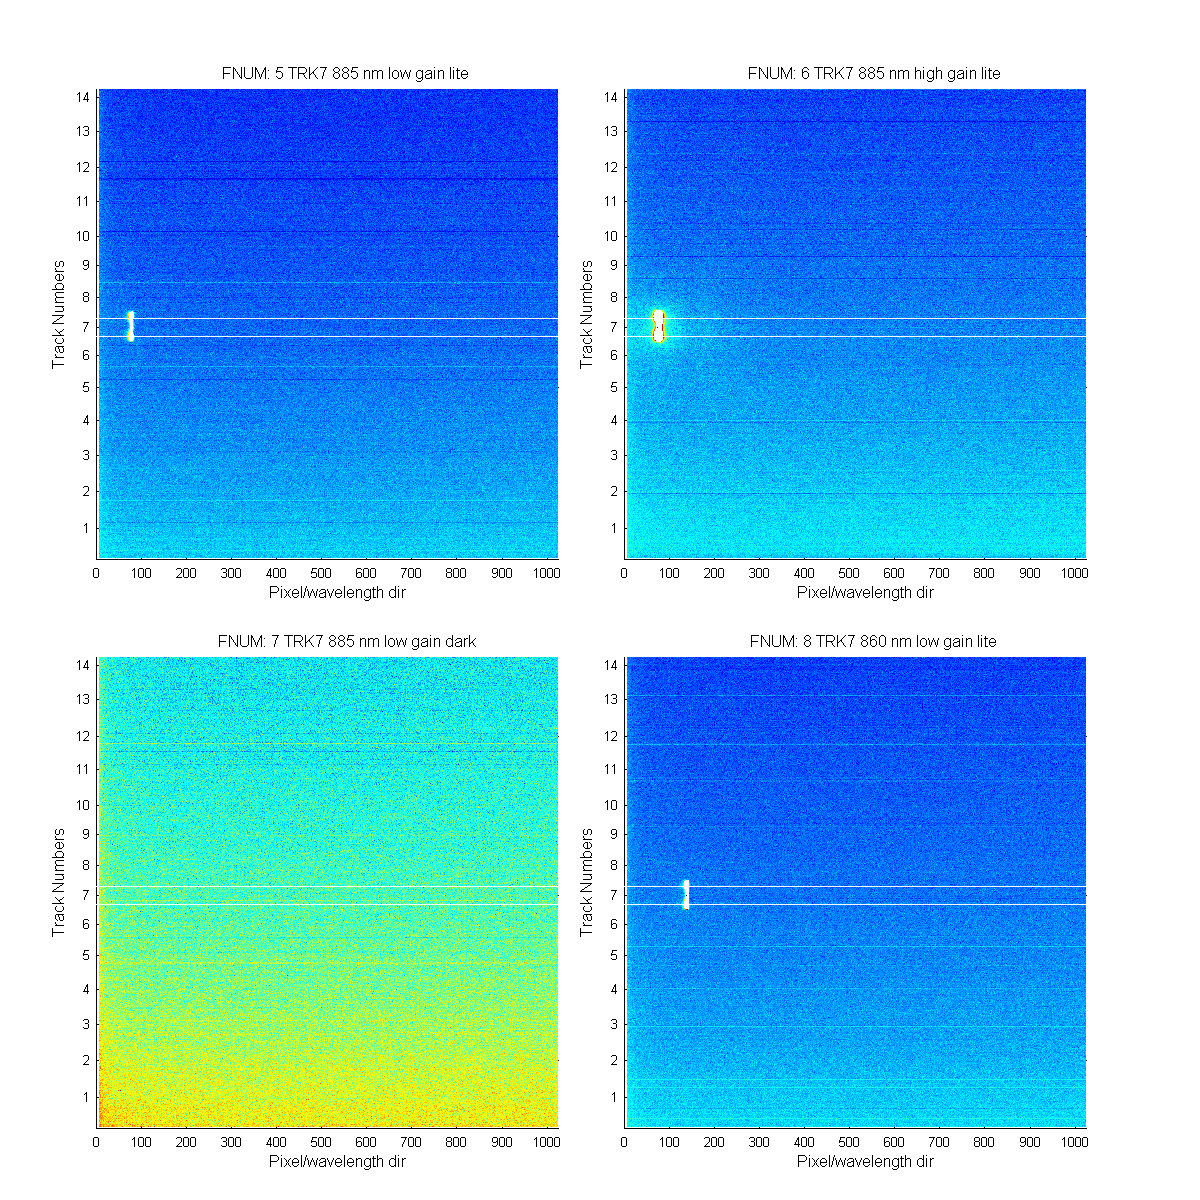
Figure 3
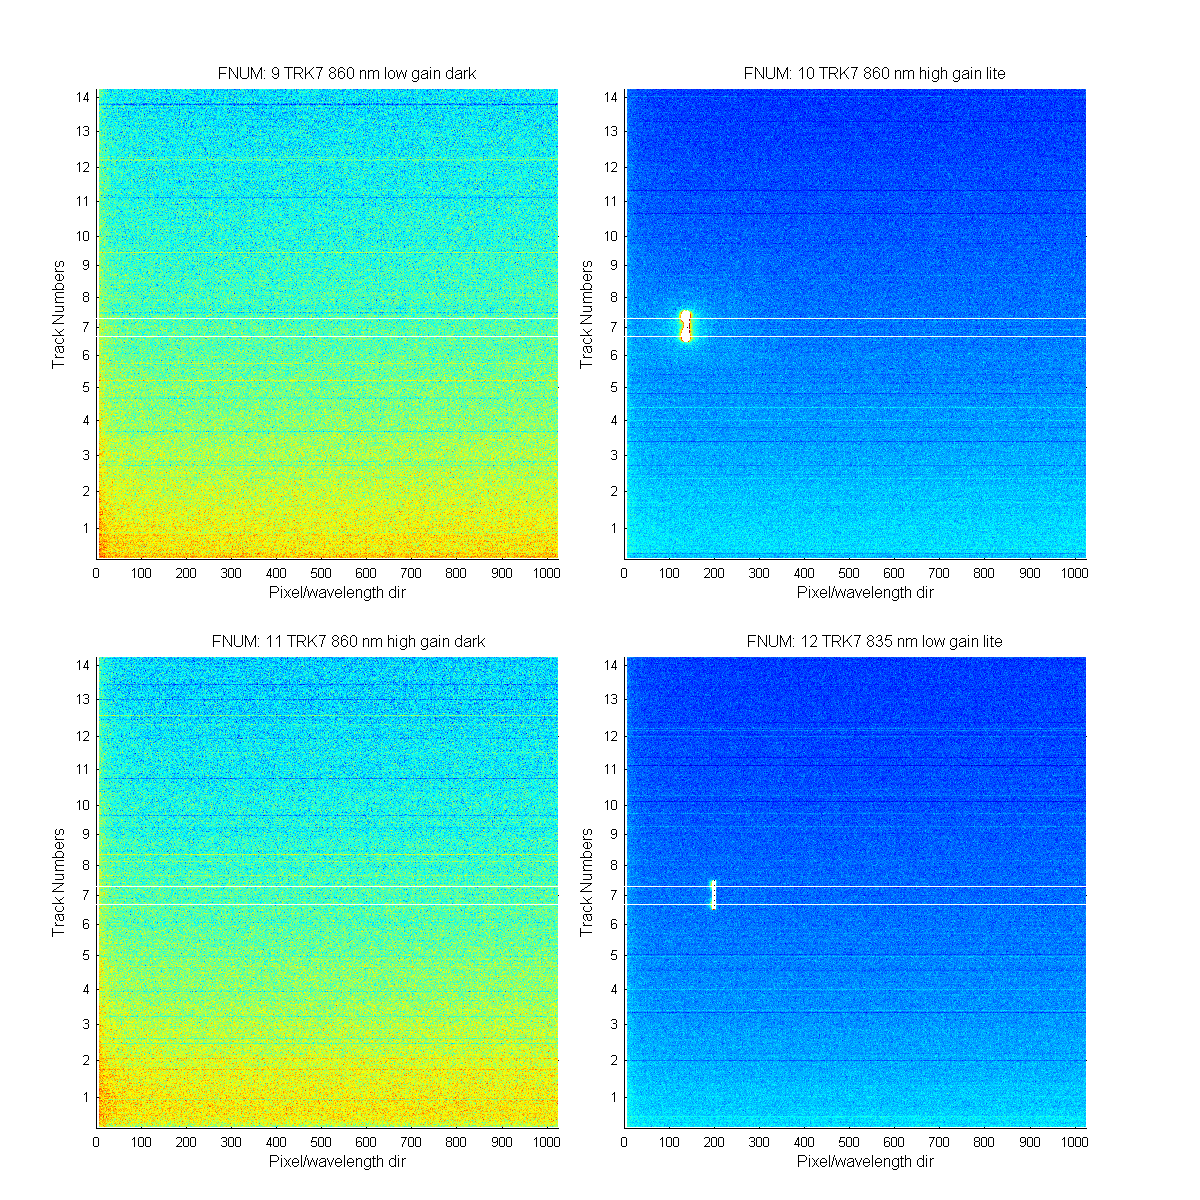
Figure 4
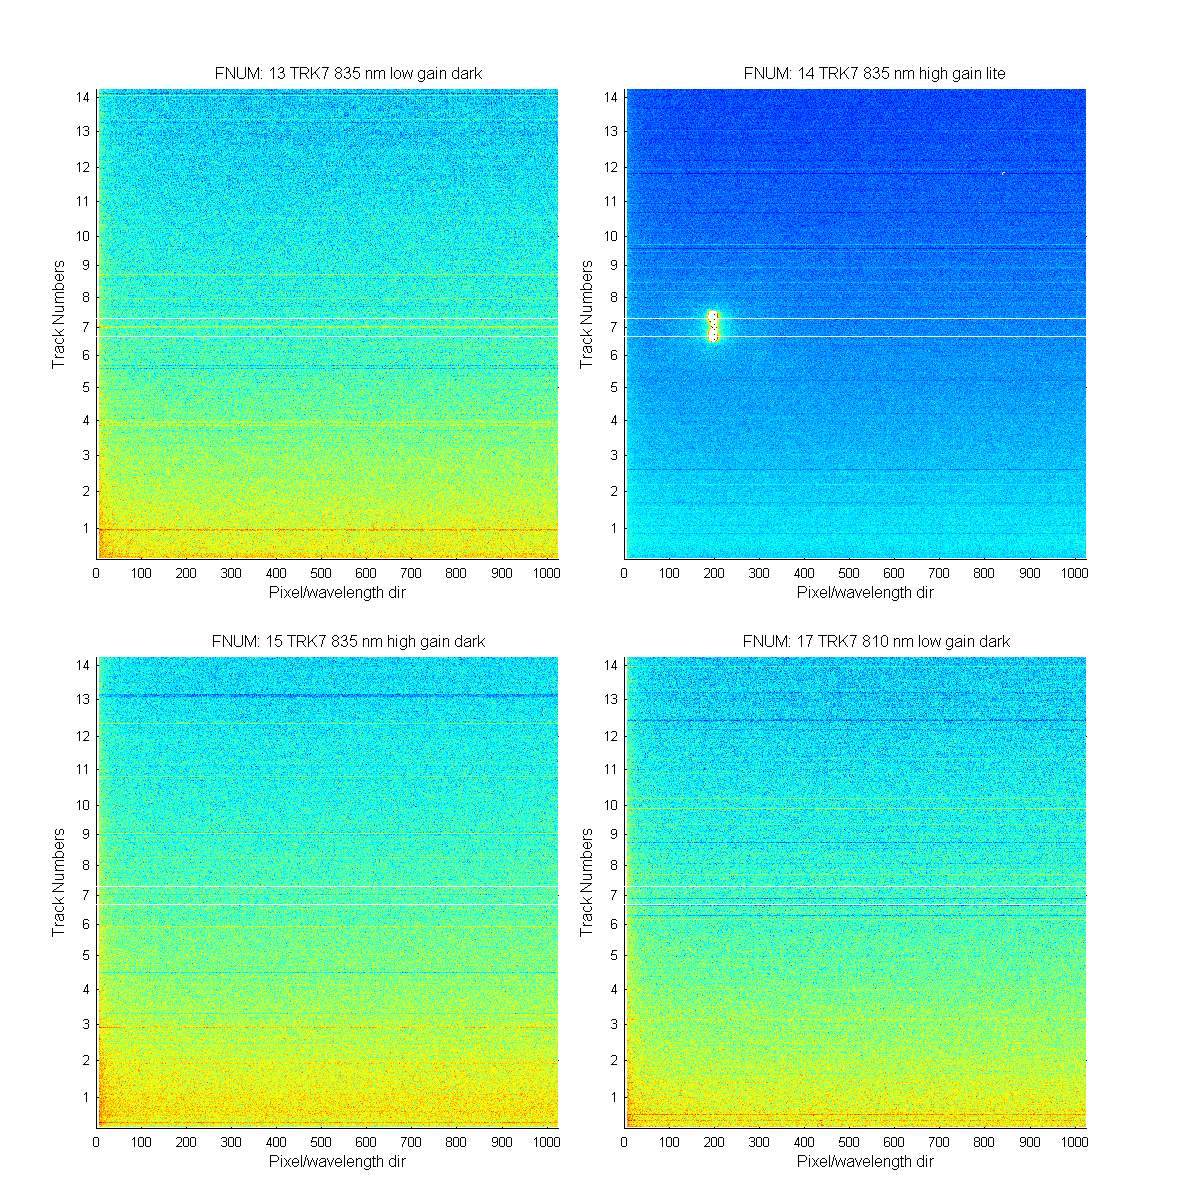
Figure 5
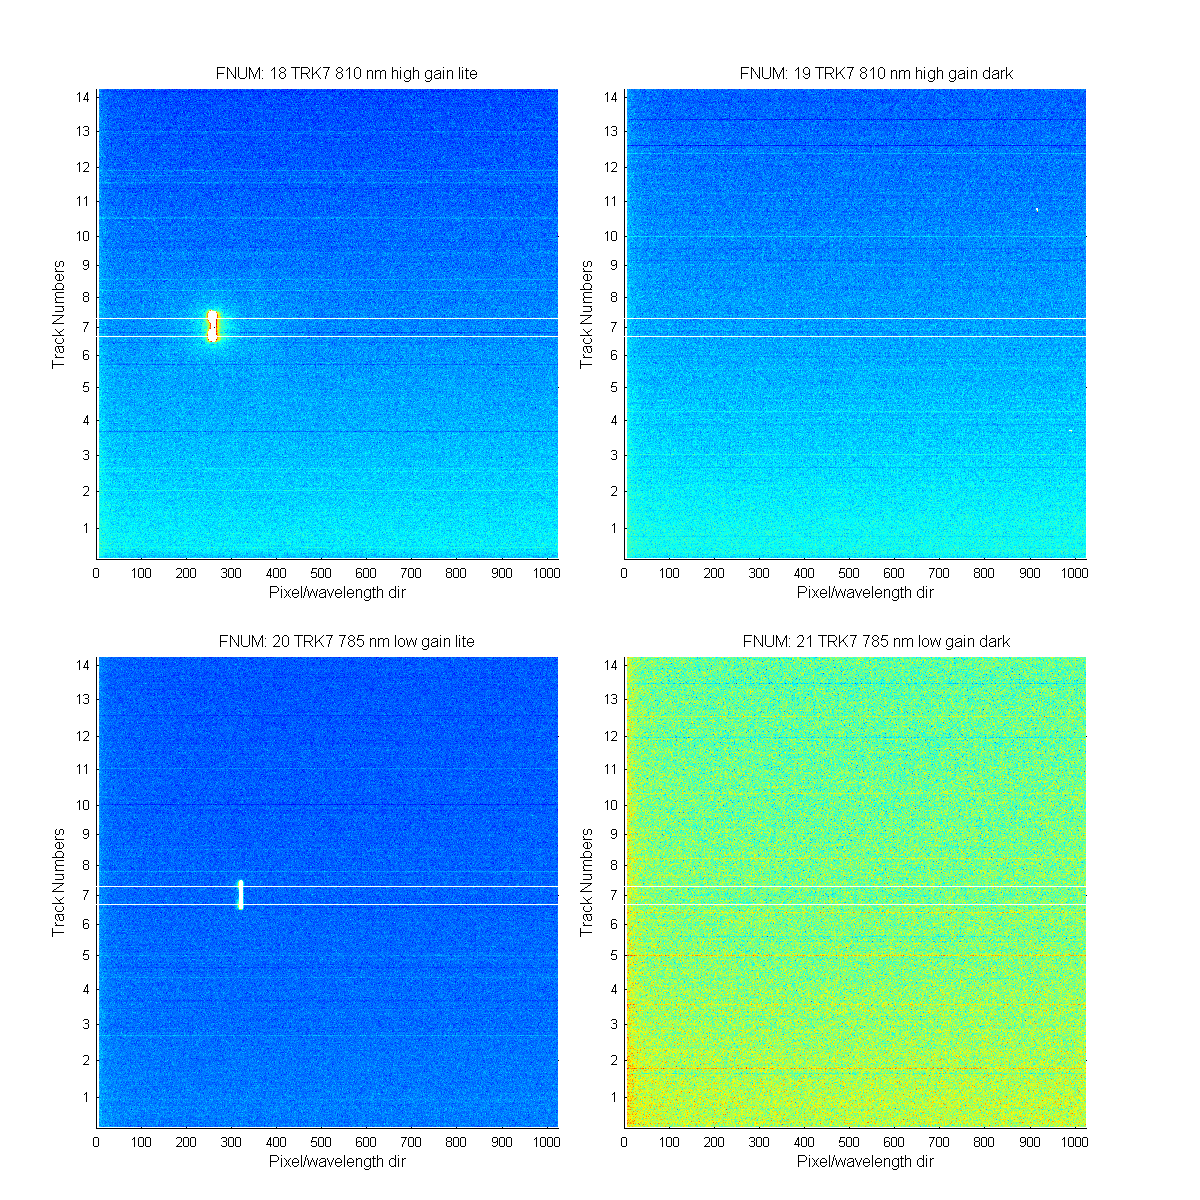
Figure 6
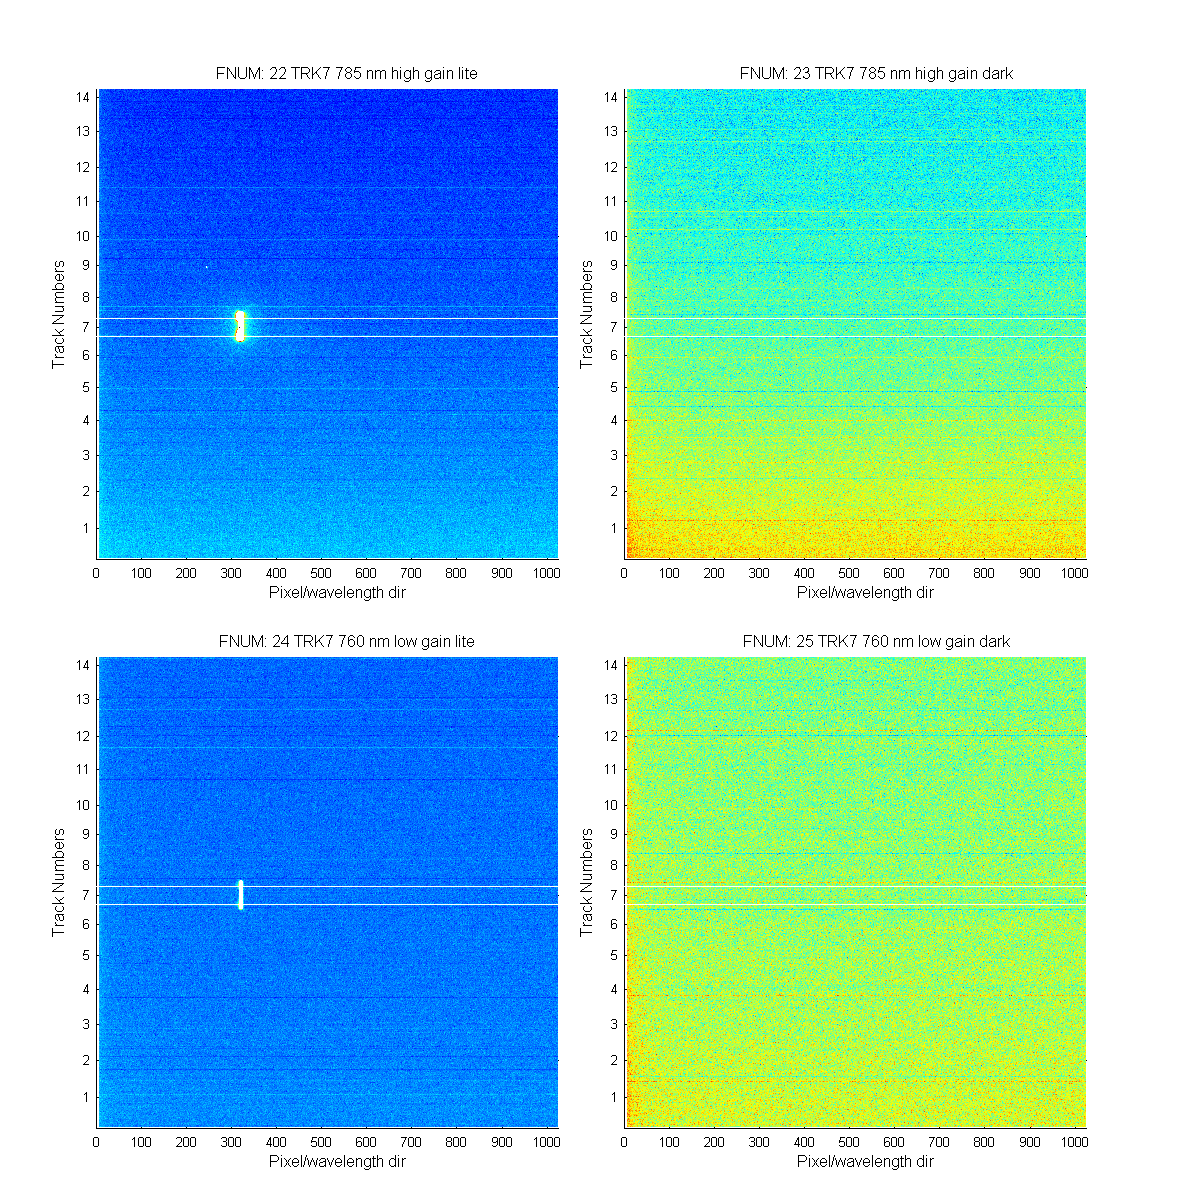
Figure 7
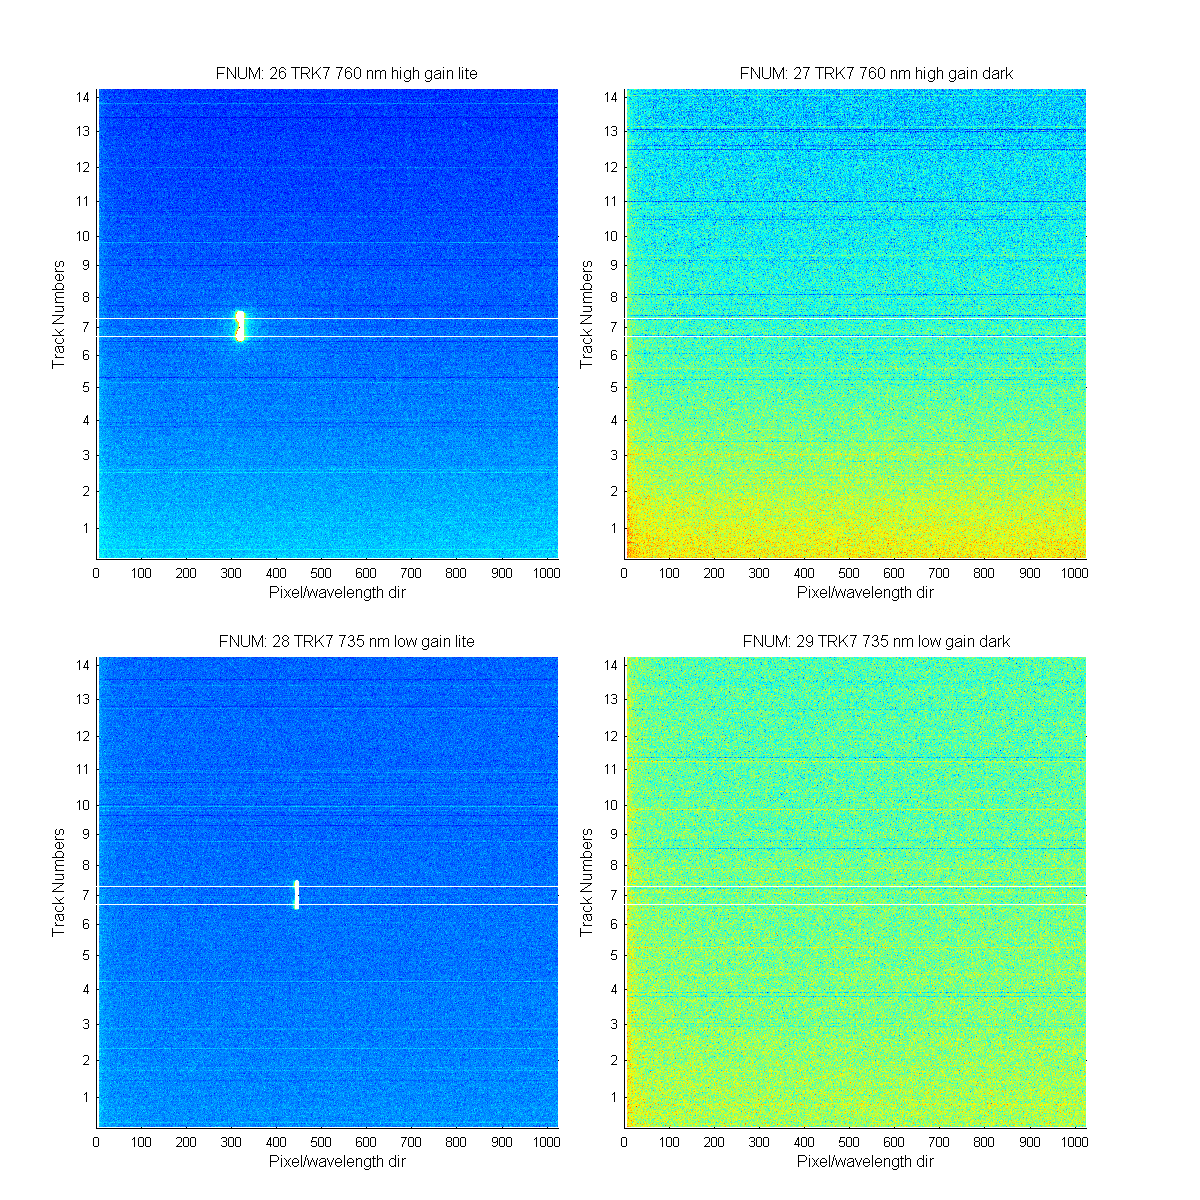
Figure 8
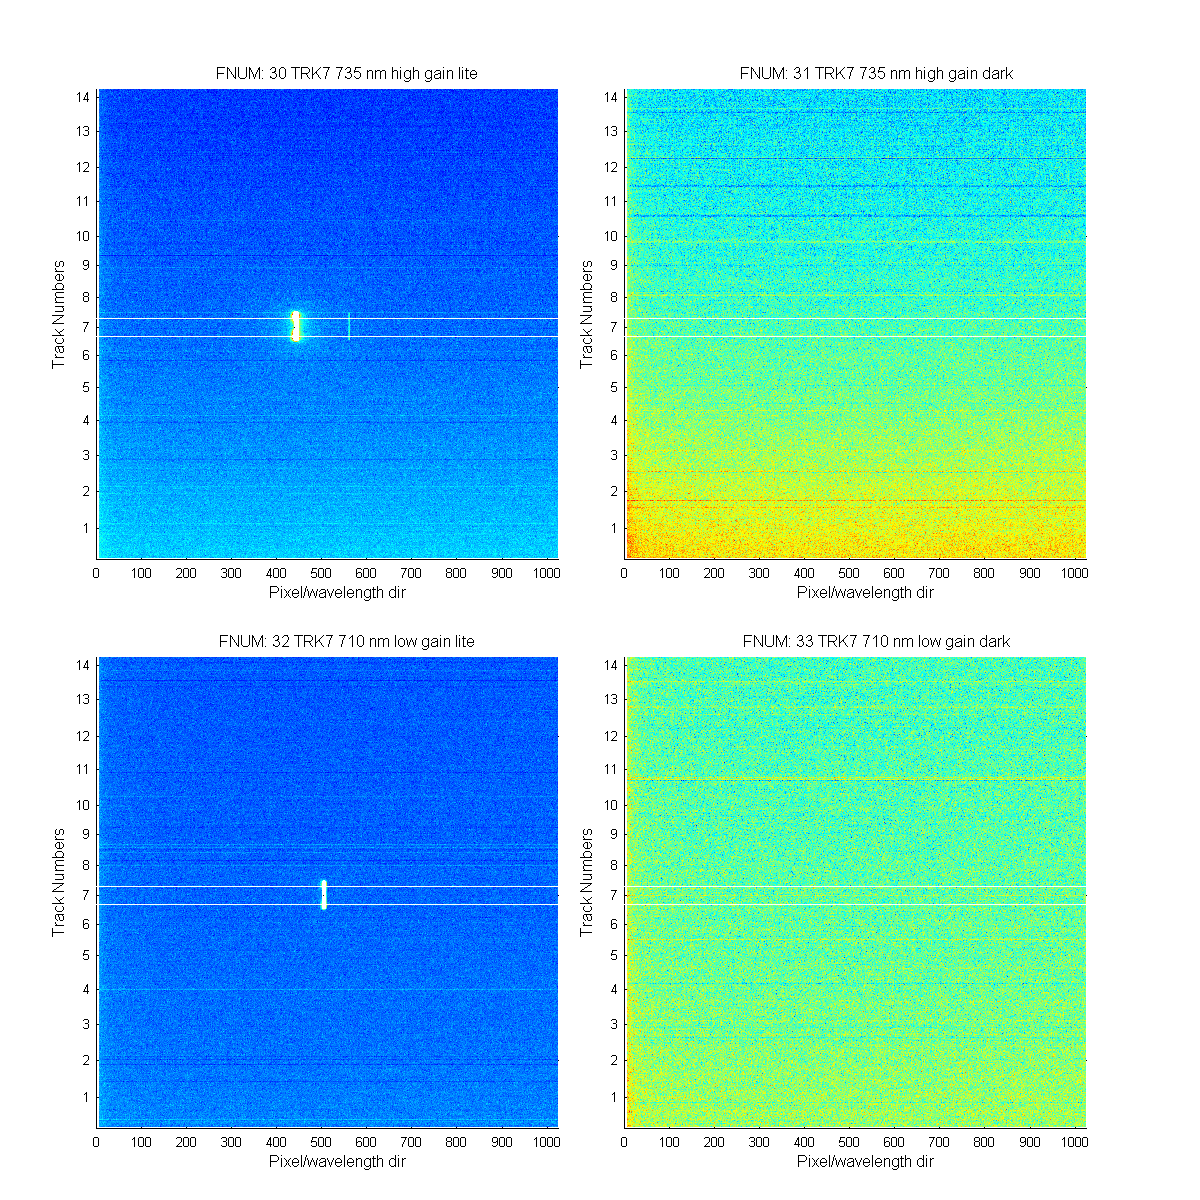
Figure 9
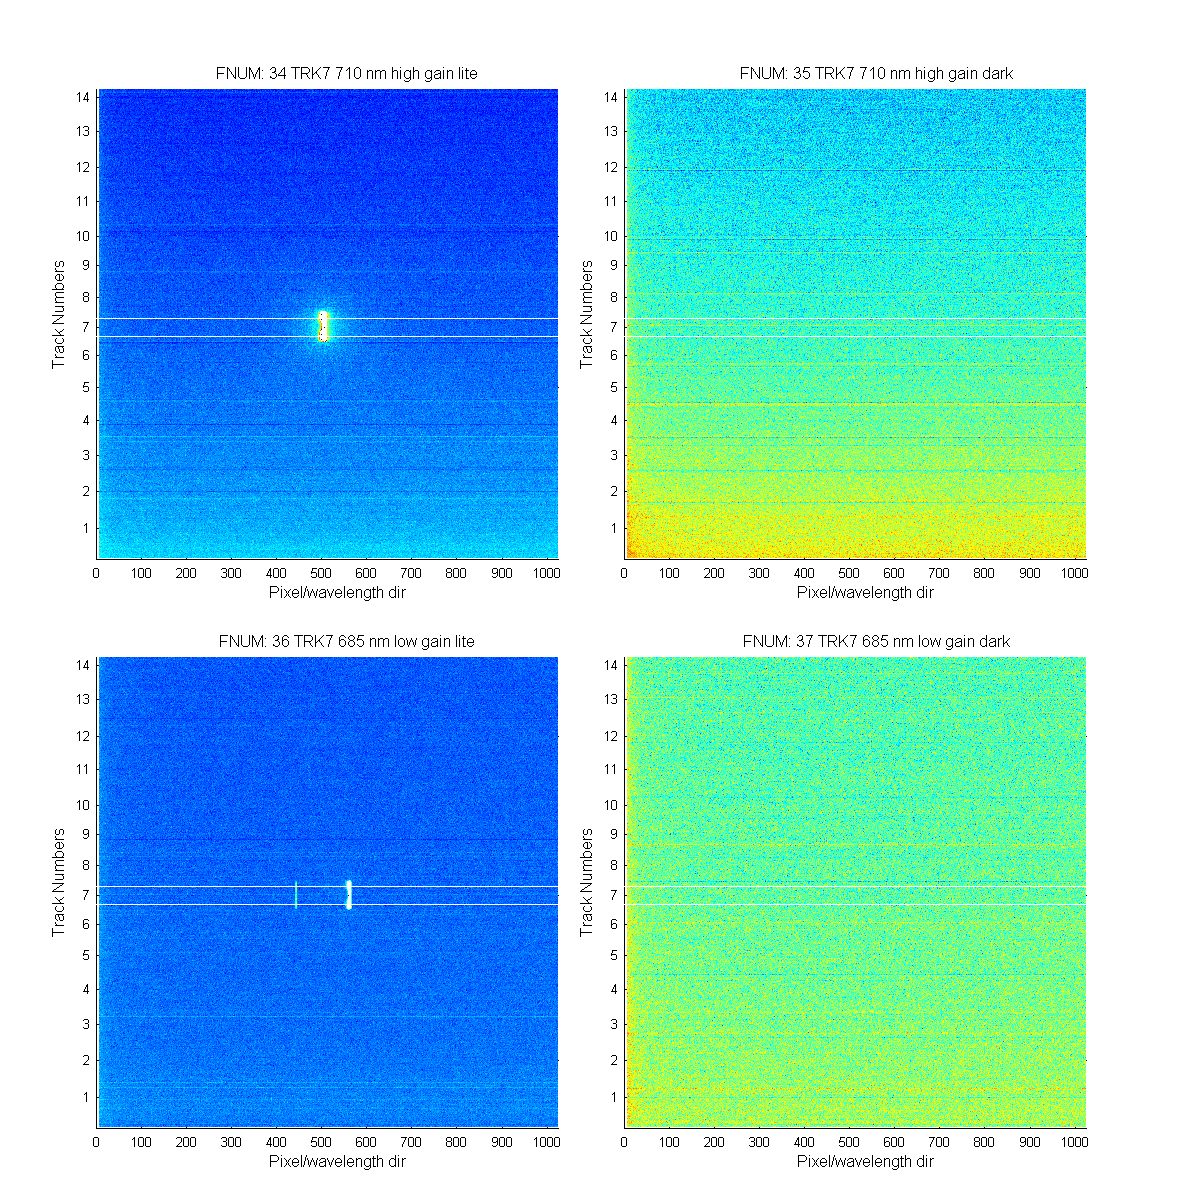
Figure 10
Figure 11
Figure 12
Figure 13
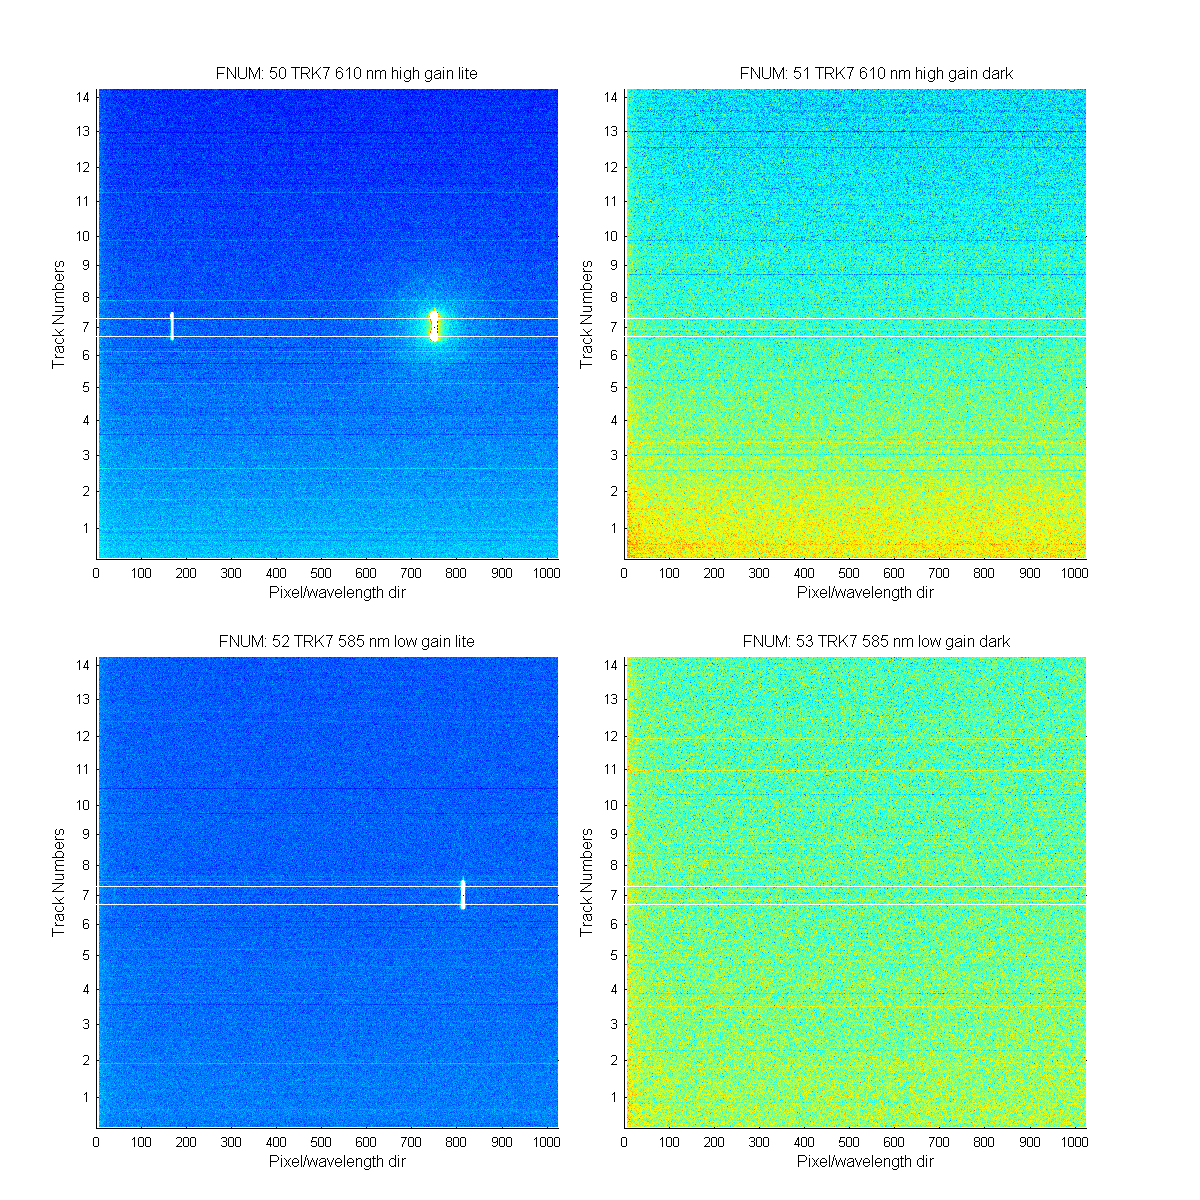
Figure 14
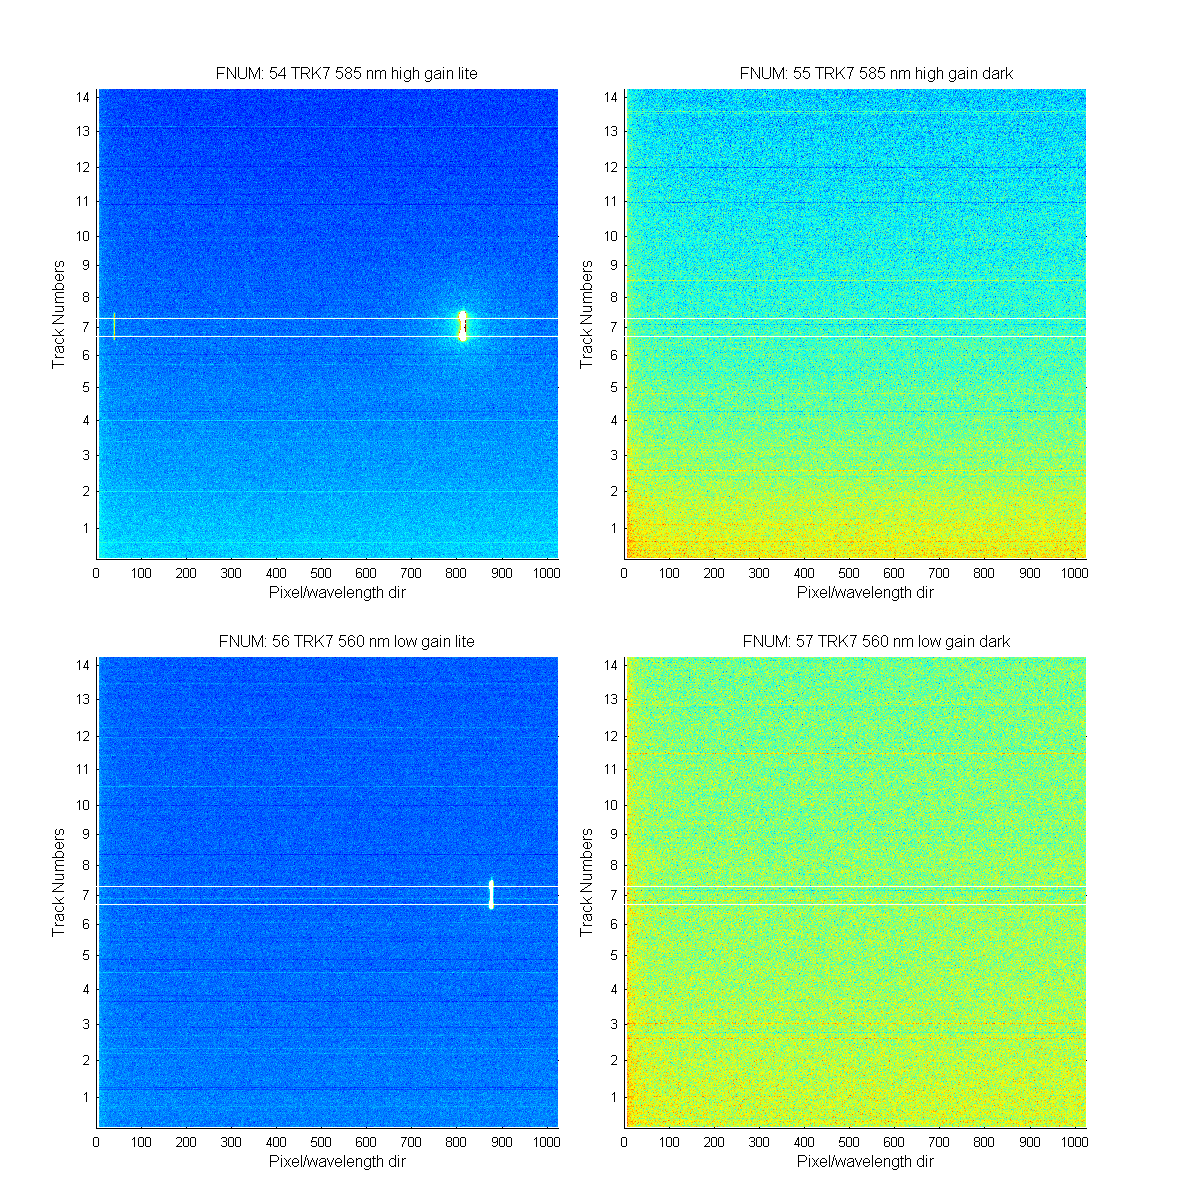
Figure 15
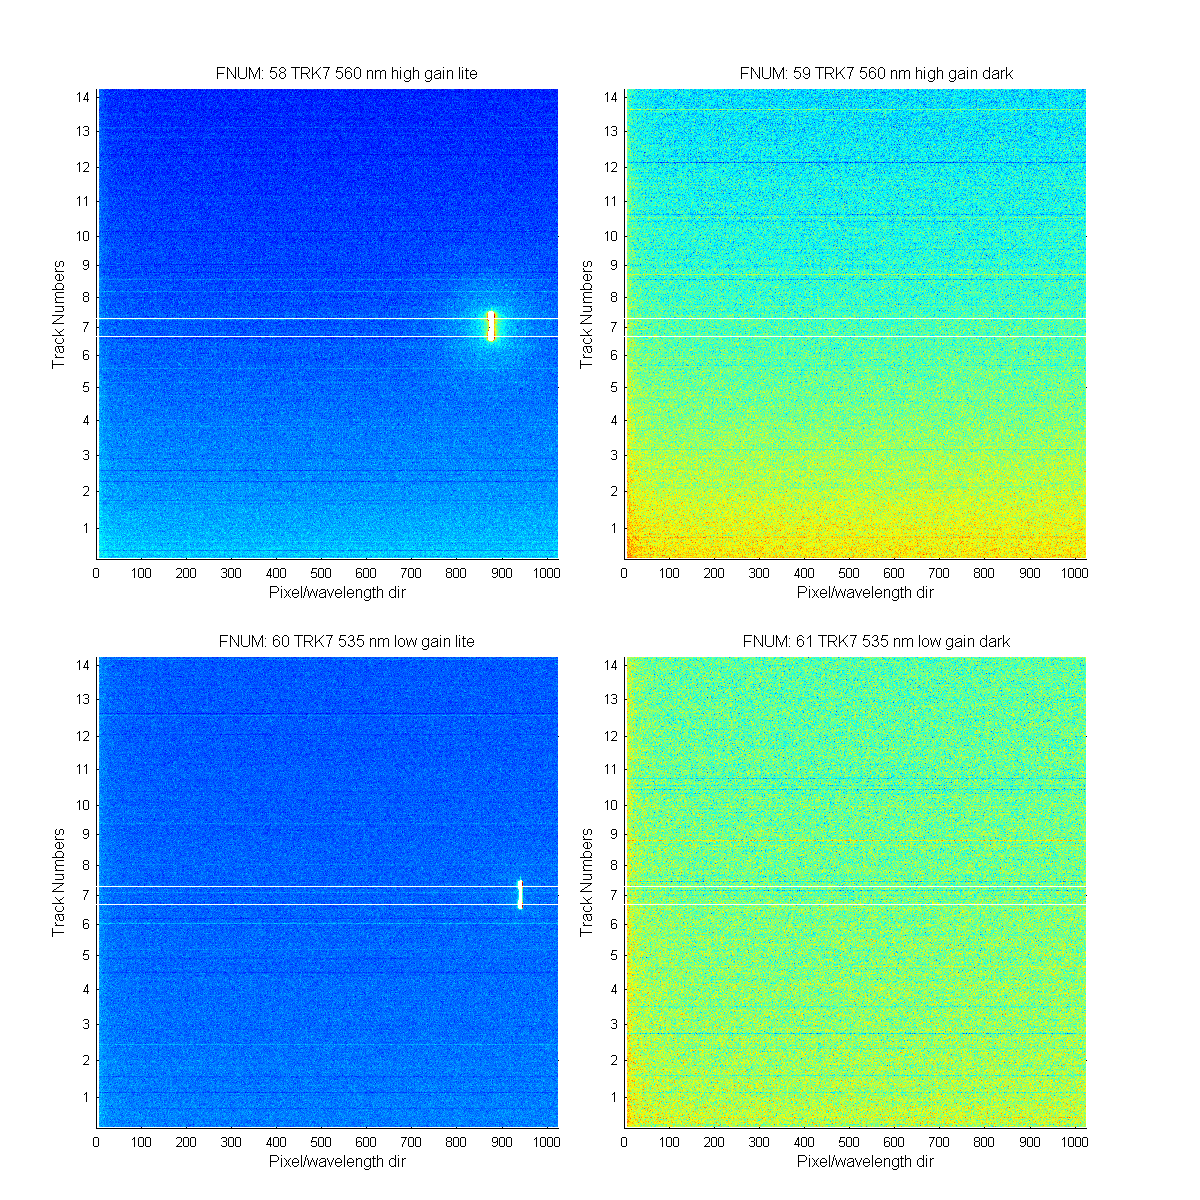
Figure 16
pwd: C:\zflora\mldata\MOBY2\NIST2010_01
Date: 18-Nov-2010 11:22:09
Created from alookatimages_(1)