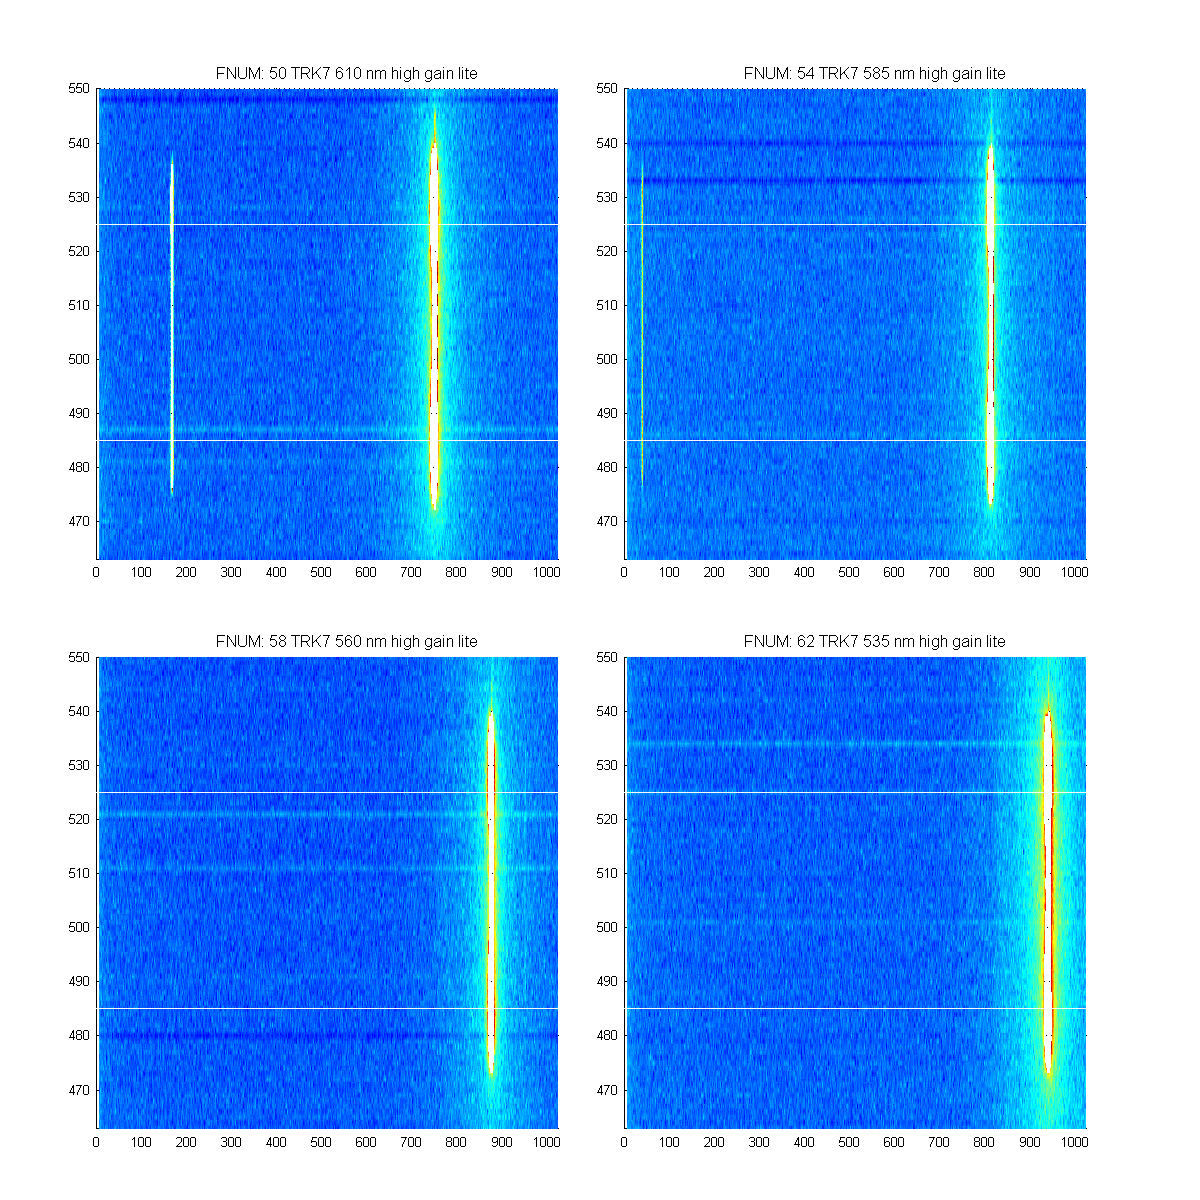
I wanted to zoom into track 7 to see the reflection peak better for the high gain laser data. So I created the following graphs. I loaded each SPE file, I then removed all values greater than 1000 ADU and logged the data. THe reflection peak is clearer now.. Only frame 2 was used and the below images are the only lite high gain images. Looks like the reflection peak is lined up in the track (yea). The white lines are the edges of what I define as track 7. The top of the image is the start of track 8 and the bottom of the image is the end of track 6.
One thing I have been noticing is all the "stripes" in the back ground and how they come and go. Not sure what these are. The are stright lite images (not dark subtrated) so they are introduced by the darks.
Figure 1
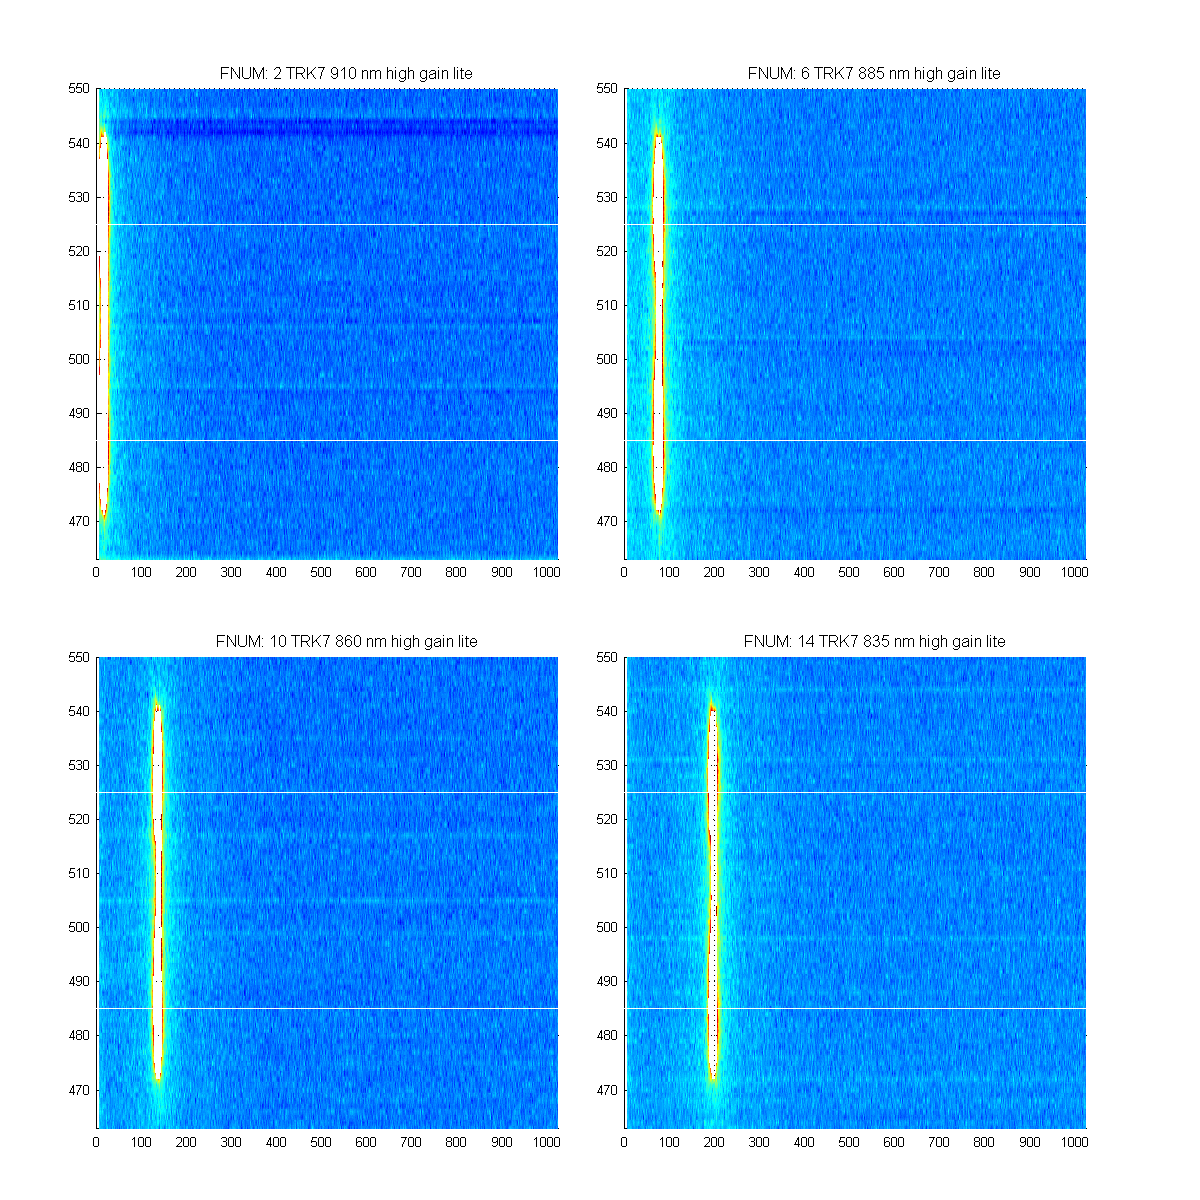
Figure 2
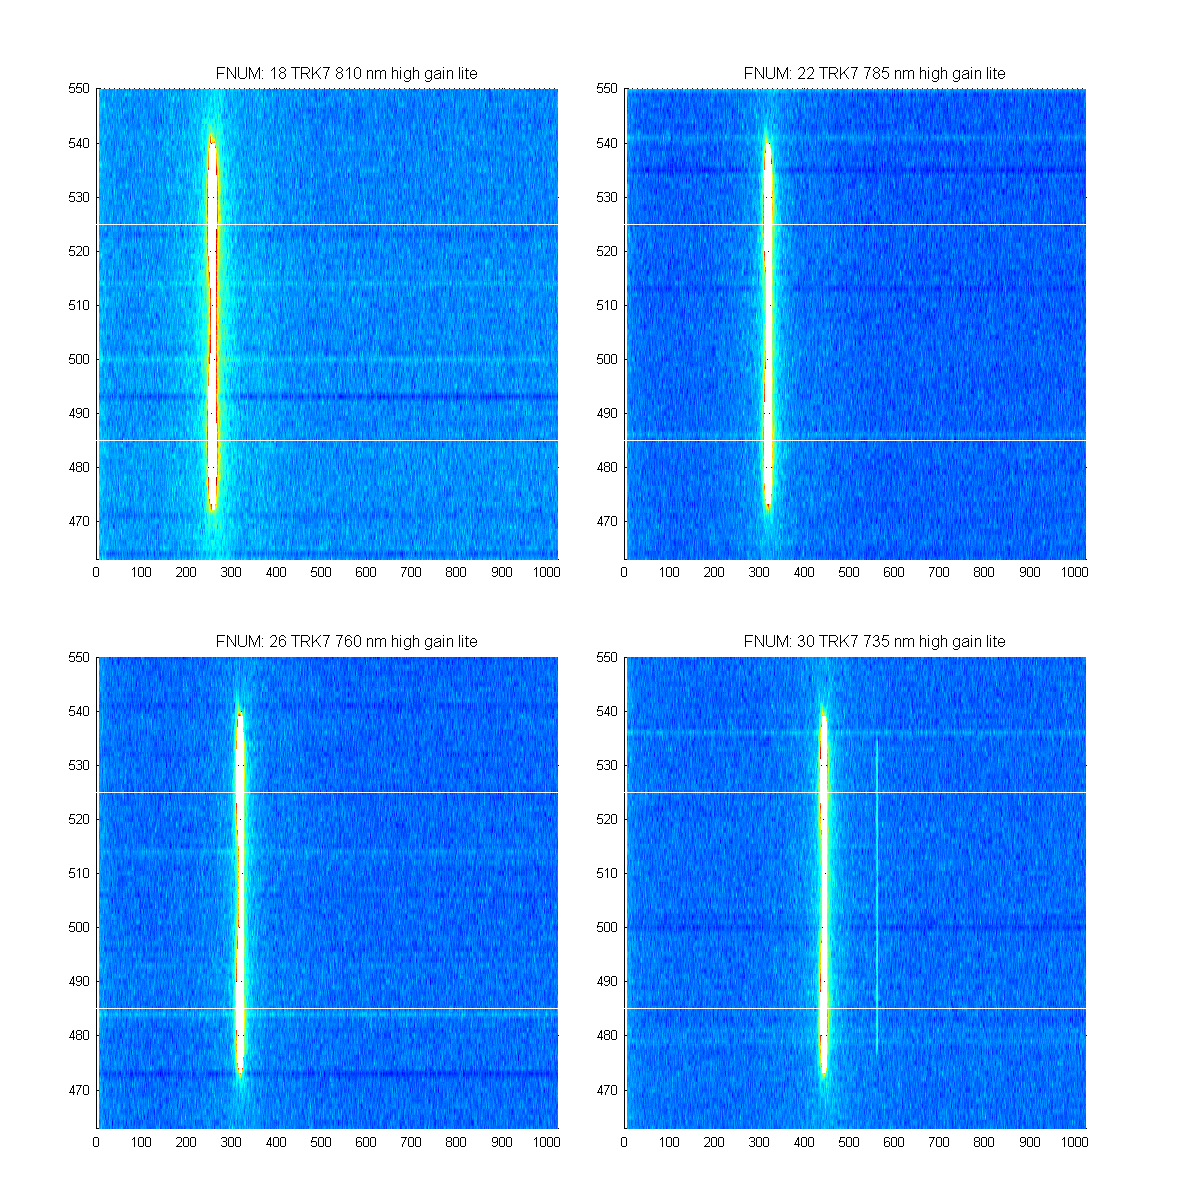
Figure 3
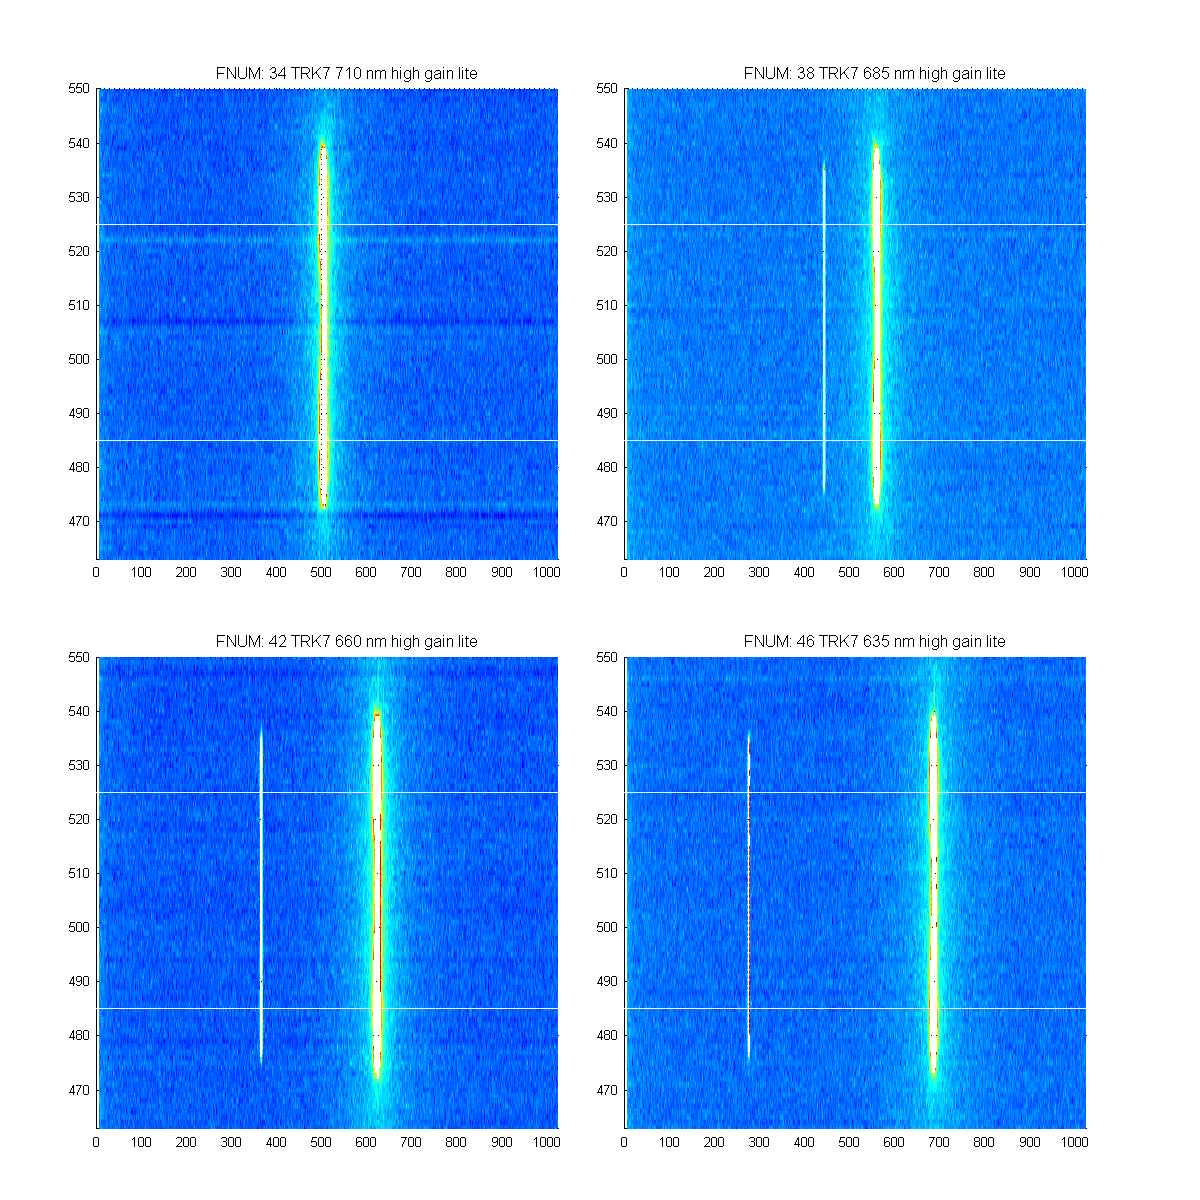
Figure 4