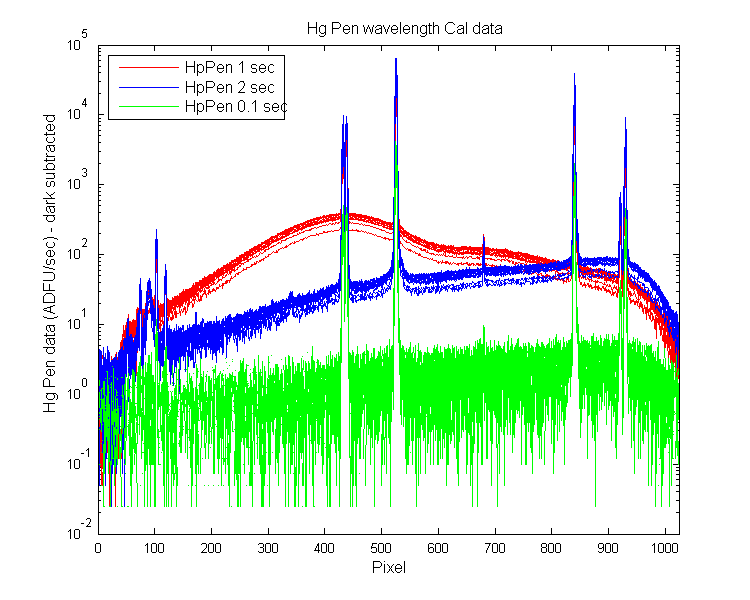
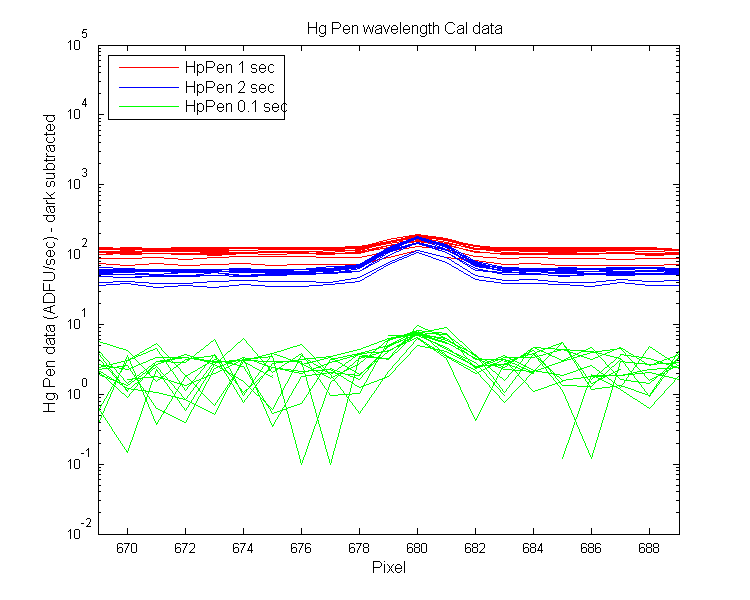
The HgPen lamp will give an intial rough wavecal. There were 4 HgPen lamp data sets collected at different wavelengths. The 10 sec data has no dark file so I do not show it. The other three are shown in the first graph. The 2 sec data set was used to find the the pixels in each track. All the tracks had the same pixels for each HgPen wavelength. I do not do Mikes gaussian fit to each peak, which would likely give slightly different pixels asignments to each track.
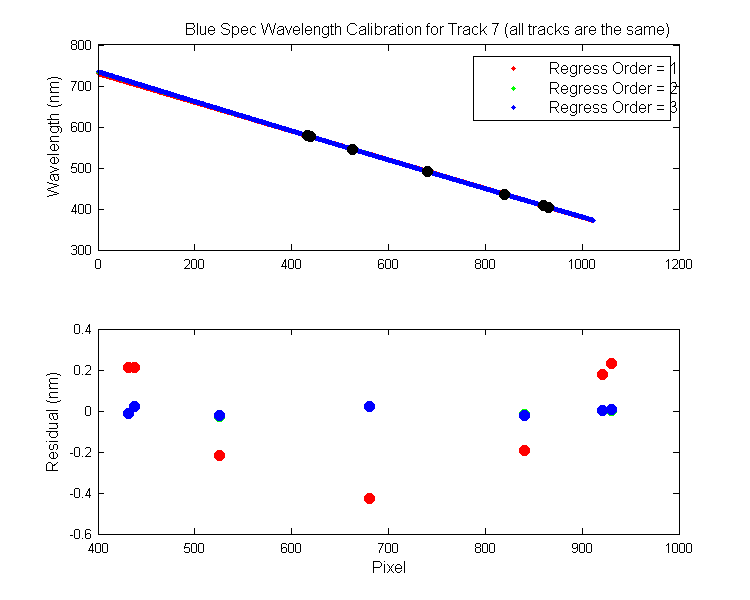
2nd order polynomial: [1.092718e-005 -0.3651134 734.8]
Pixels: [930 921 840 680 525 438 432]
Waves: [404.7 407.8 435.8 491.6 546.1 577 579.1]
Wavelength Min and Max: [372.3819 734.4349]
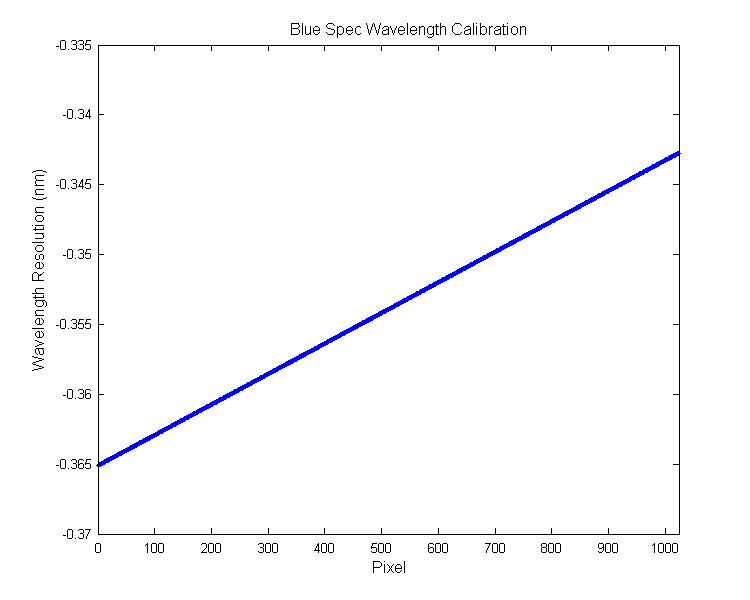
Resolution in nm: [-0.35391]
All three data sets. Why does the shape look so different for 1 sec??
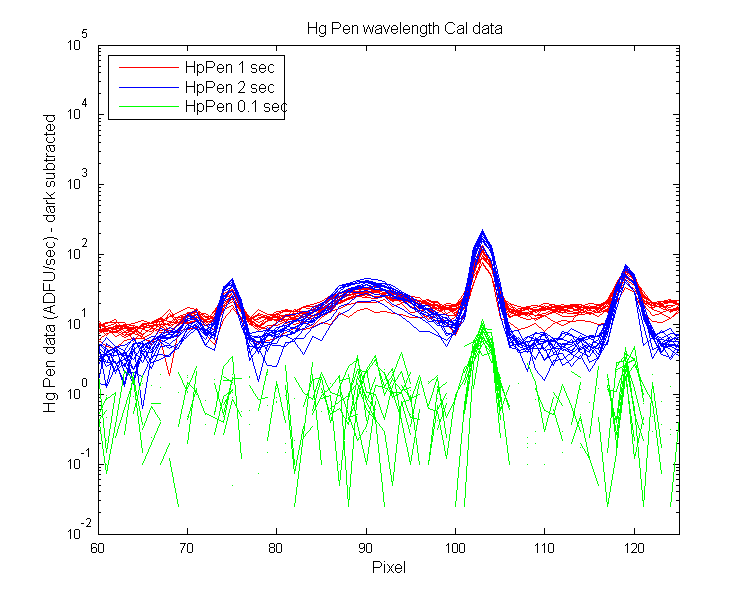
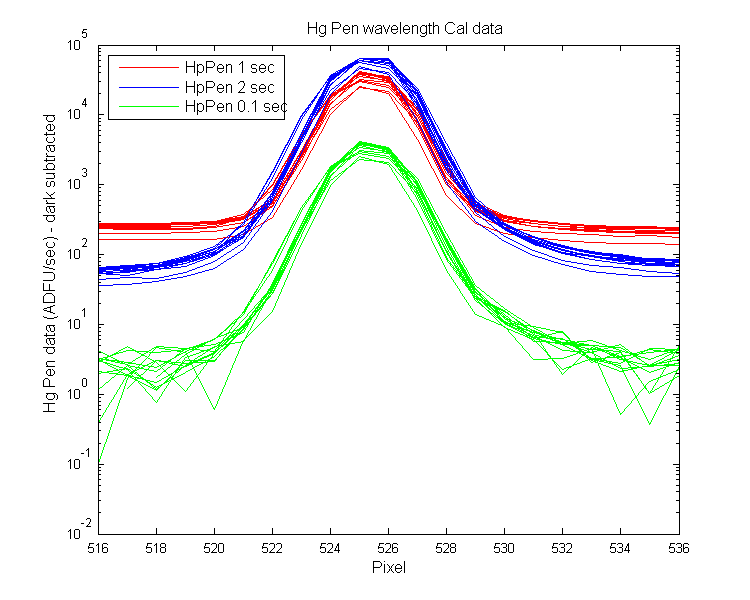
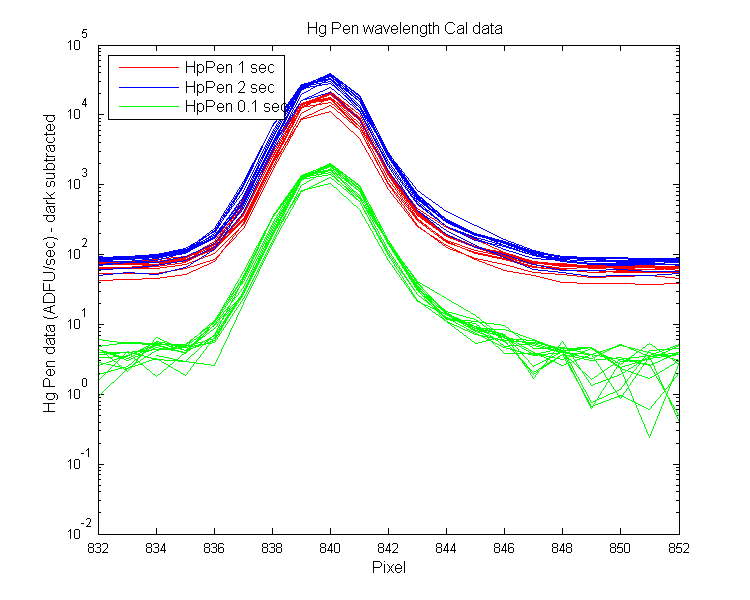
Zoomed in view of each peak

Wavelength regression
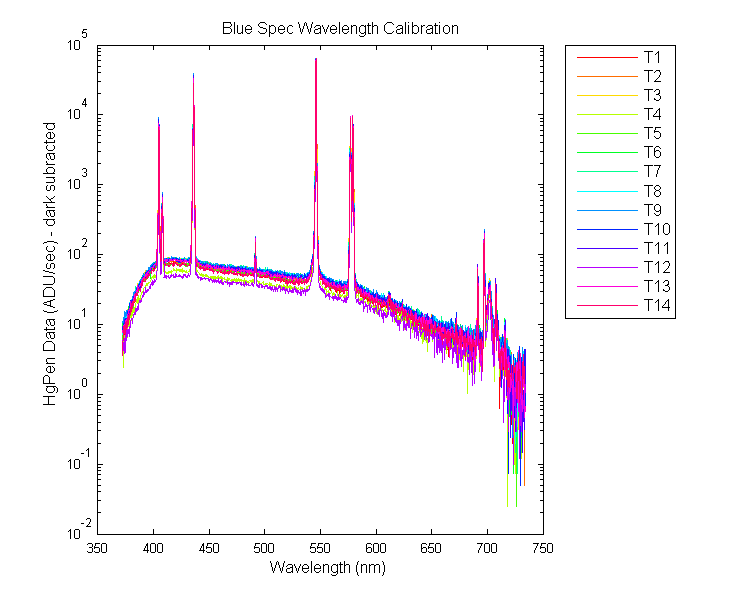
HgPen data verse Wavelength
Resolution Graph