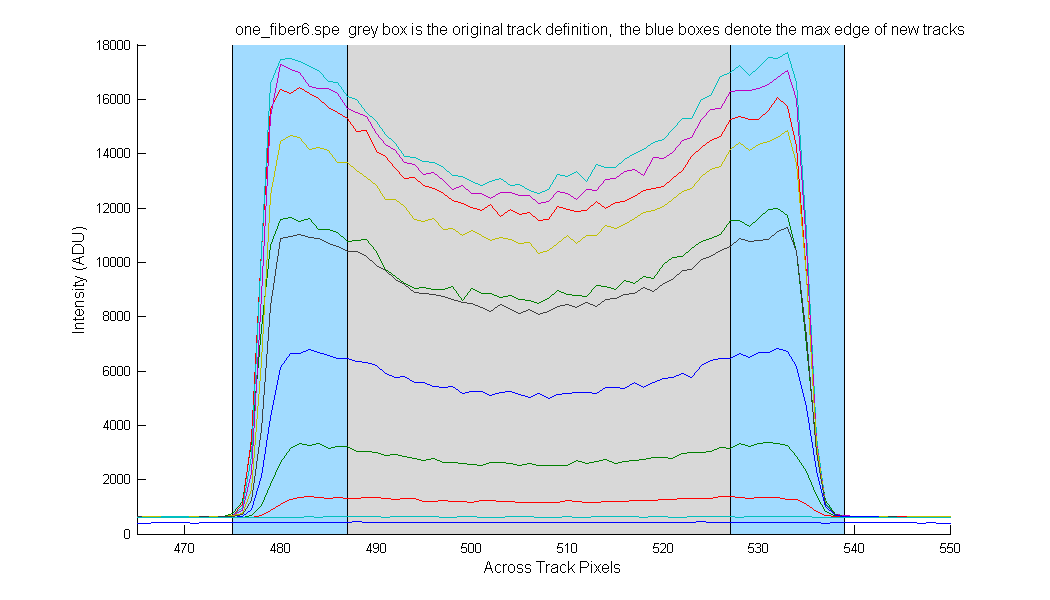
The following graphs try to show the effect of moving the pixels used to bin a track around. How much does the signal change depending on were you defined the track. In this page the track width was not changed on the center pixel. All the tracks were 41 pixels wide. The center of the track was varied by plus or minus 12 pixels. This means that in the extreme cases the tracks were in the dark area between the tracks. Note that all the graphs are for track 7 were there is very little keystoning. I should repeat this for track 1 or 2.
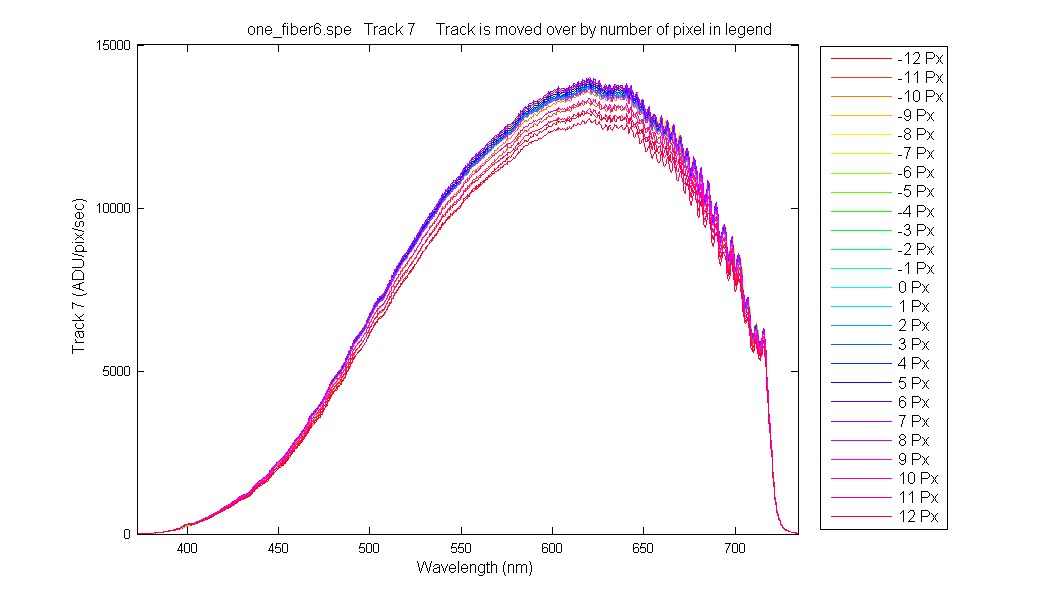
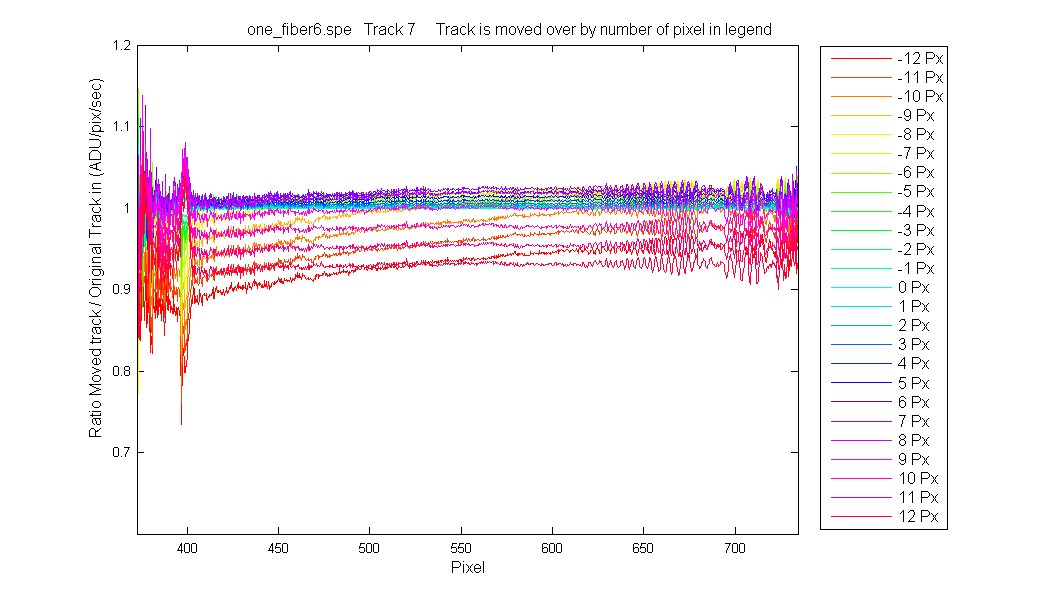
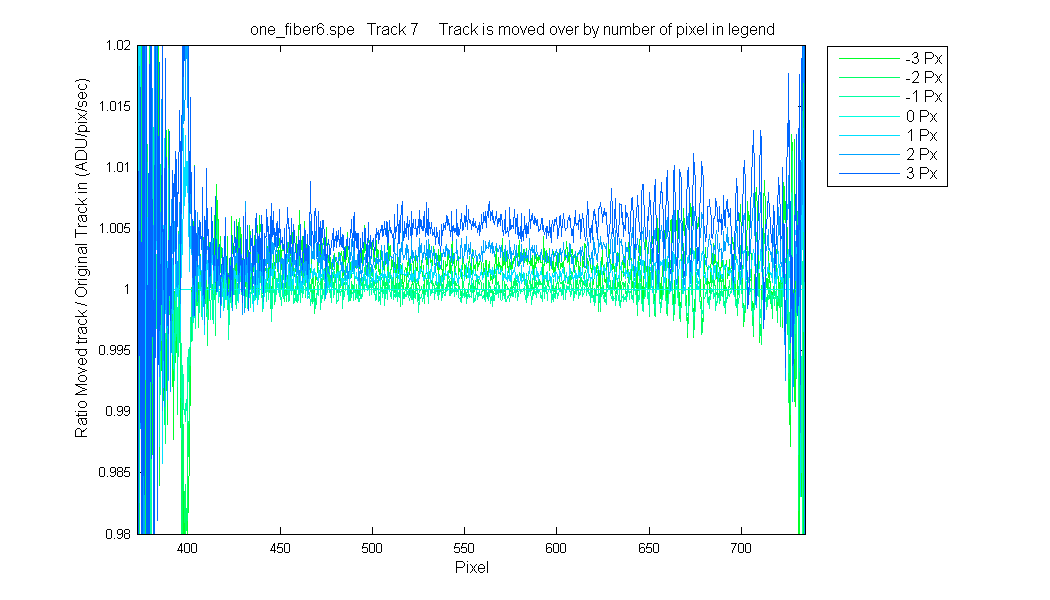
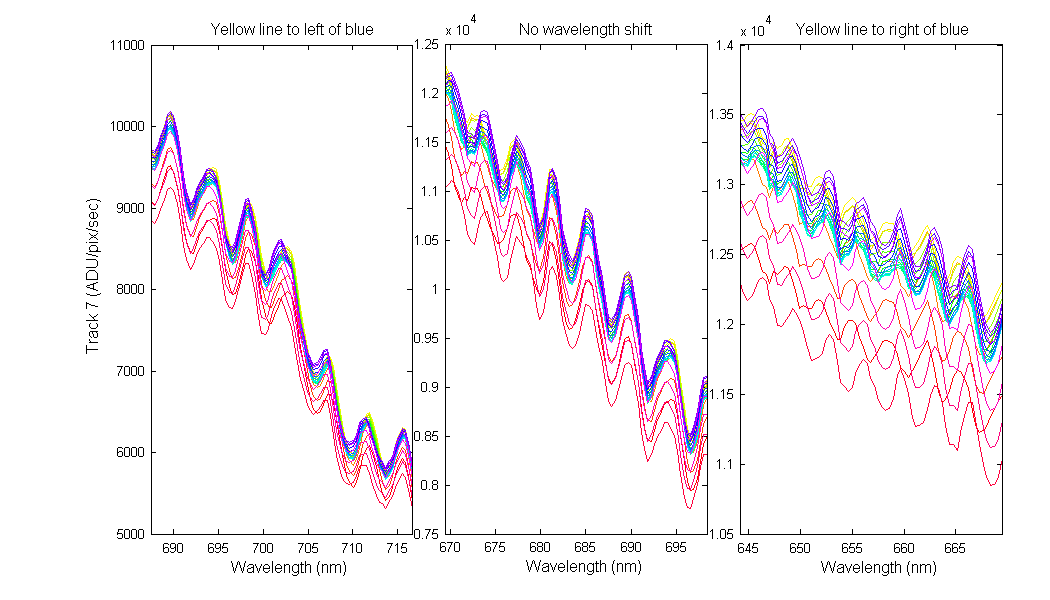
The first four graphs show the problem in ADU/pix/sec. The variability is pretty high. Also notice on the fourth graph I have zoomed in to sections so you can see there some small wavelength shifting going on from one side of the saddle to the other.
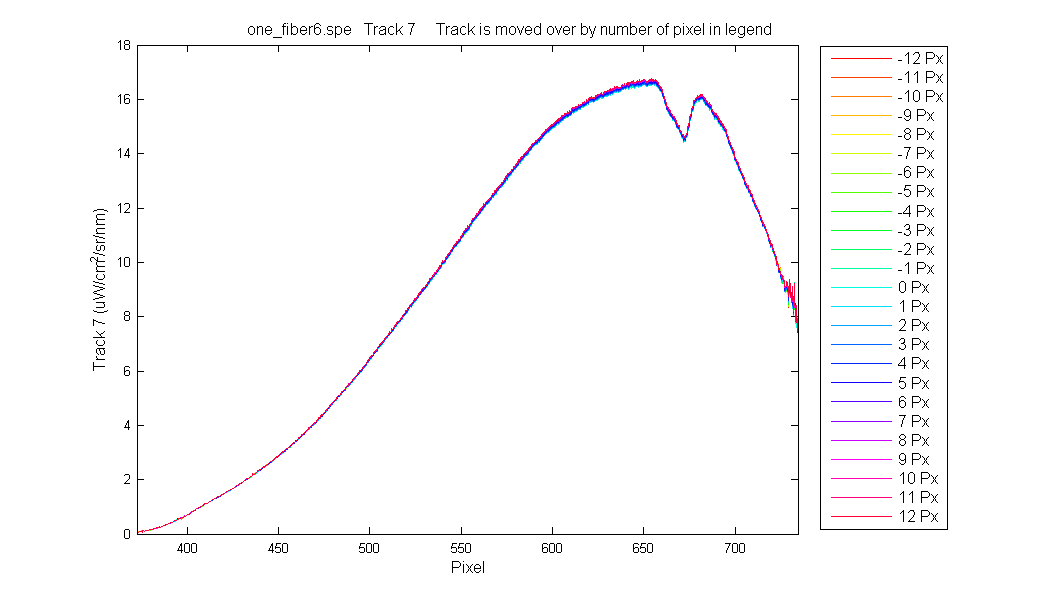
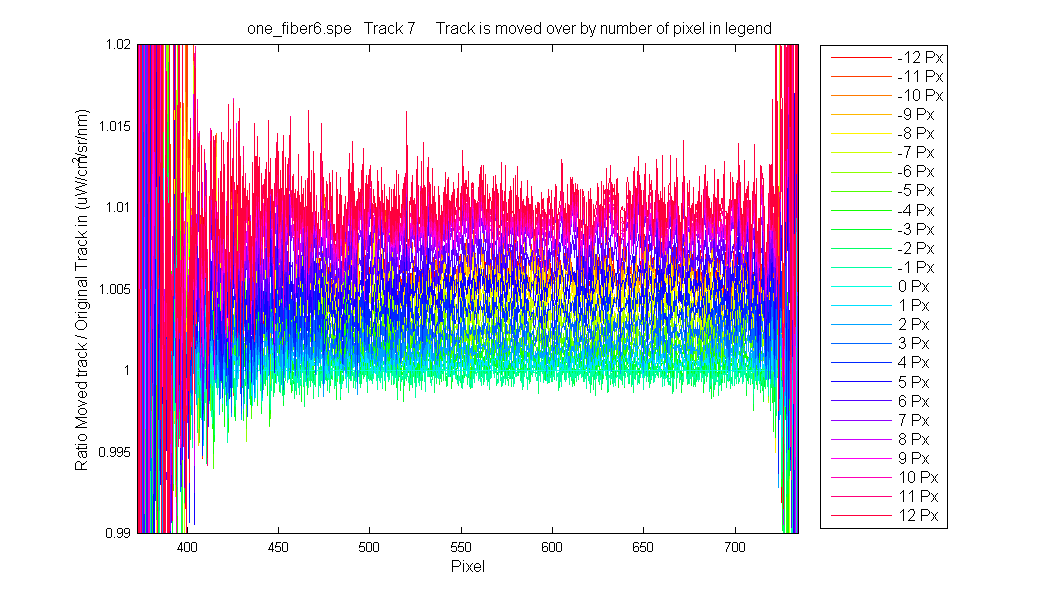
I then show the same graphs with a system response applied. I created a system responce for each shifted track so that the system response was created with the same track definition as the data. Much of the variability is gone once the system response if applied.
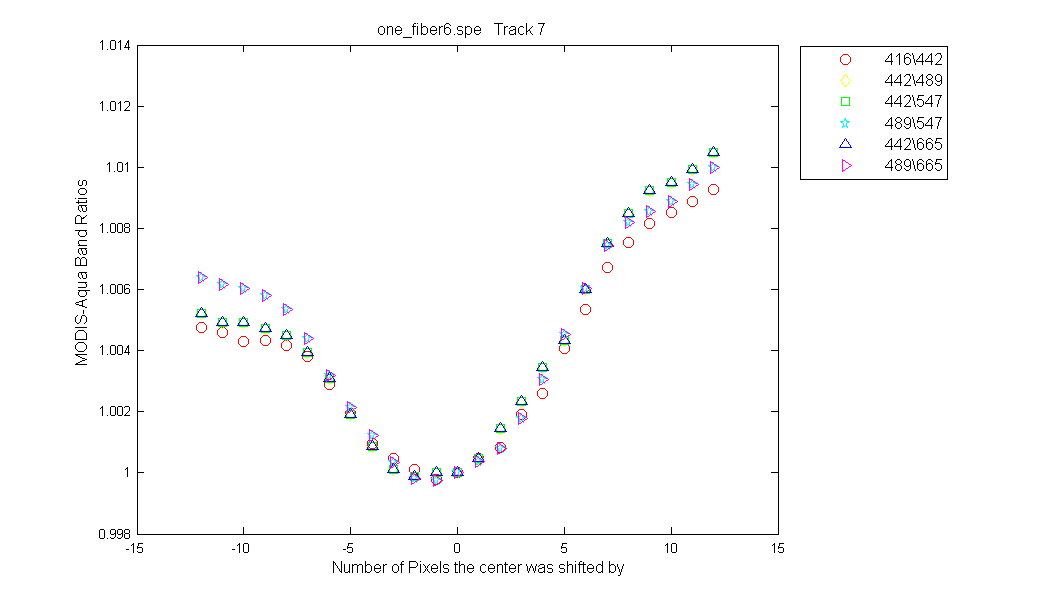
Al Parr asked what the effects would be in satellite ratios so I did graphs of that too. The last graph show the change in satellite ratios for MODIS-Aqua. The number of pixels the track was shifted is the x-axis.