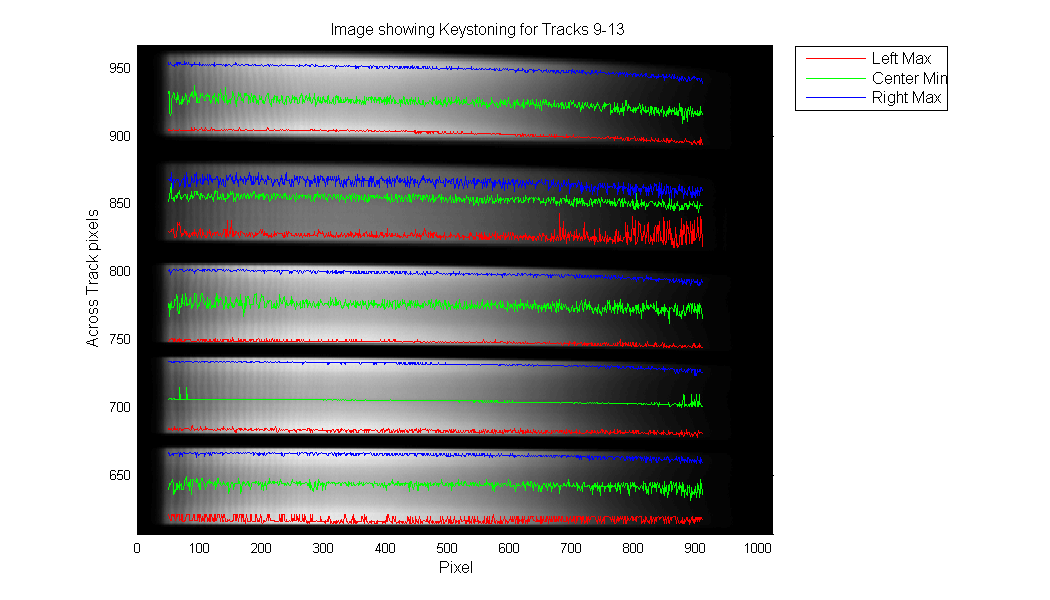
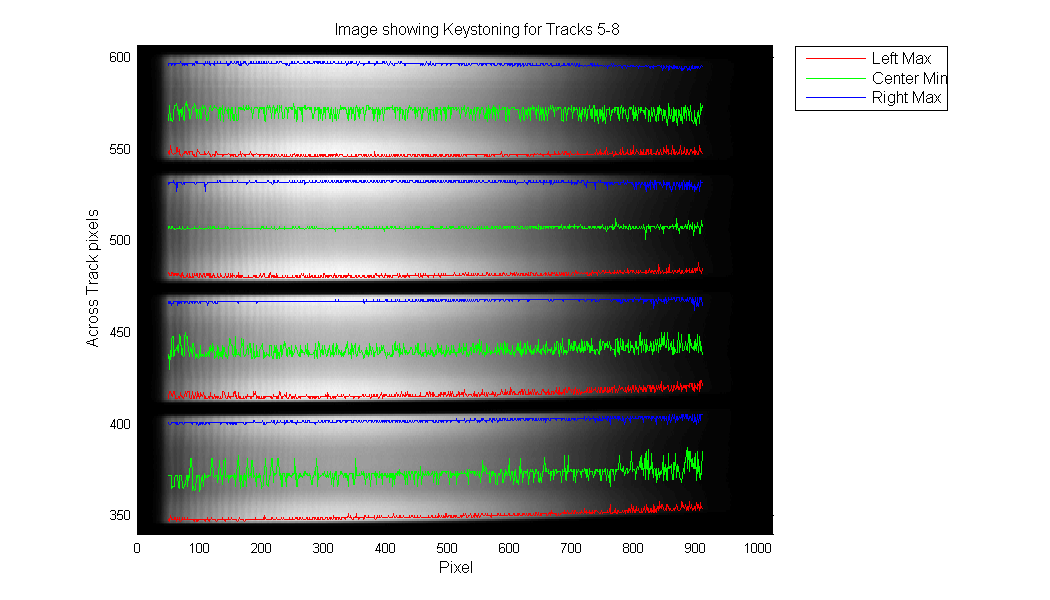
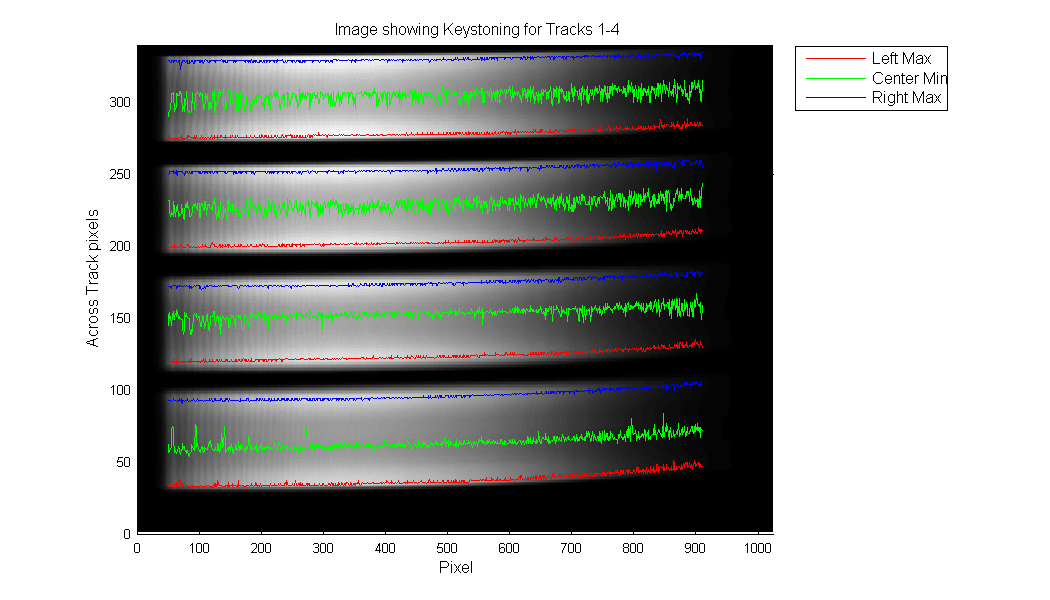
I used all_14_white_light16.SPE to create the black and white image and then found the min in center and max on edges. Enjoy
| Mean of Pixels 50-100 | Mean of Pixels 860-910 | Differnce | |||||||
|---|---|---|---|---|---|---|---|---|---|
| Track | Left Max | Center Min | Right Max | Left Max | Center Min | Right Max | Left Max - diff | Center Min - diff | Right Max - diff |
| 1 | 34 | 60 | 93 | 47 | 71 | 104 | 14 | 11 | 11 |
| 2 | 120 | 149 | 172 | 131 | 158 | 181 | 12 | 9 | 8 |
| 3 | 200 | 226 | 252 | 210 | 234 | 258 | 10 | 8 | 7 |
| 4 | 276 | 301 | 328 | 284 | 309 | 333 | 9 | 8 | 5 |
| 5 | 348 | 370 | 401 | 355 | 377 | 404 | 6 | 7 | 3 |
| 6 | 416 | 441 | 467 | 421 | 442 | 468 | 5 | 1 | 1 |
| 7 | 481 | 507 | 532 | 484 | 508 | 530 | 3 | 1 | -1 |
| 8 | 548 | 571 | 597 | 549 | 569 | 595 | 1 | -2 | -2 |
| 9 | 619 | 643 | 666 | 618 | 640 | 662 | -1 | -3 | -5 |
| 10 | 684 | 706 | 734 | 681 | 703 | 727 | -3 | -4 | -6 |
| 11 | 750 | 777 | 801 | 745 | 772 | 793 | -4 | -5 | -8 |
| 12 | 829 | 856 | 867 | 827 | 849 | 859 | -2 | -7 | -8 |
| 13 | 904 | 928 | 953 | 896 | 917 | 942 | -9 | -10 | -11 |