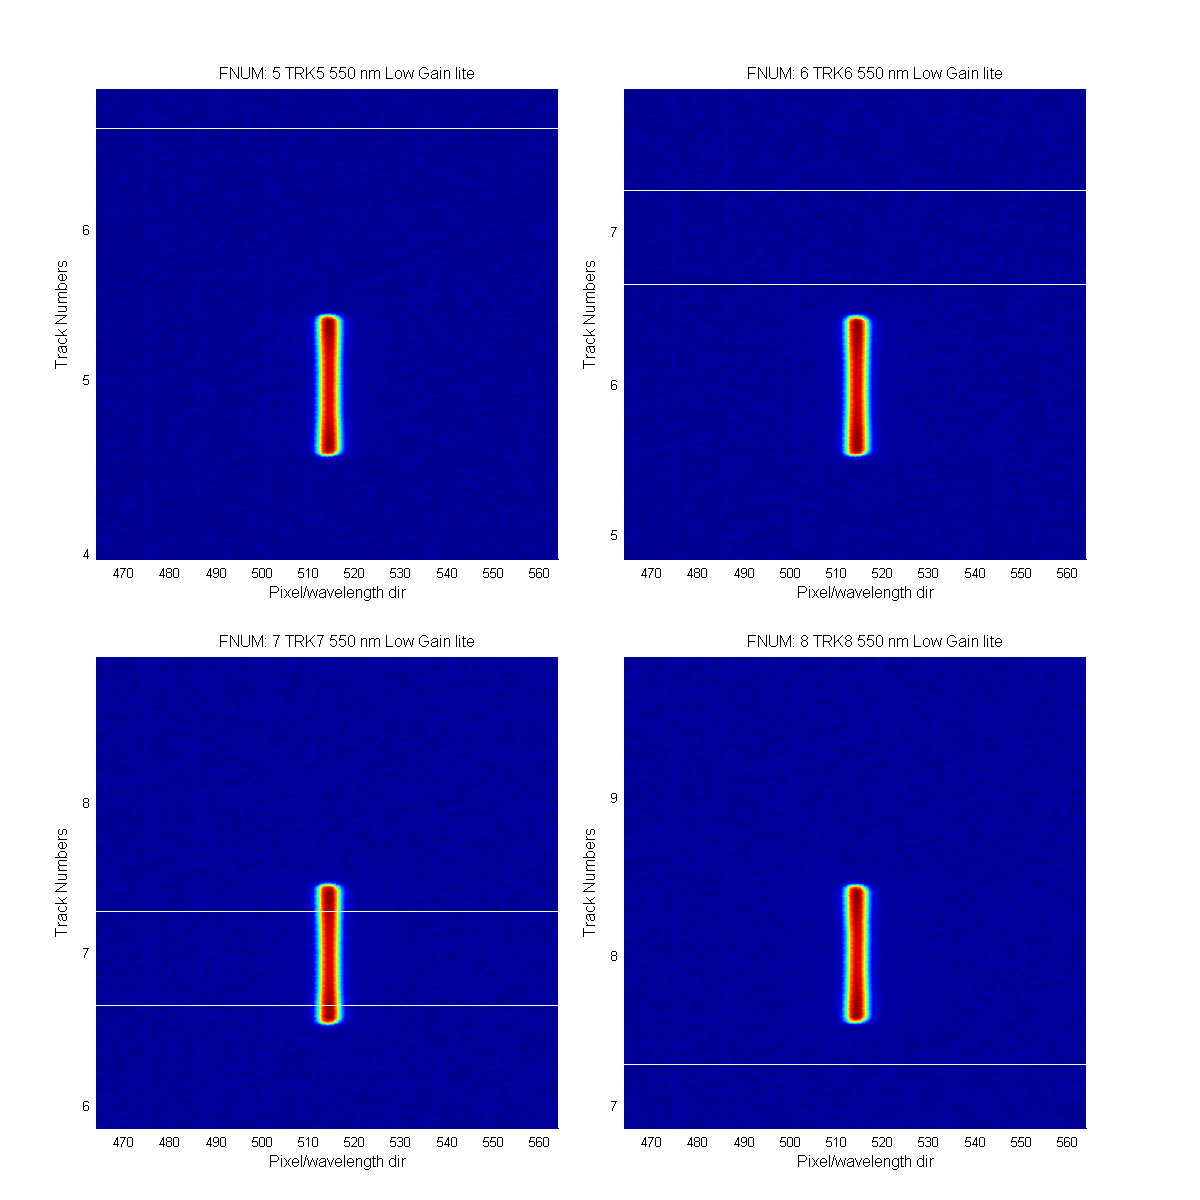
I wanted to look at all the SPE file images for the cross and along track features. So I created the following graphs. I loaded each SPE file, I then removed all values greater than 50000 ADU and logged the data. This way we can see the cross track and stray light better. Only frame 1 was used and the below images are the lite lser data images. Notice the high gain files have too much bleeding to use for cross track studies.
Figure 1
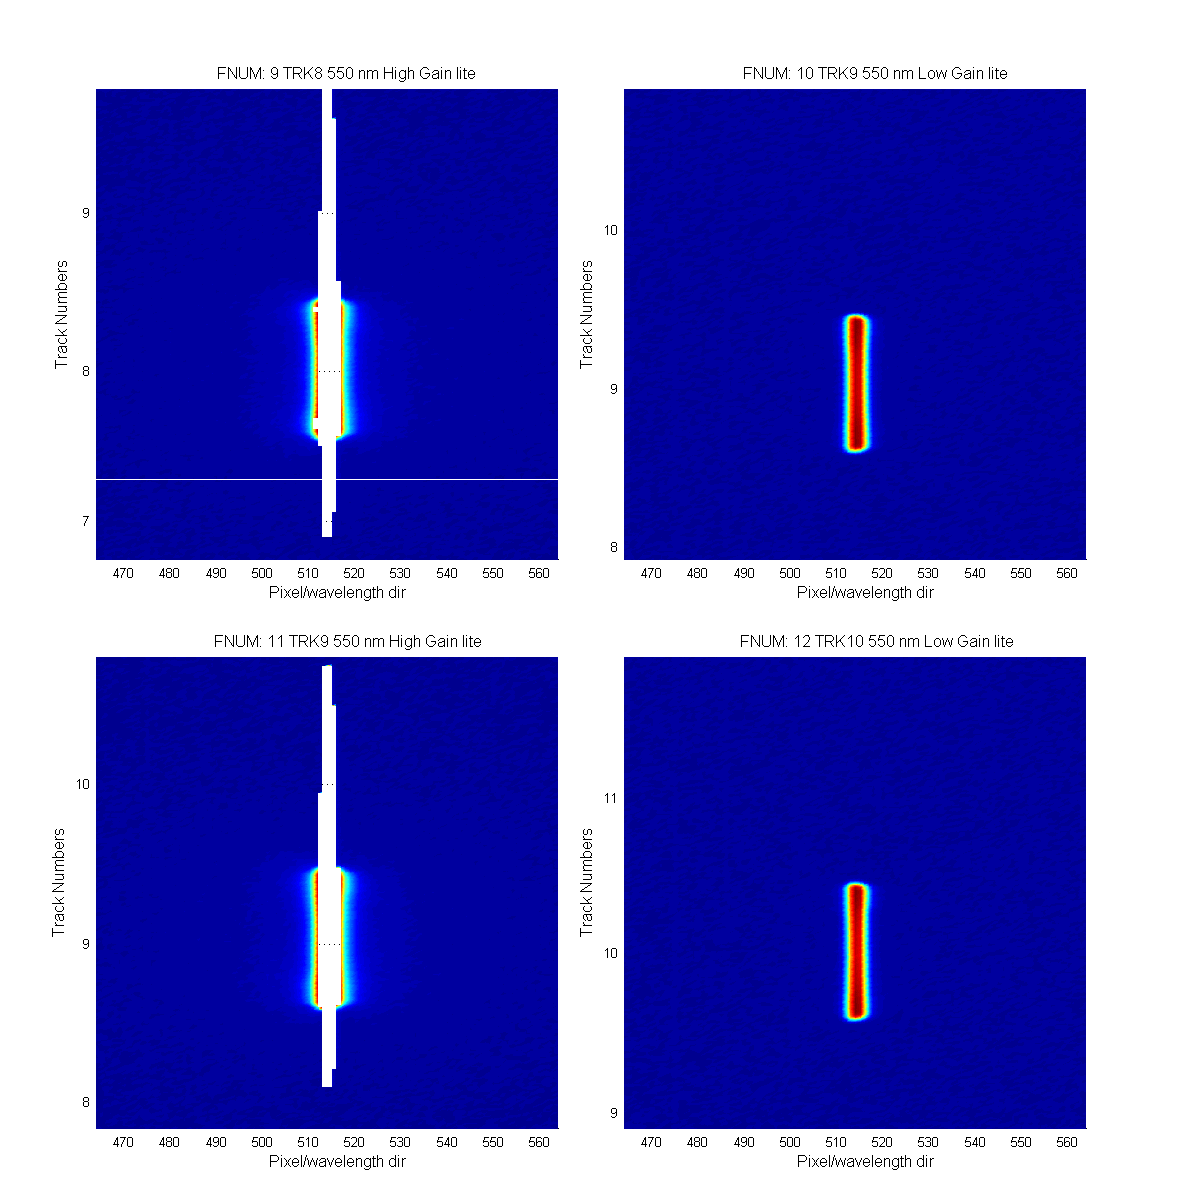
Figure 2
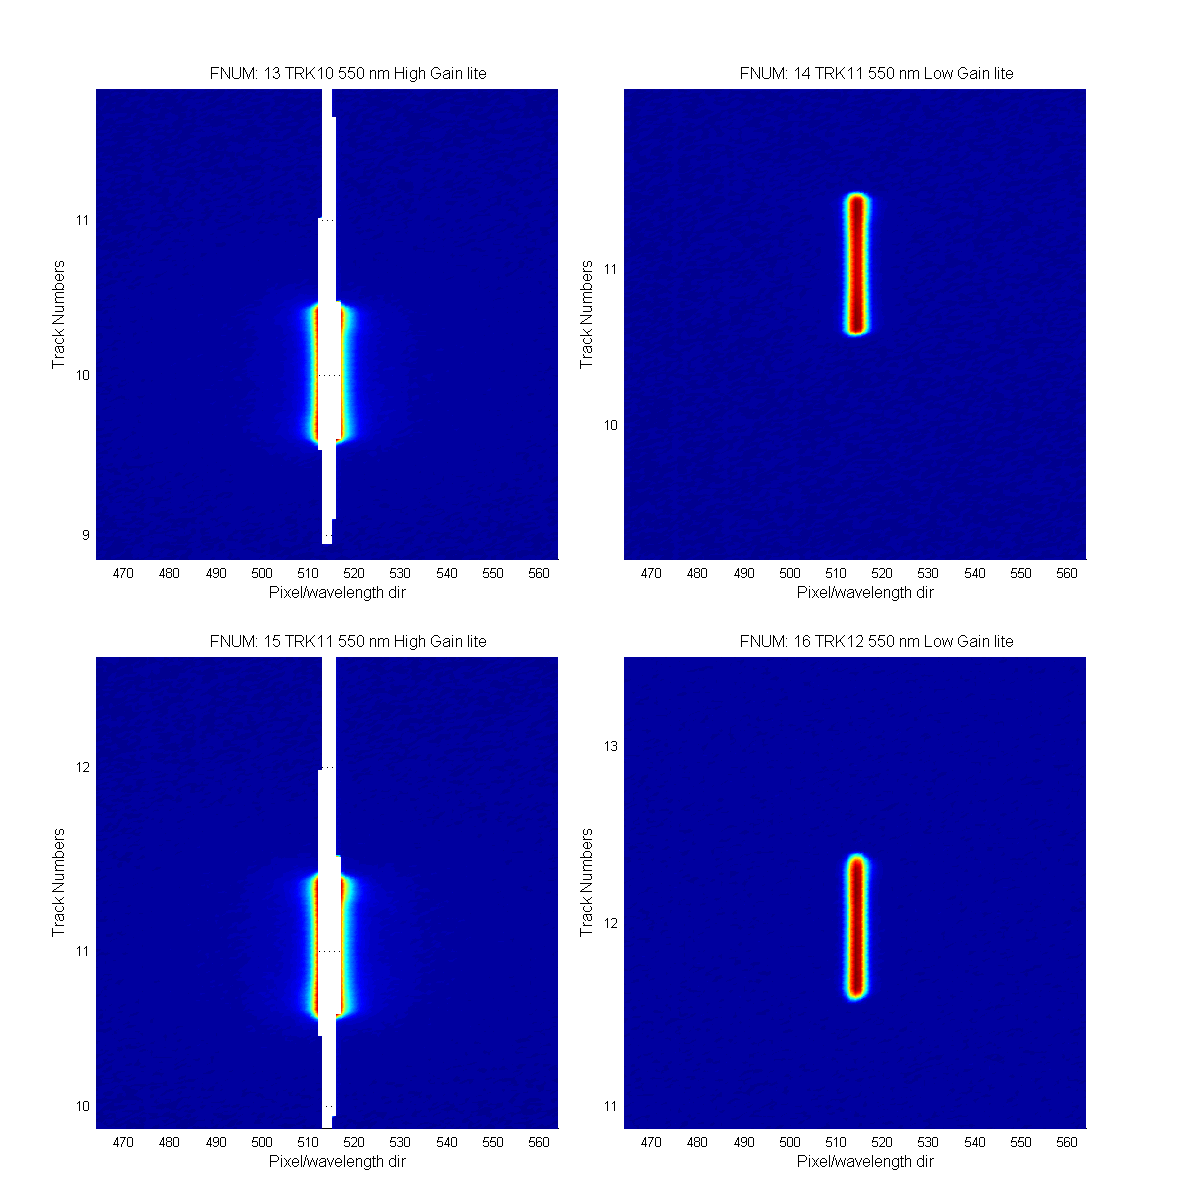
Figure 3
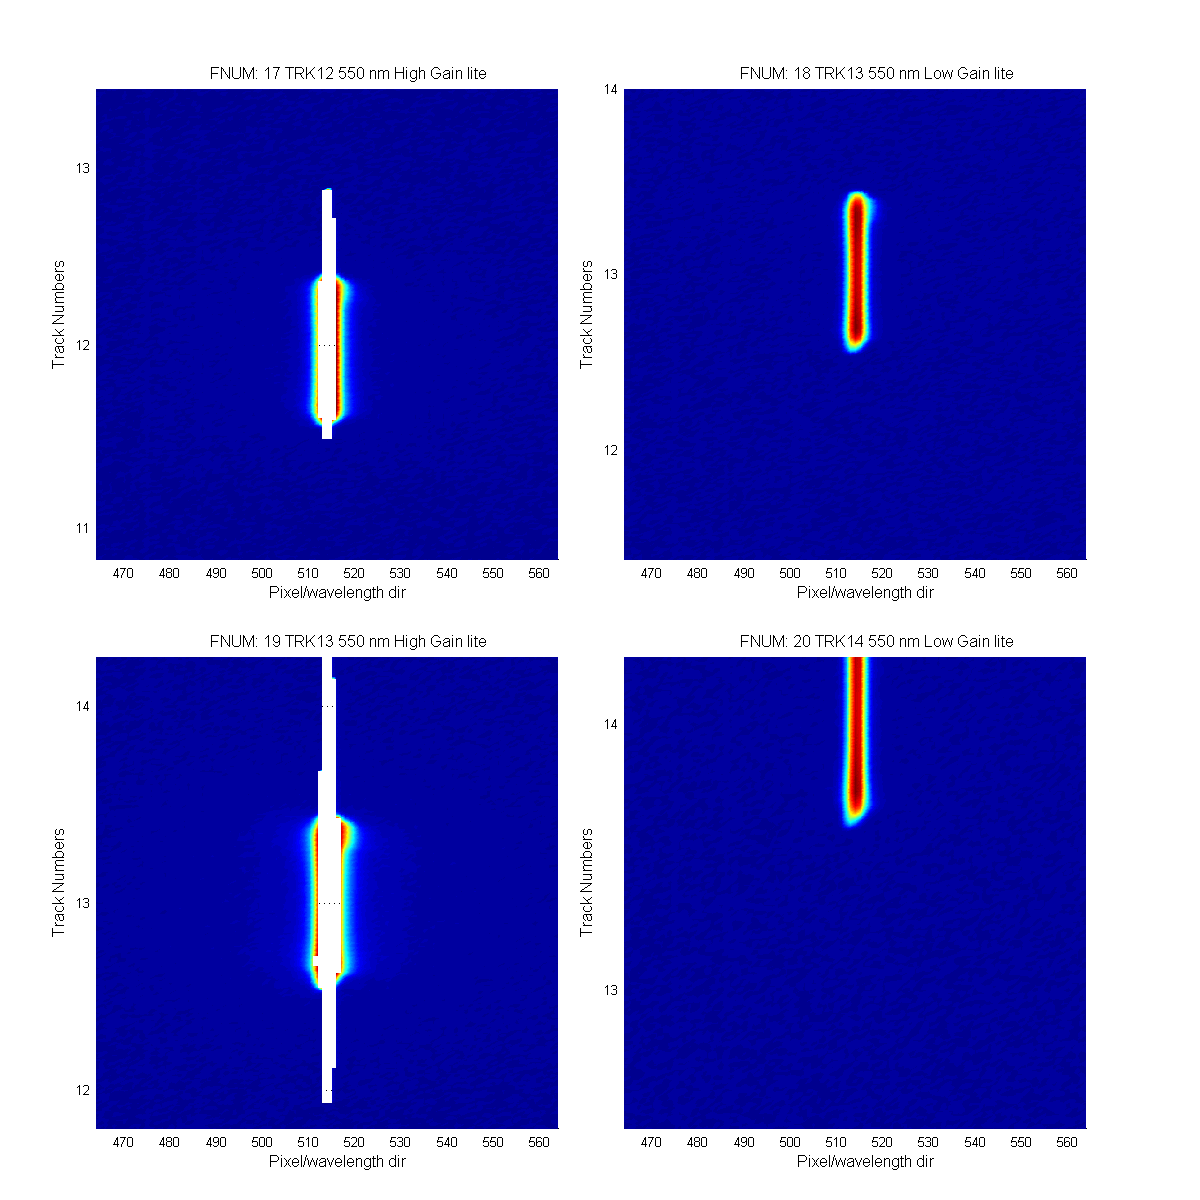
Figure 4
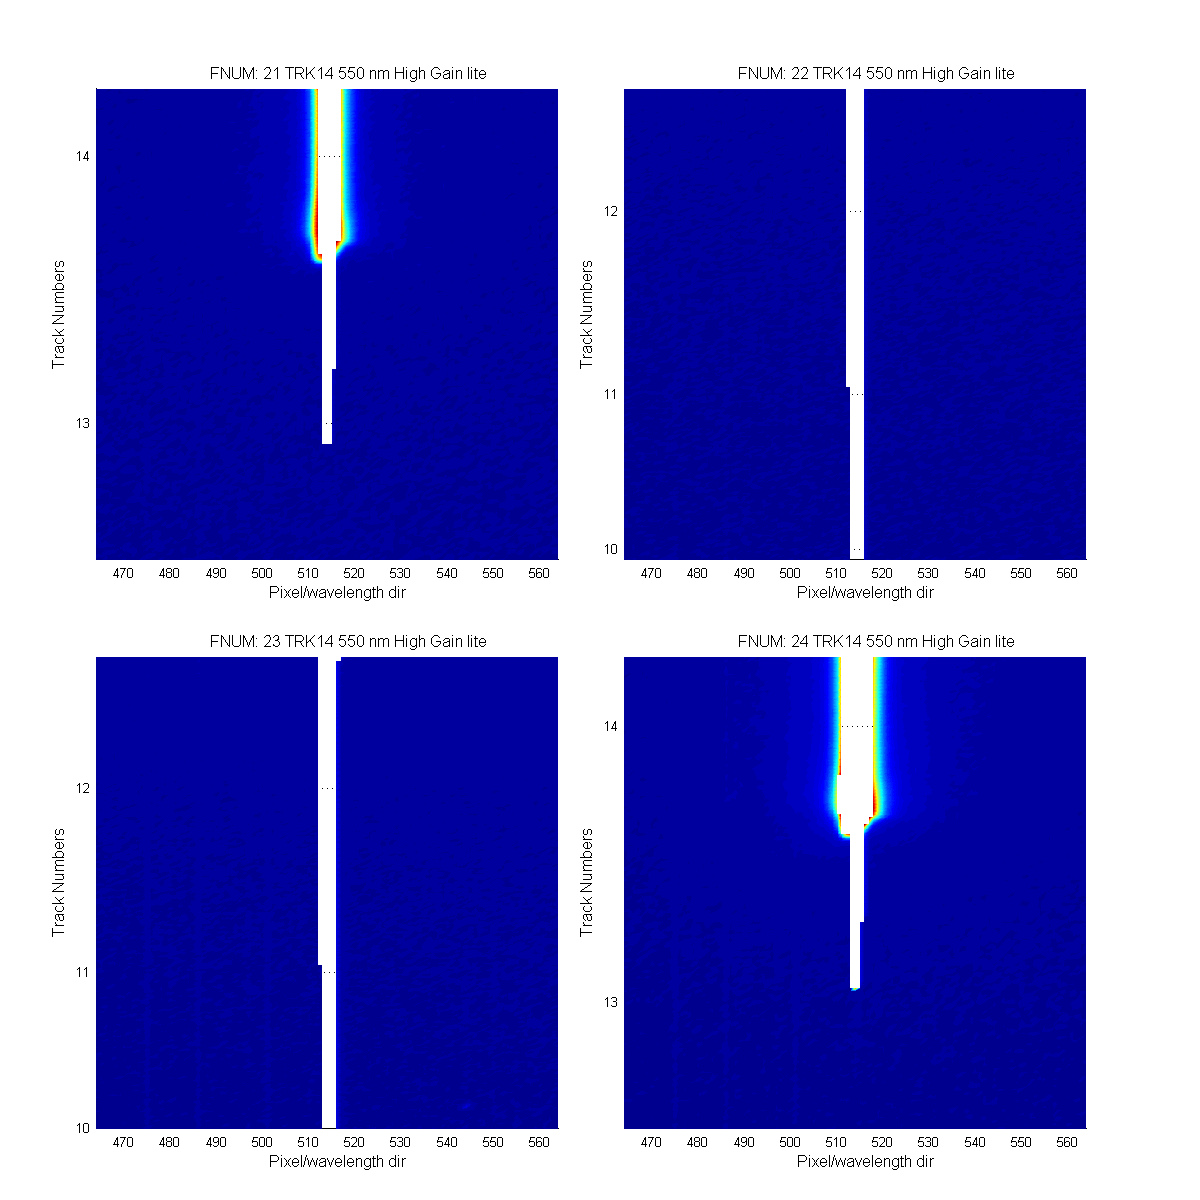
Figure 5
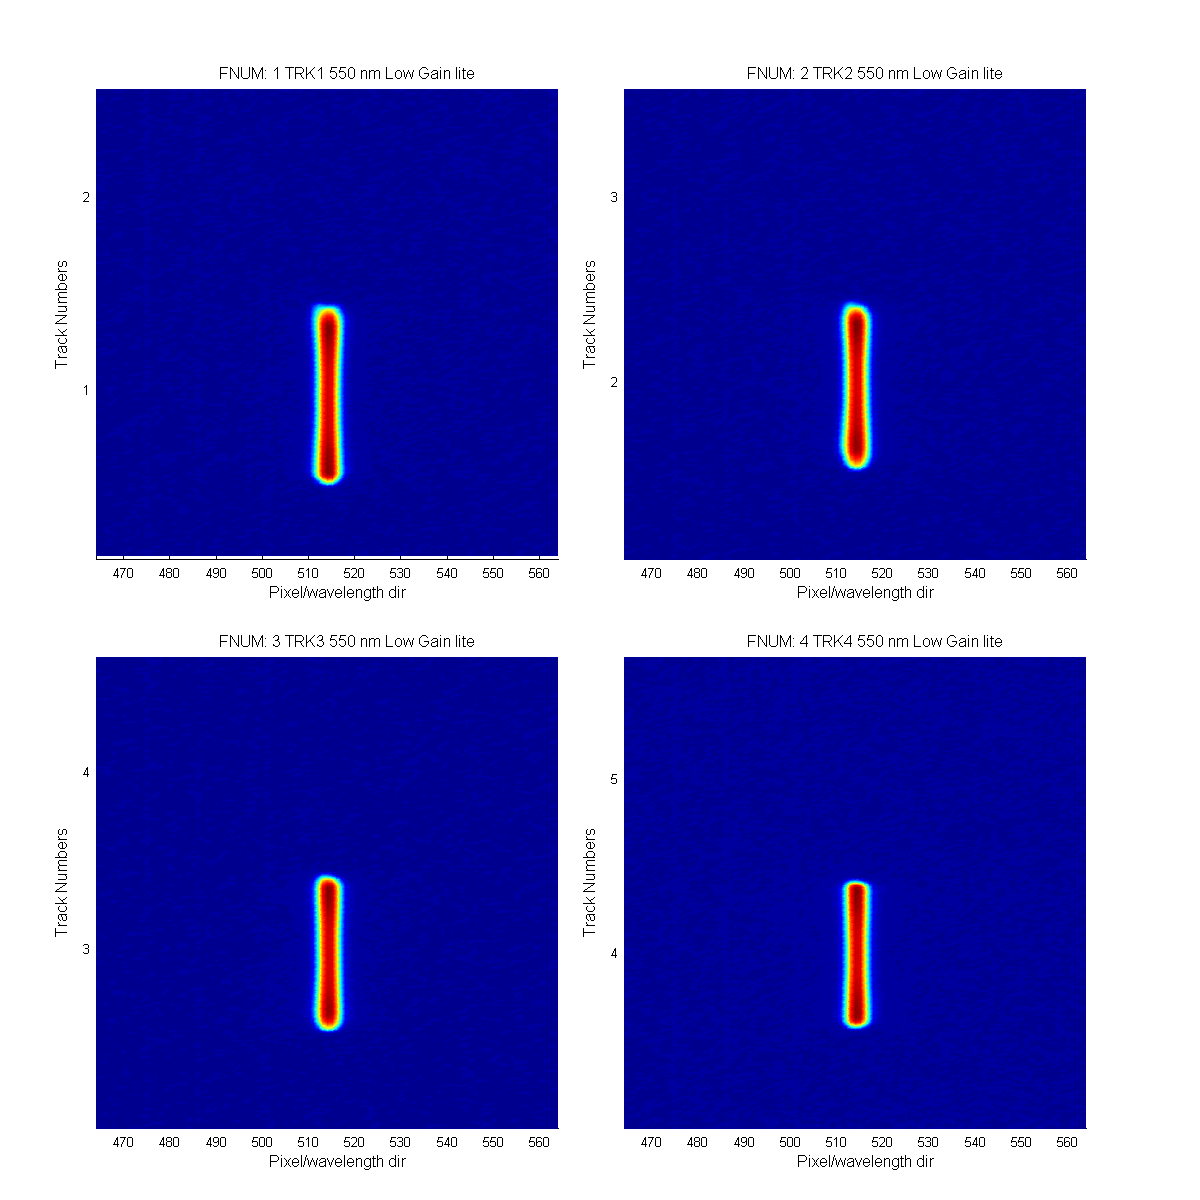
Figure 6
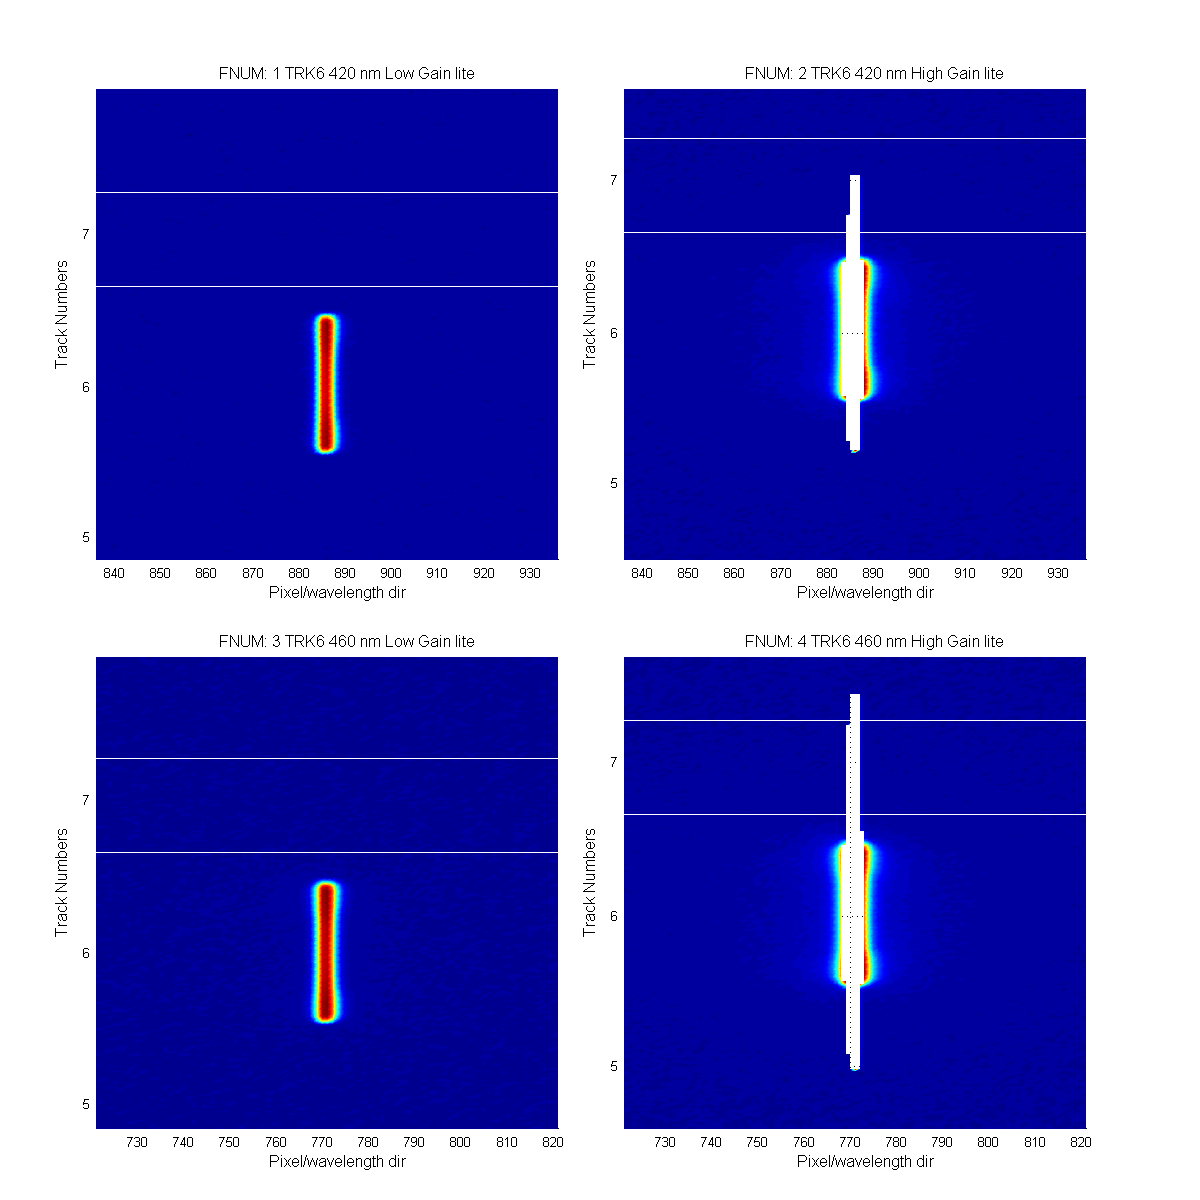
Figure 7
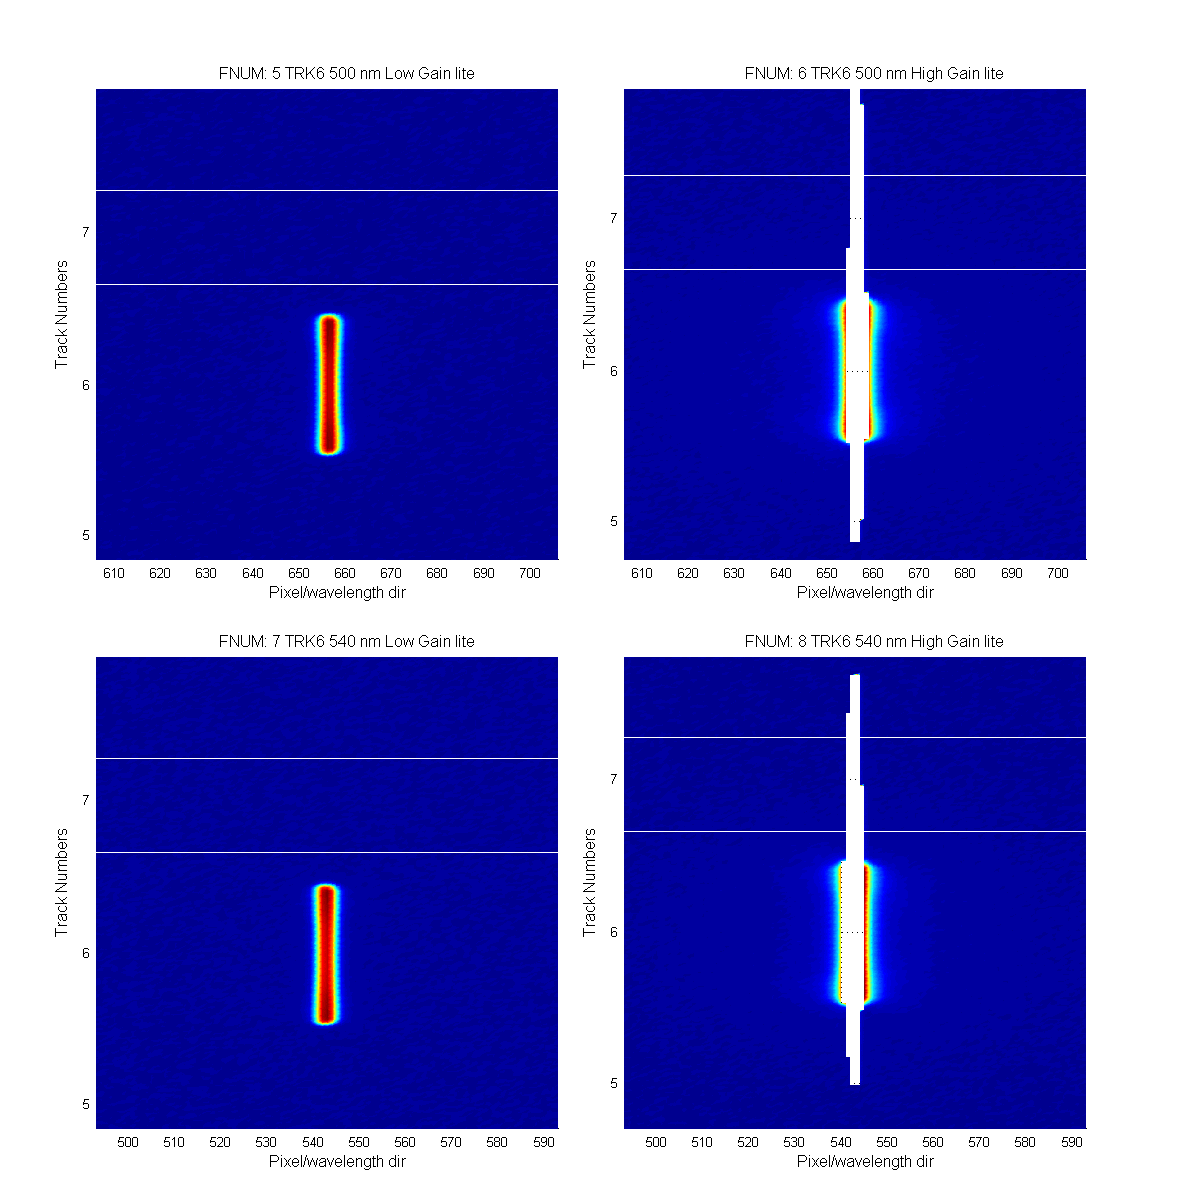
Figure 8
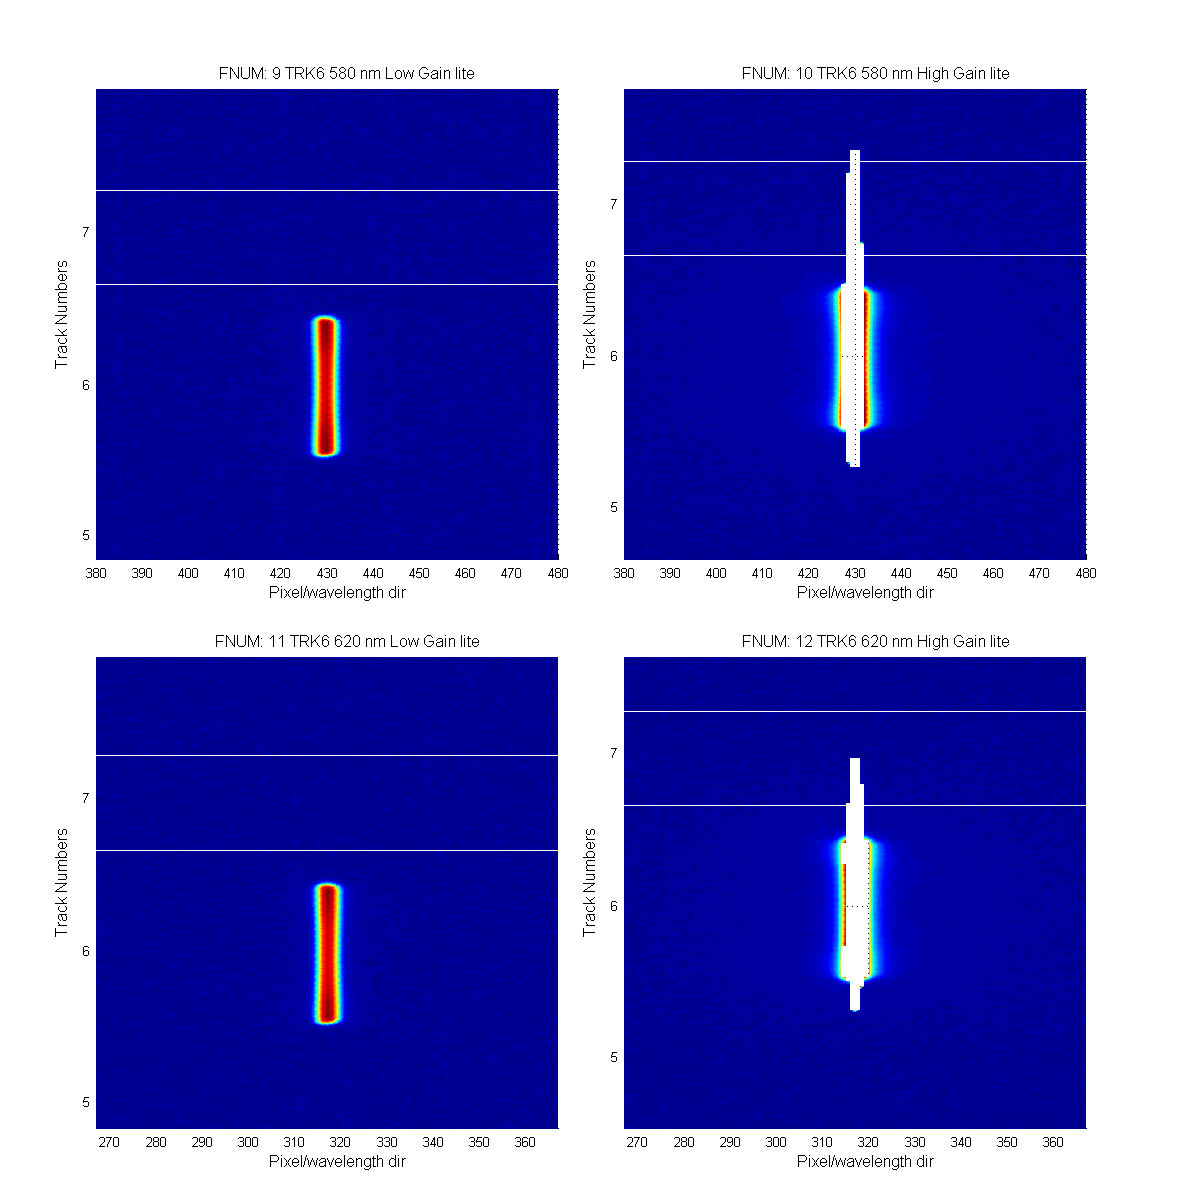
Figure 9
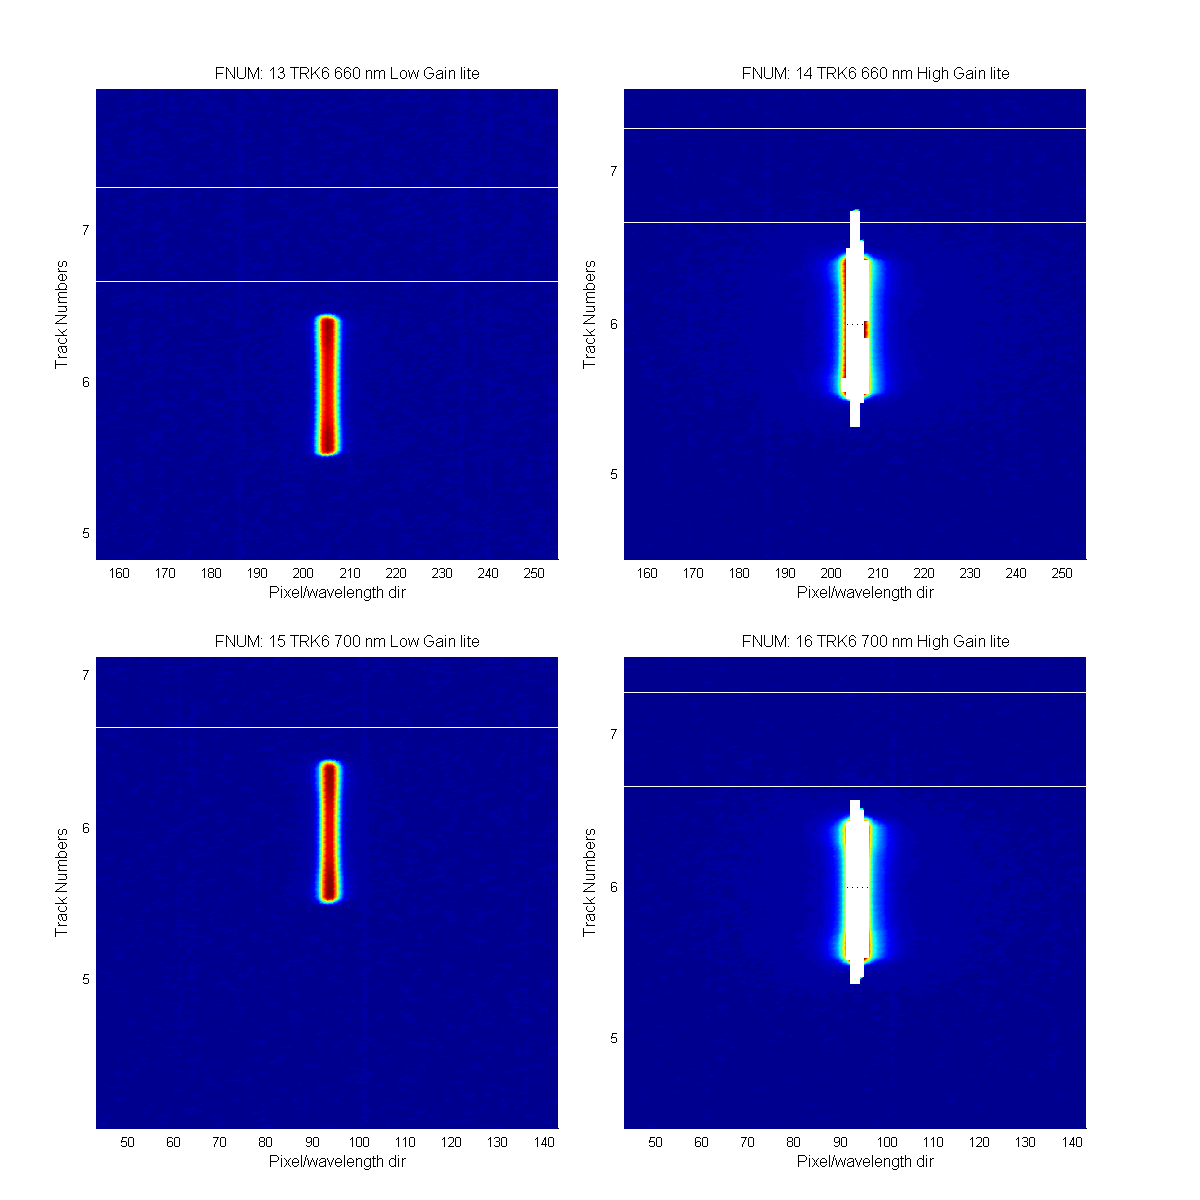
Figure 10
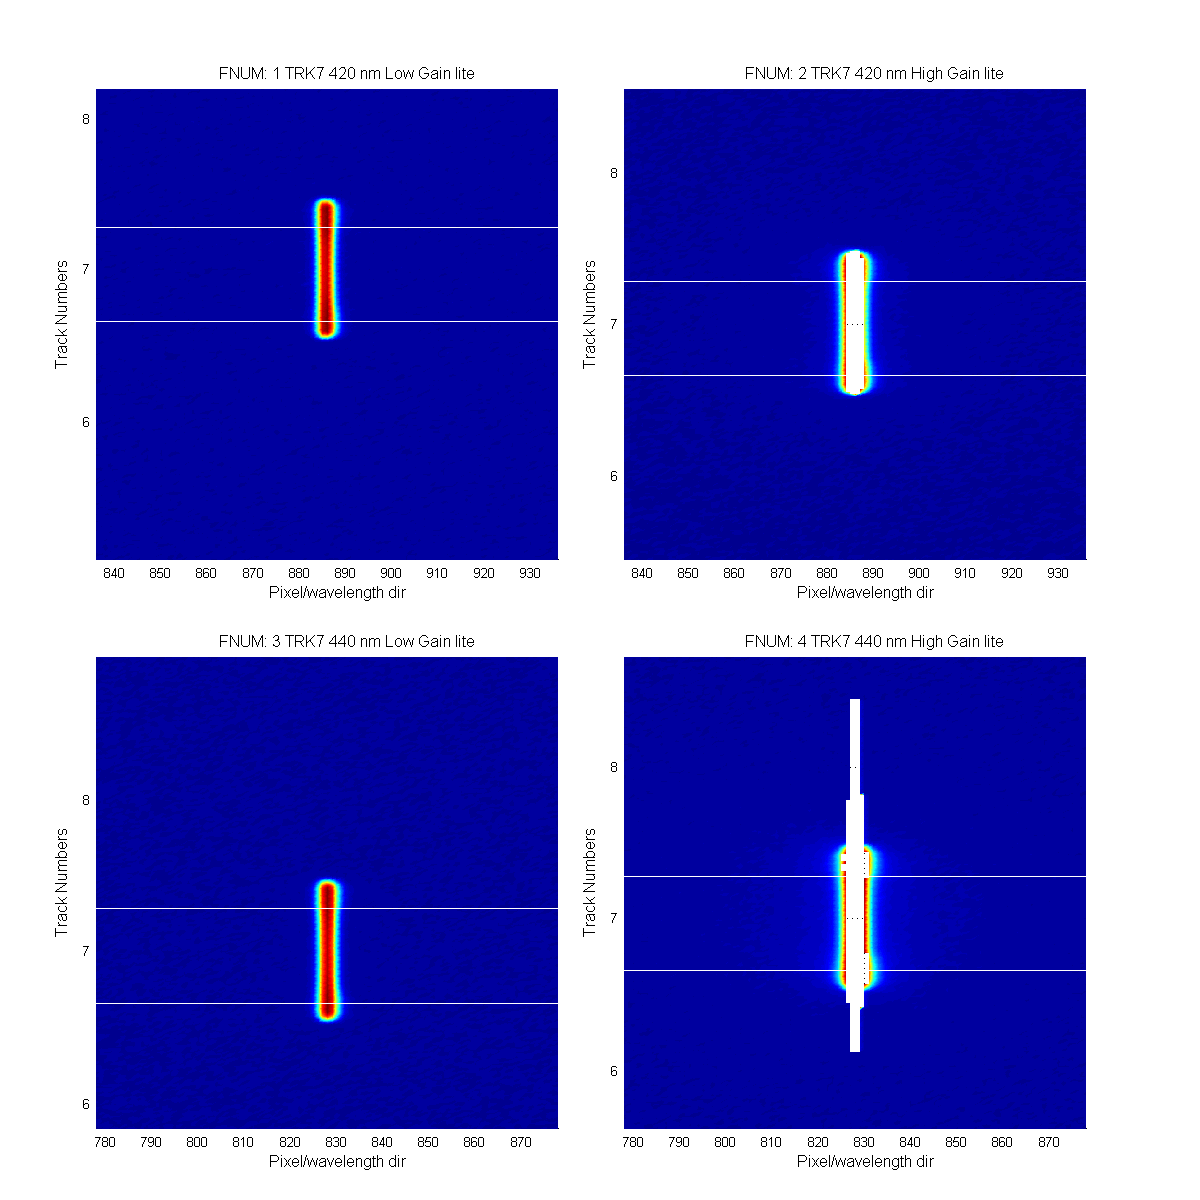
Figure 11
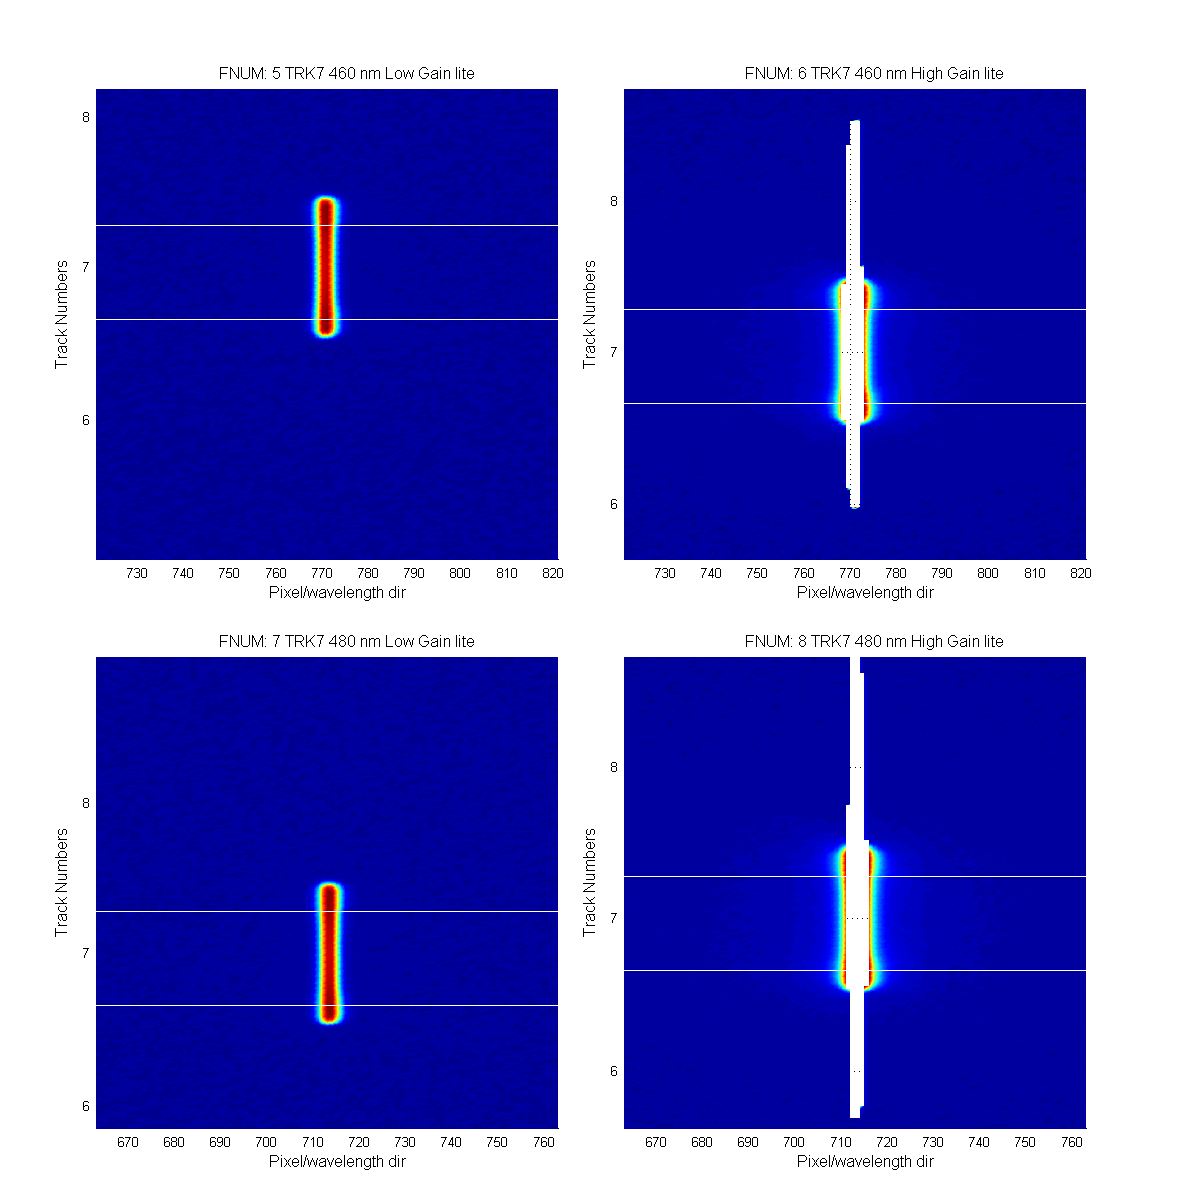
Figure 12
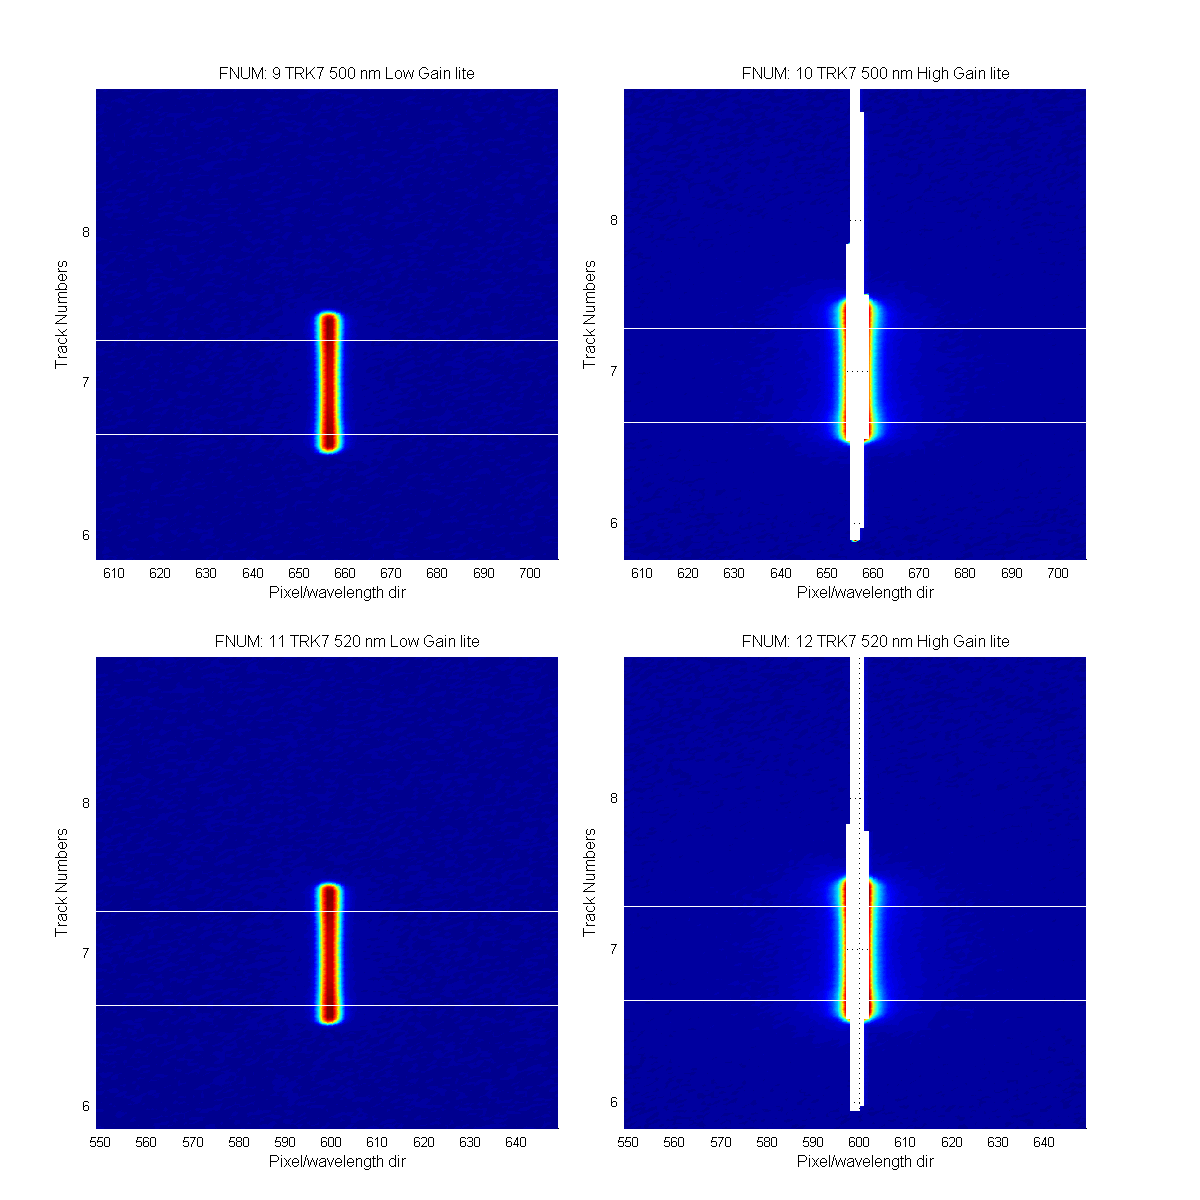
Figure 13

Figure 14
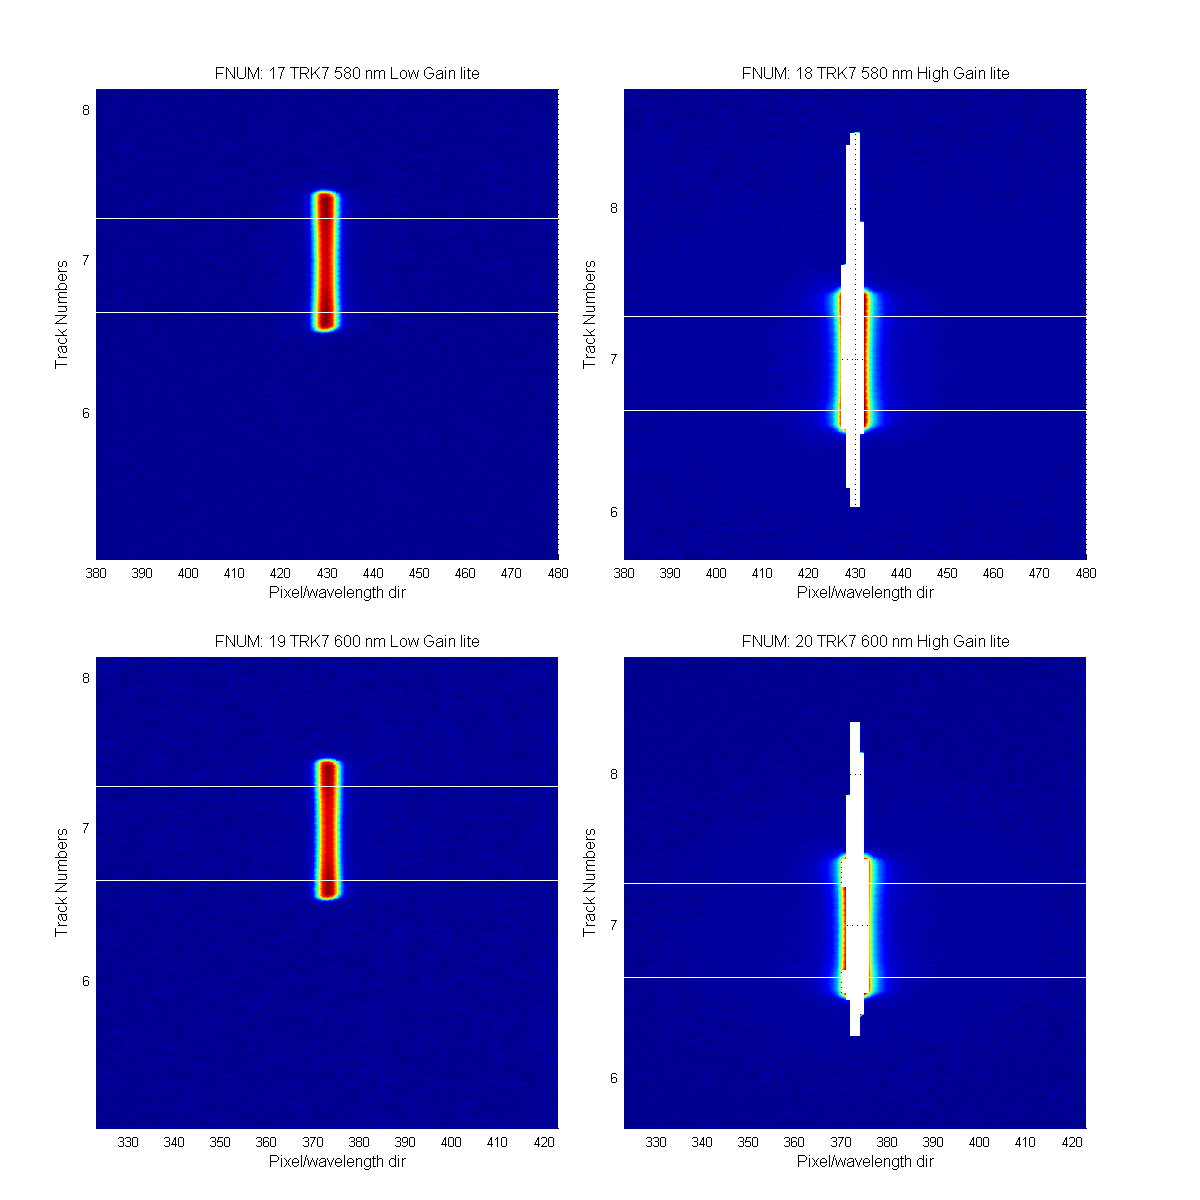
Figure 15
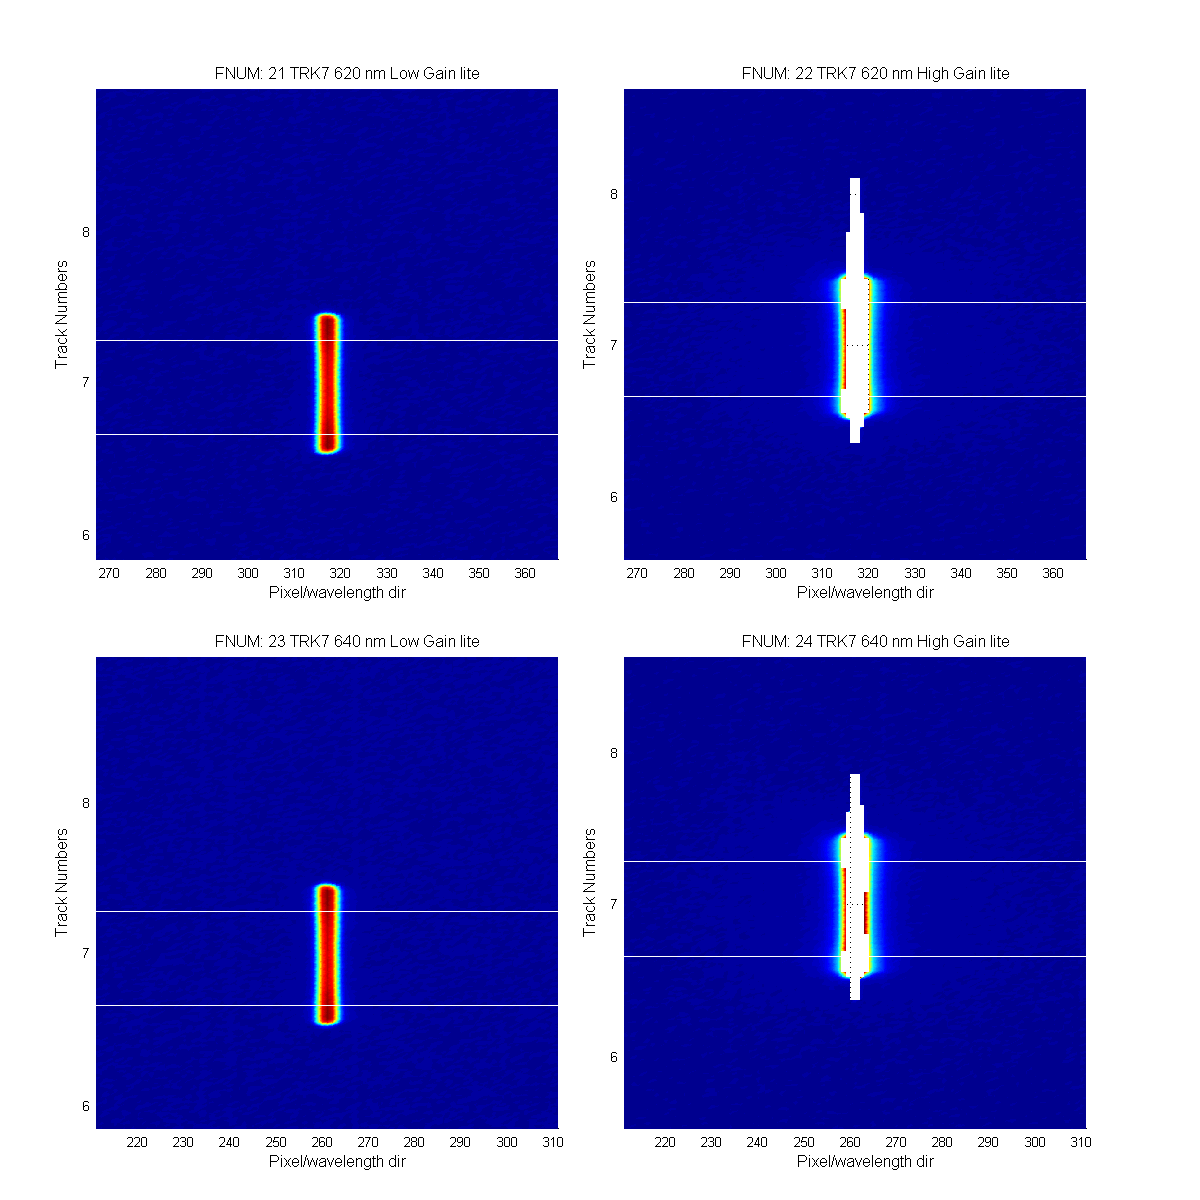
Figure 16
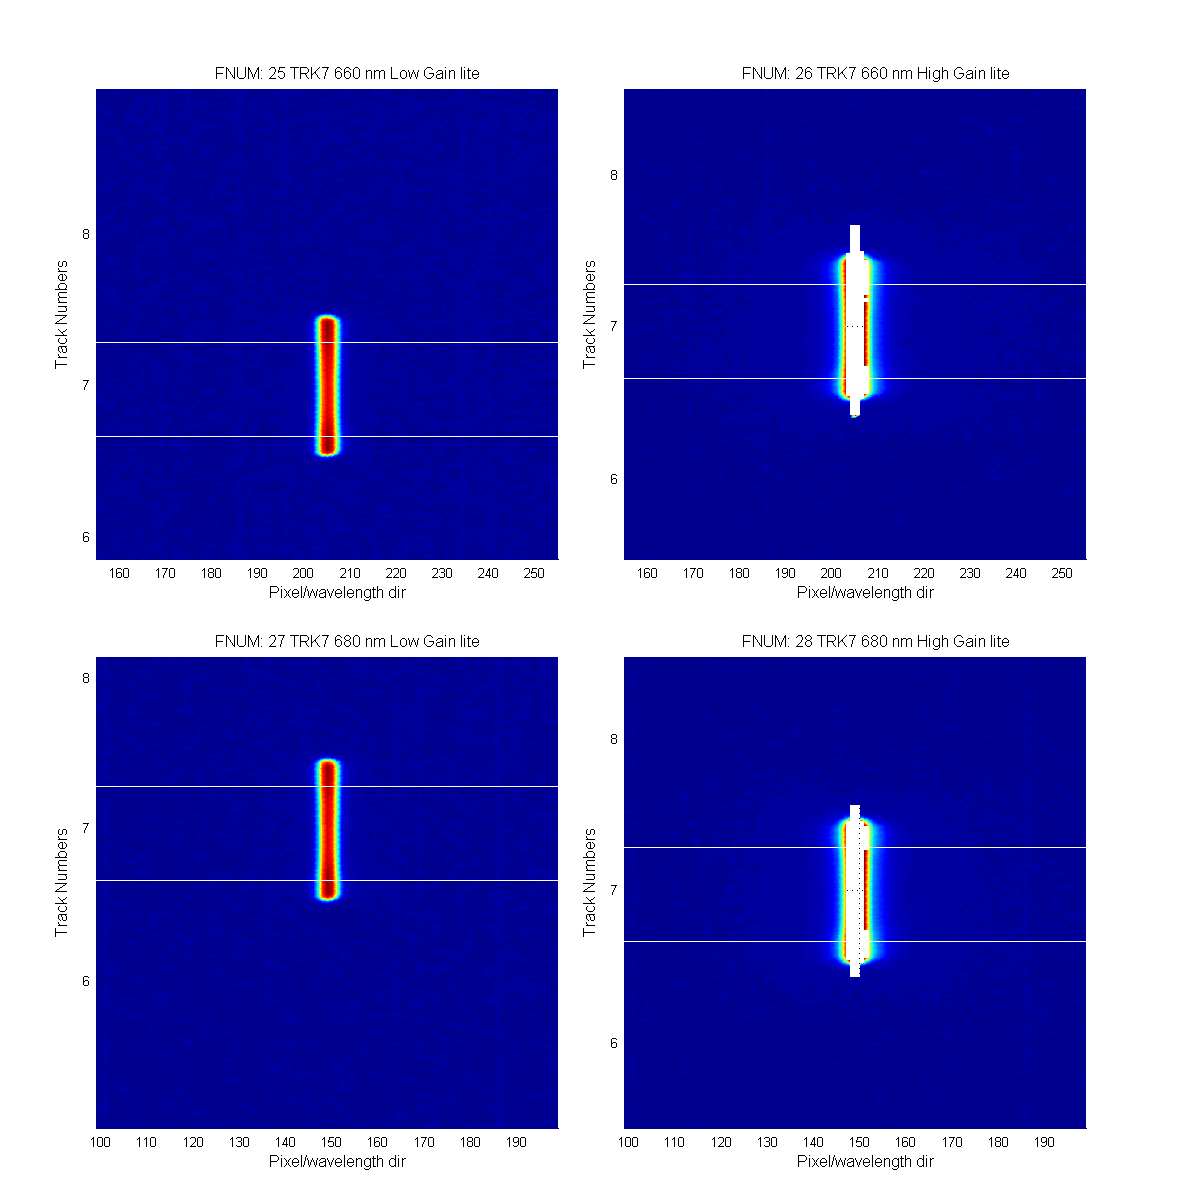
Figure 17
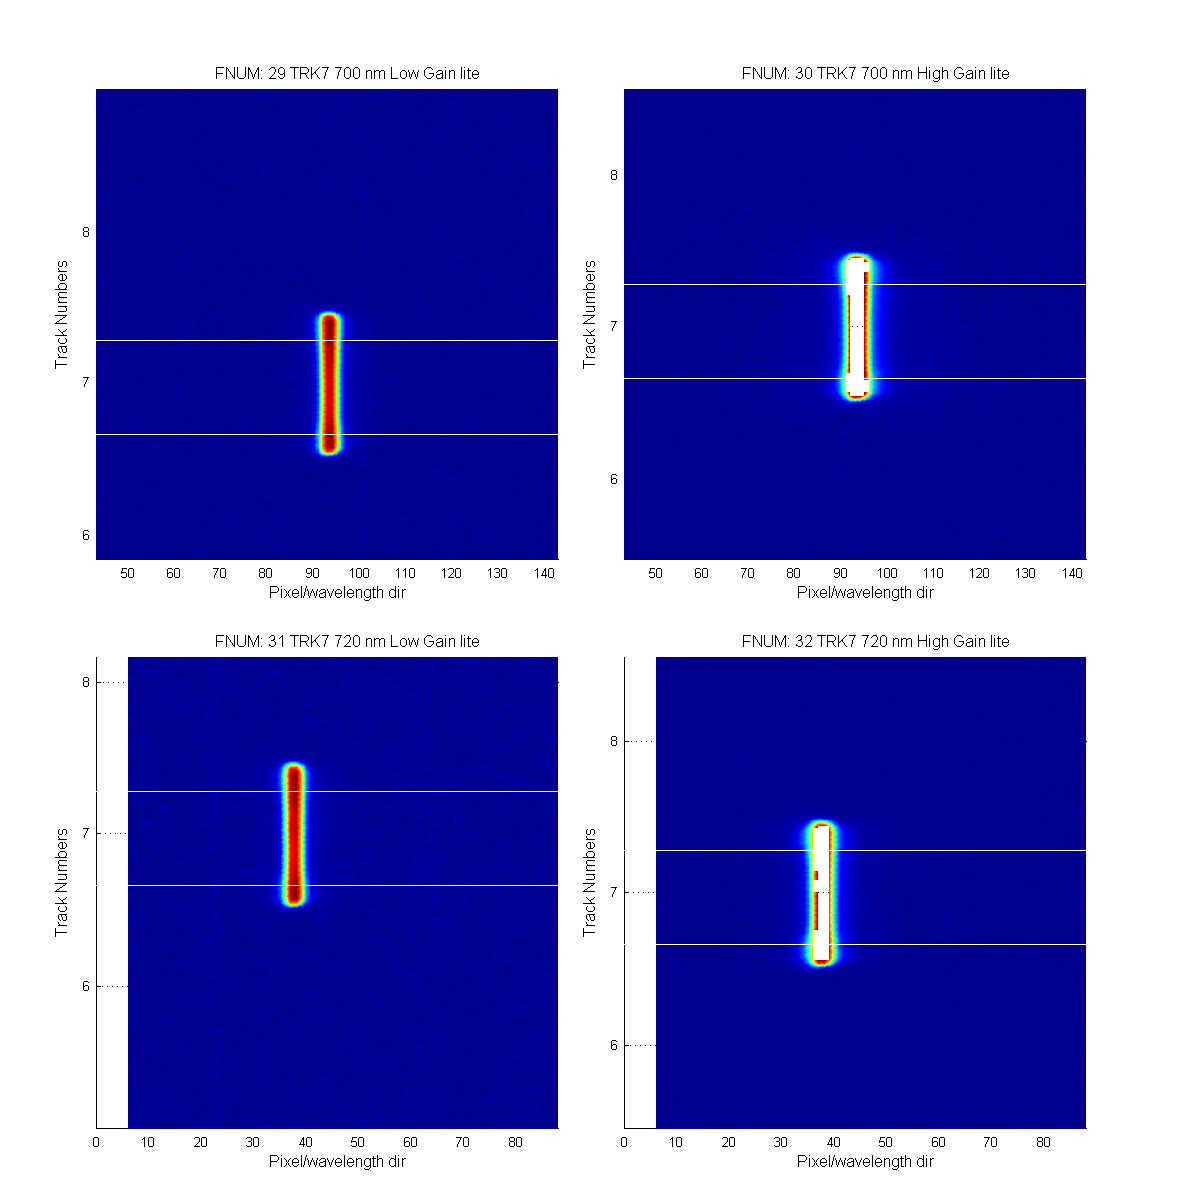
Figure 18
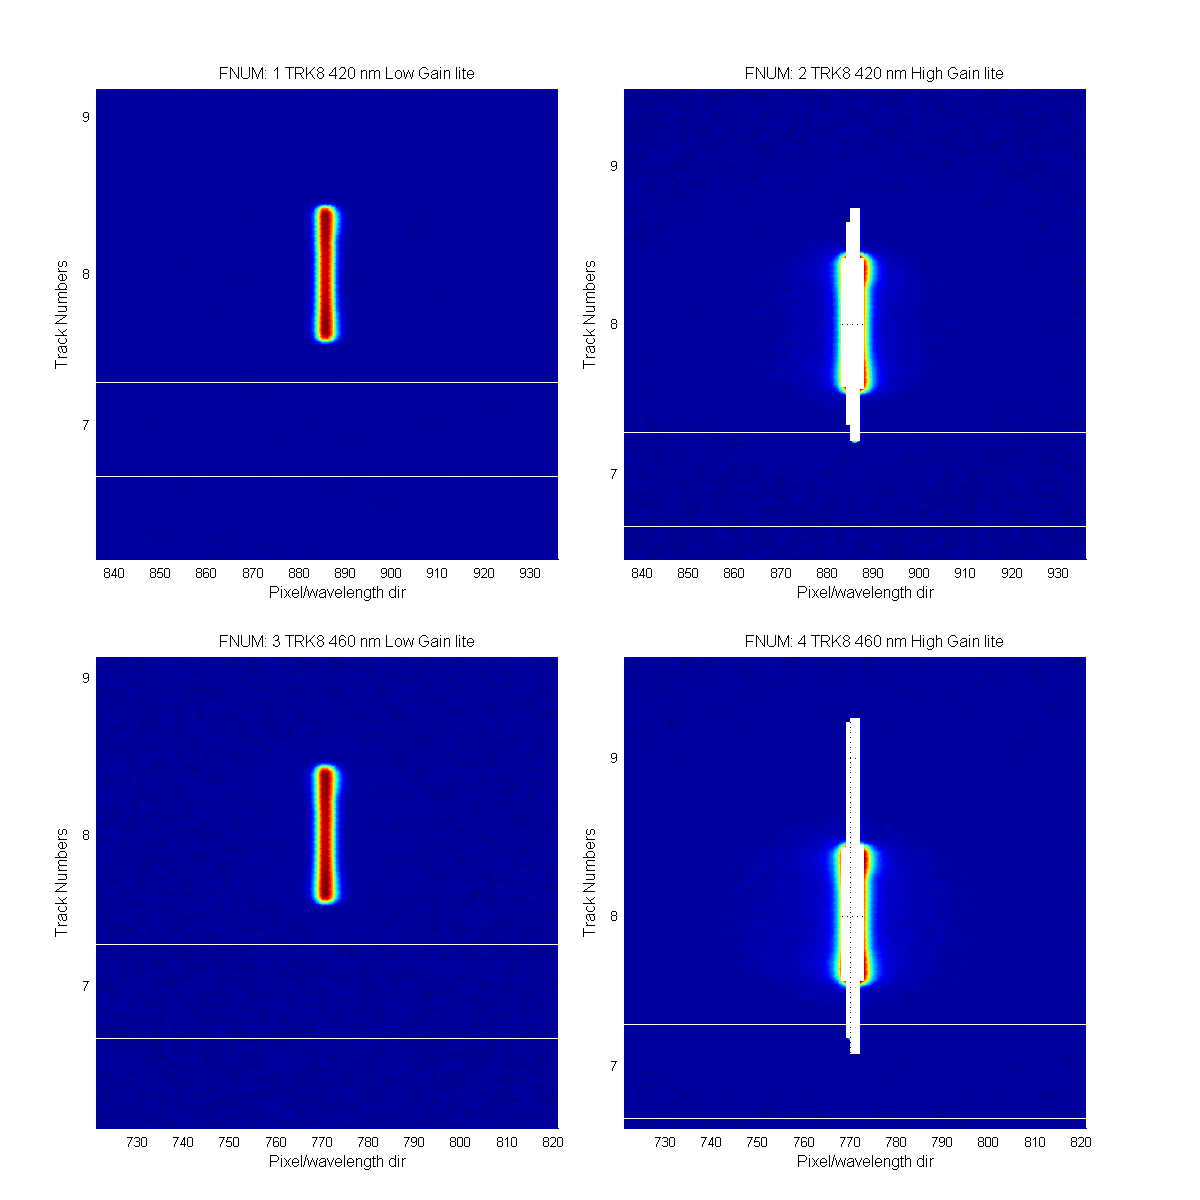
Figure 19
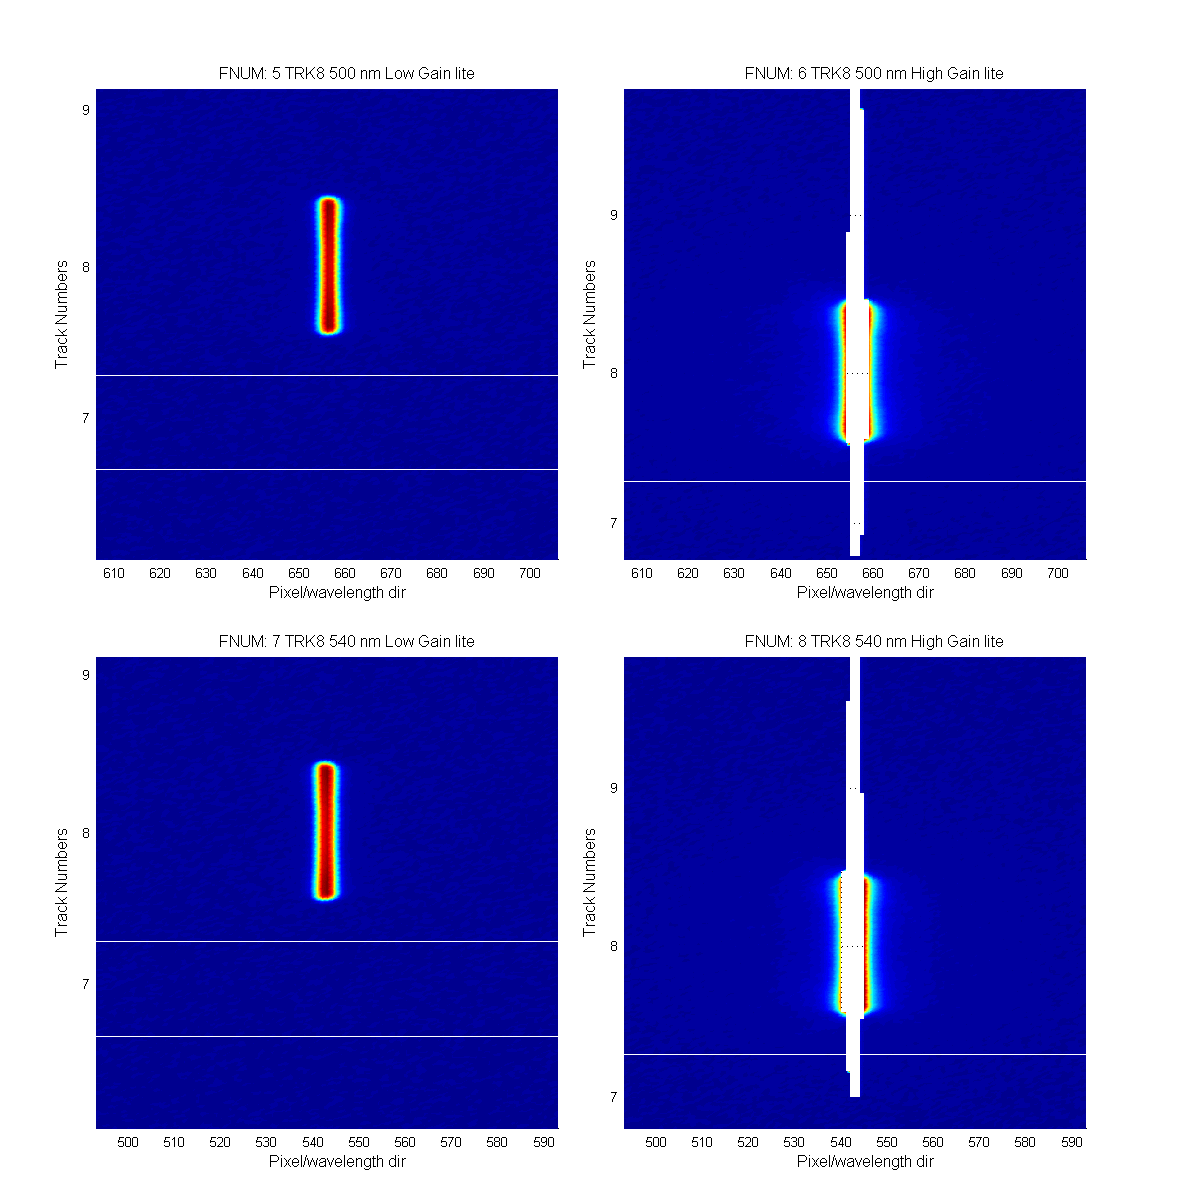
Figure 20
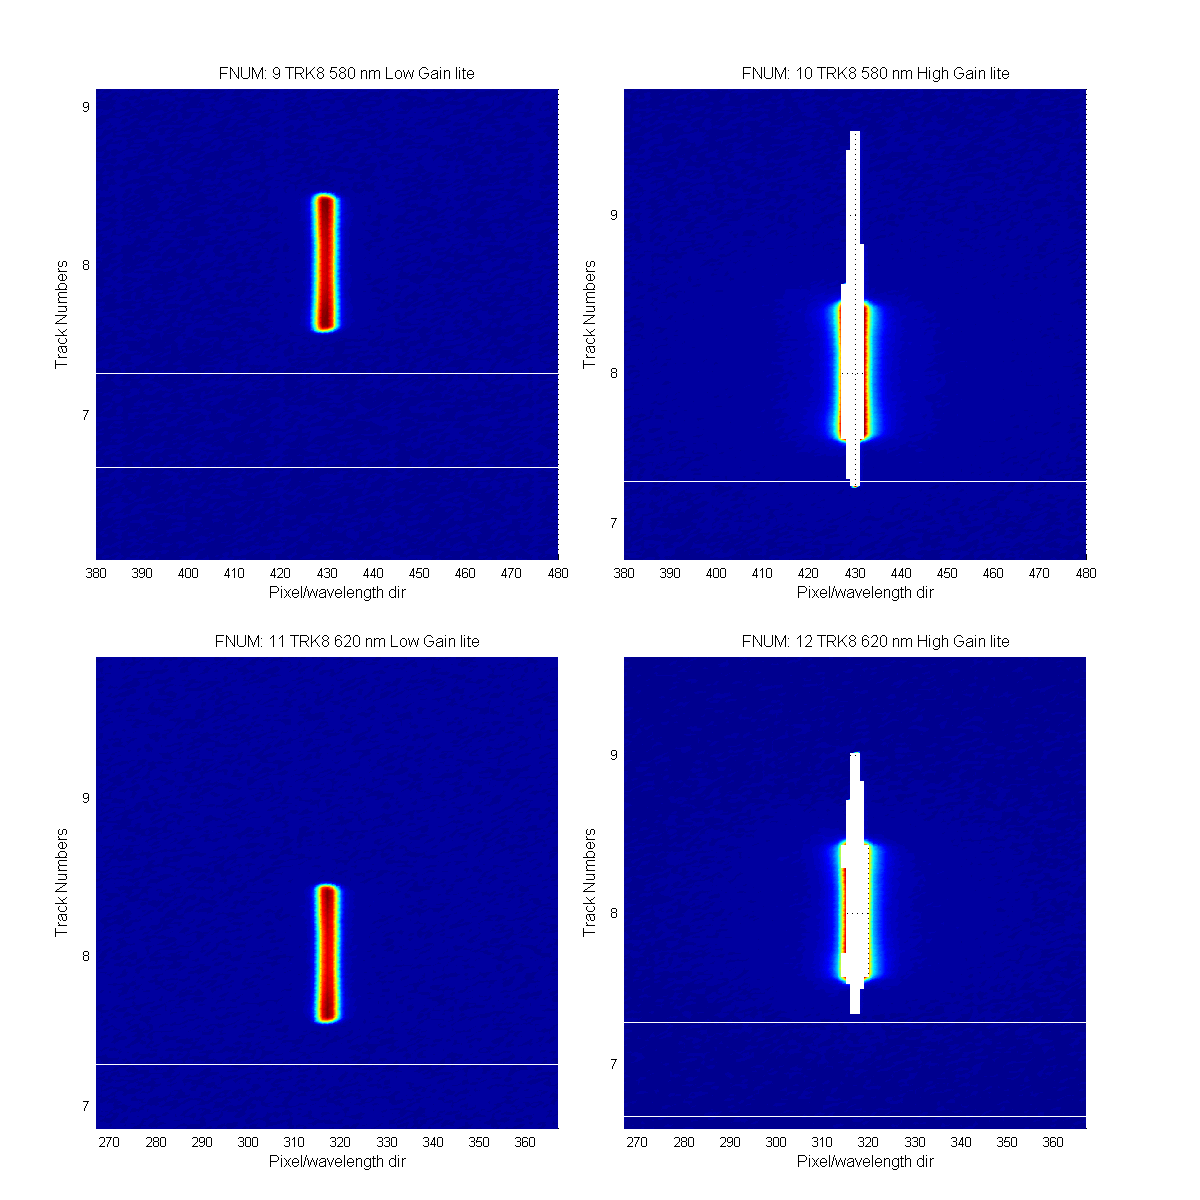
Figure 21
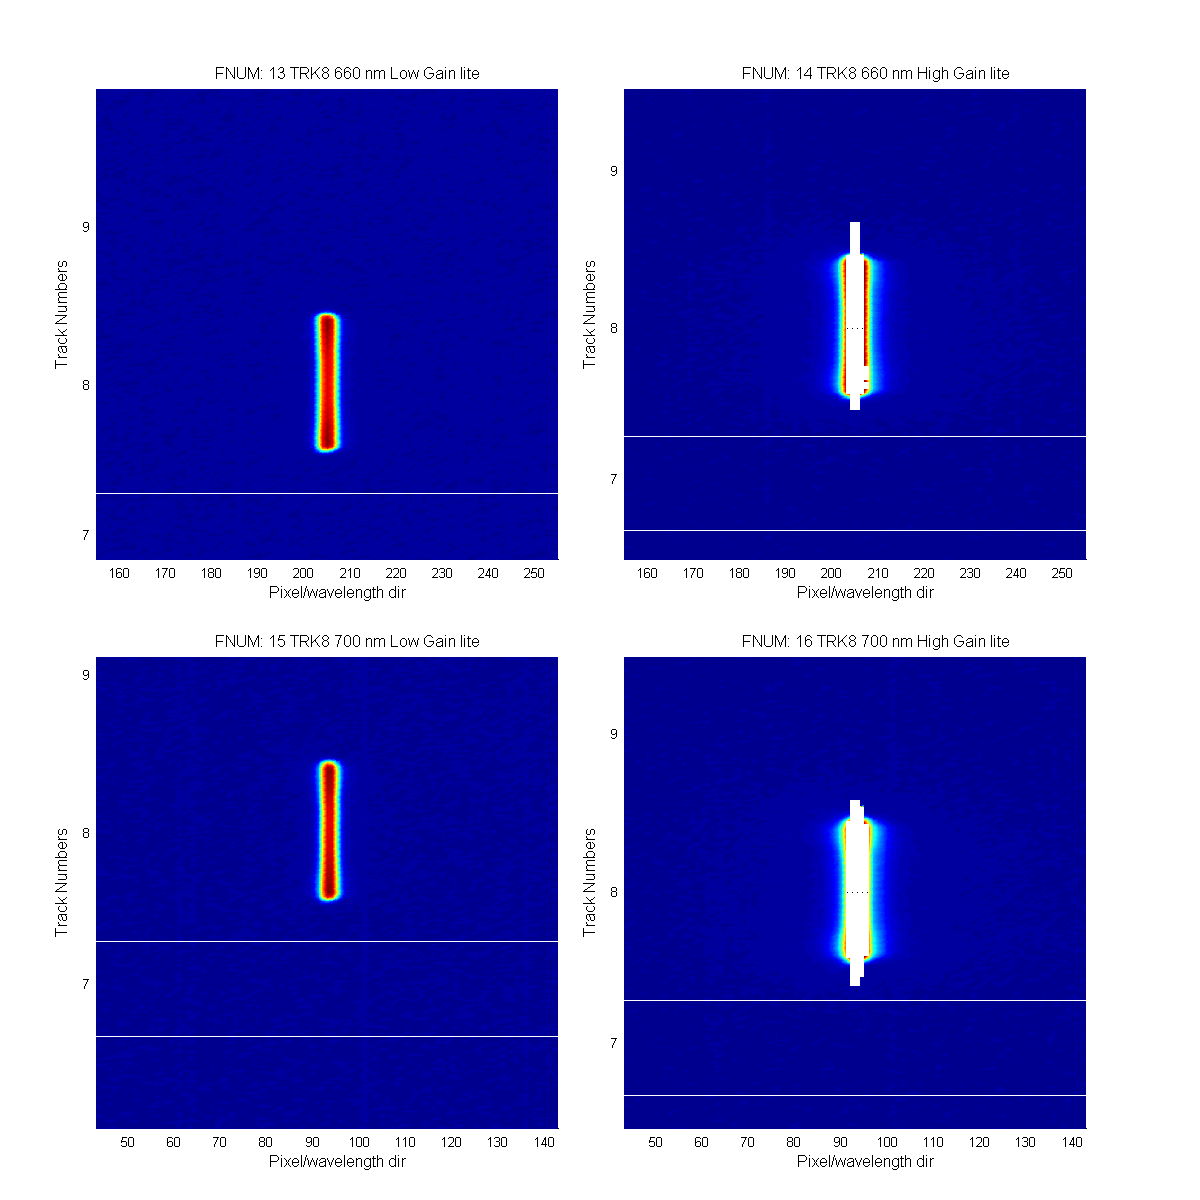
Figure 22