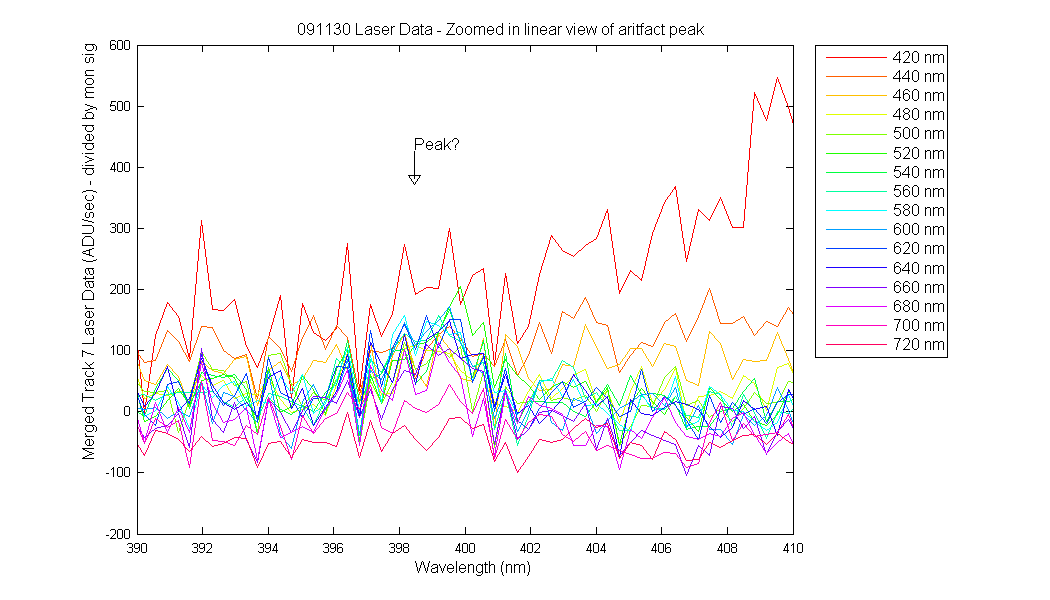
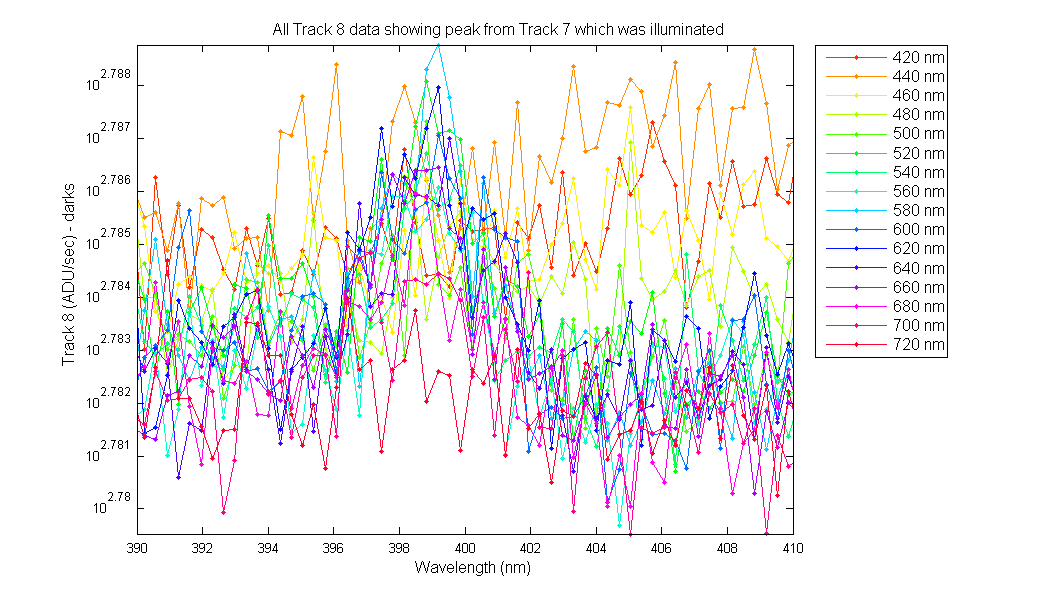
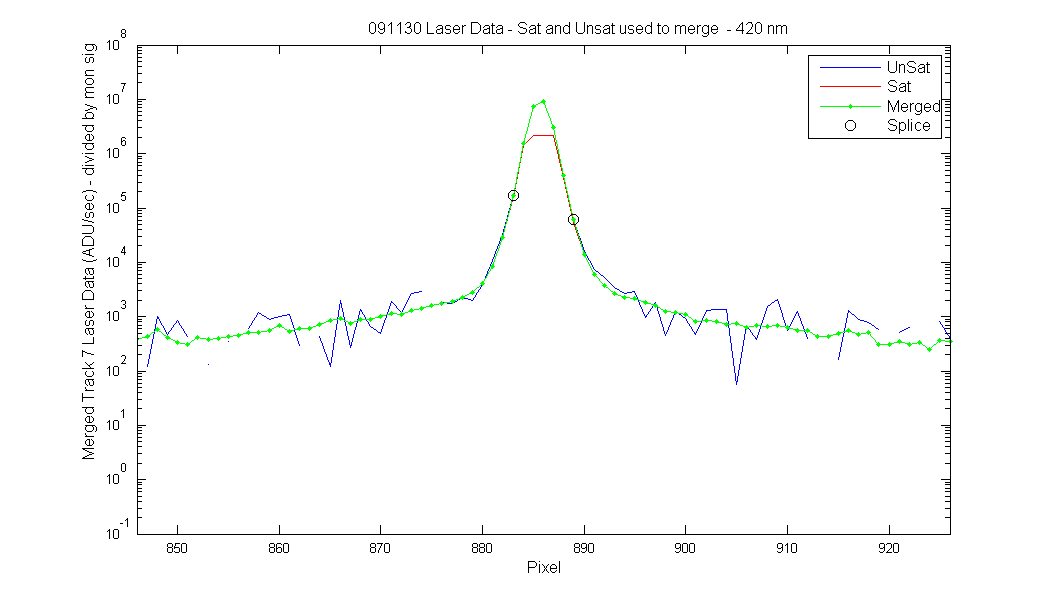
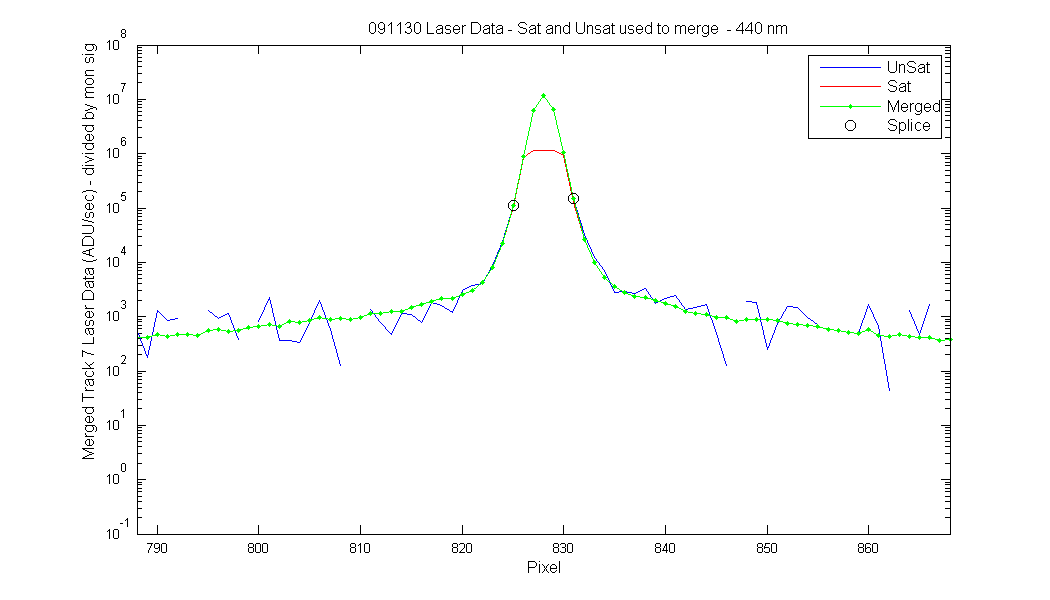
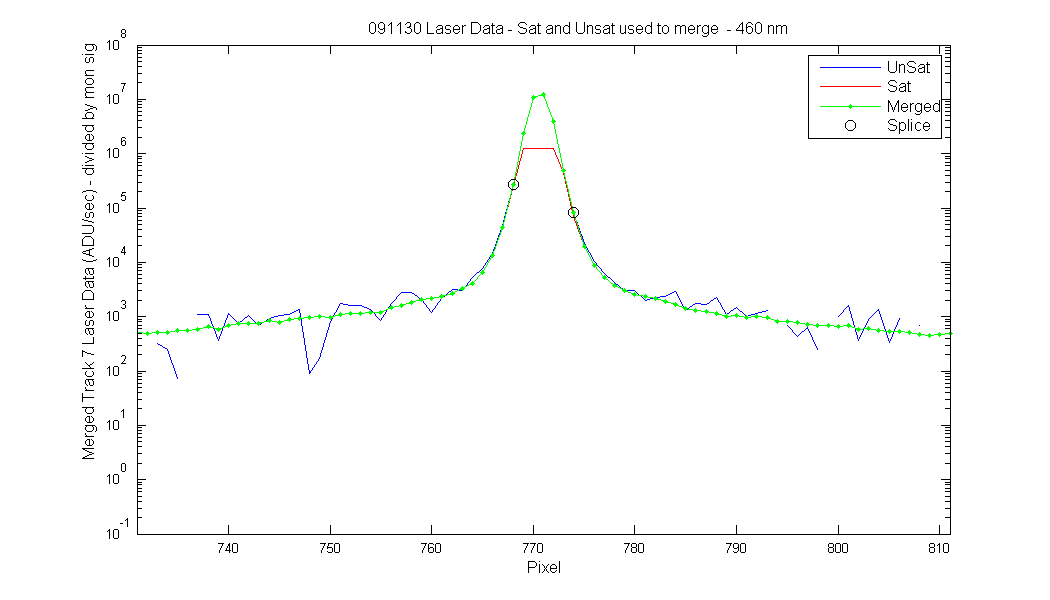
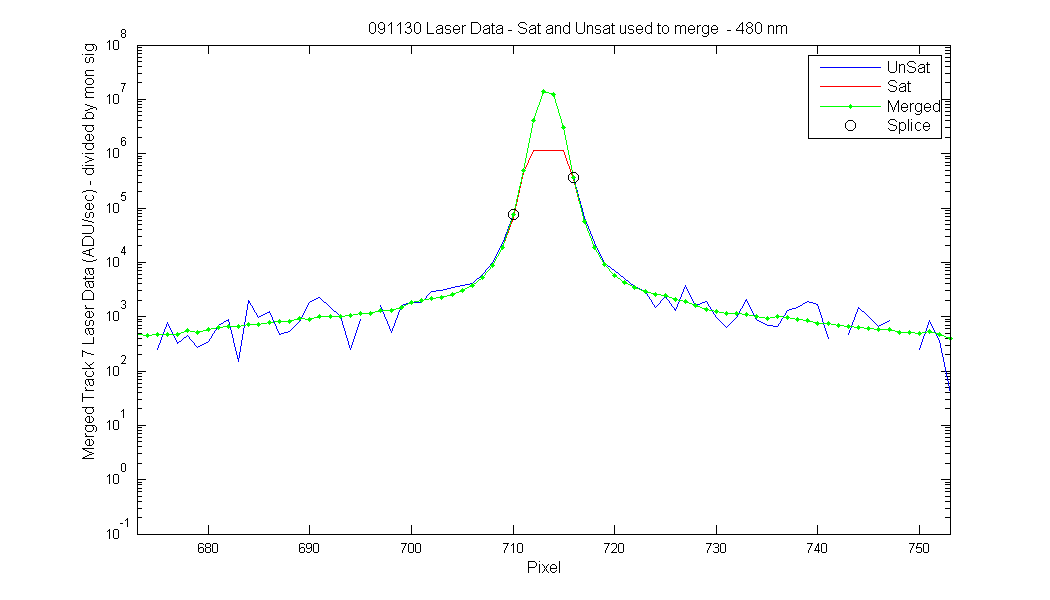
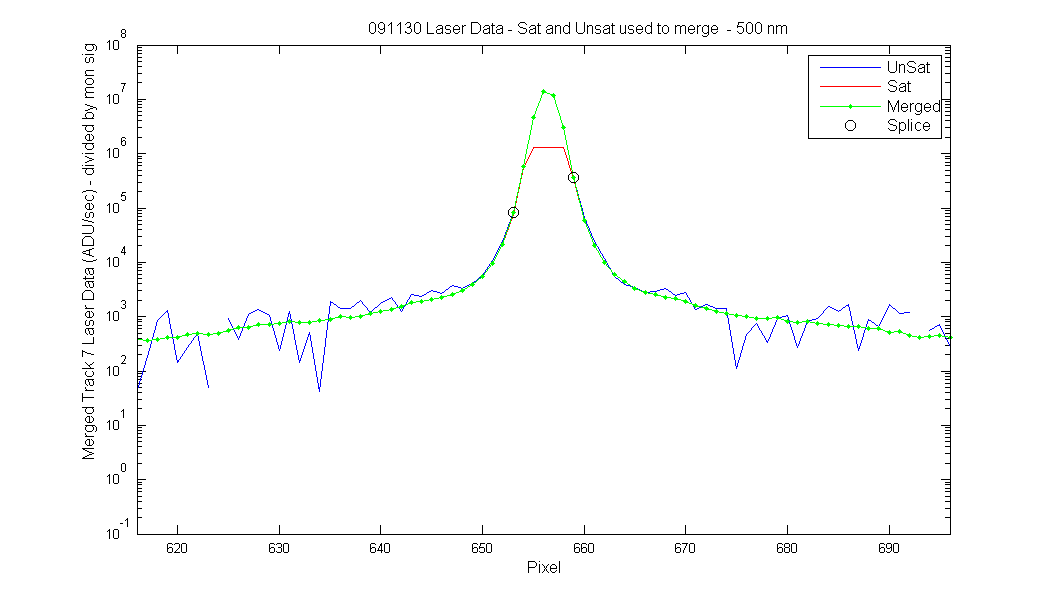
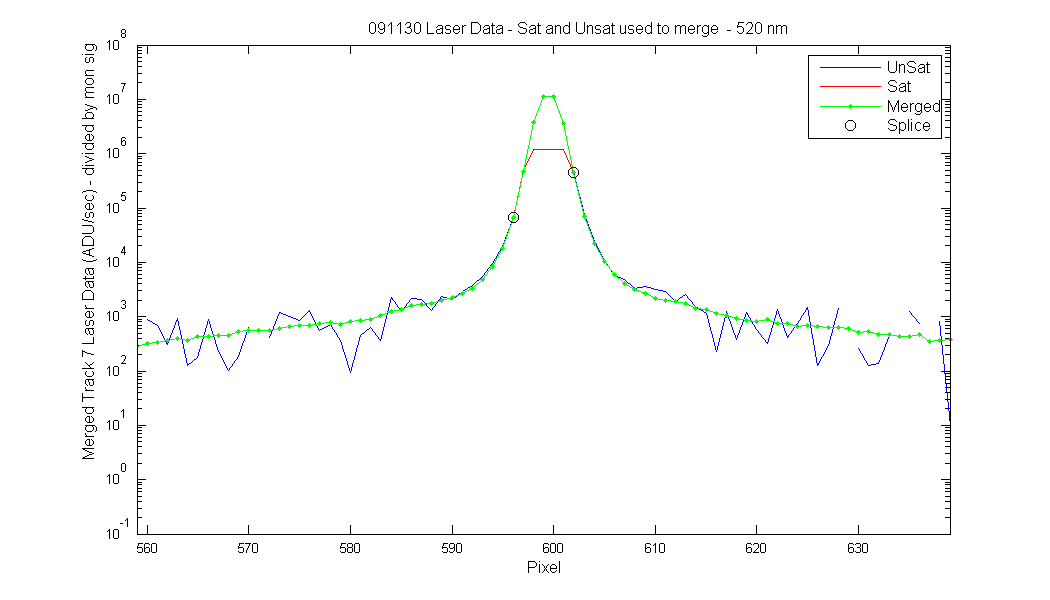
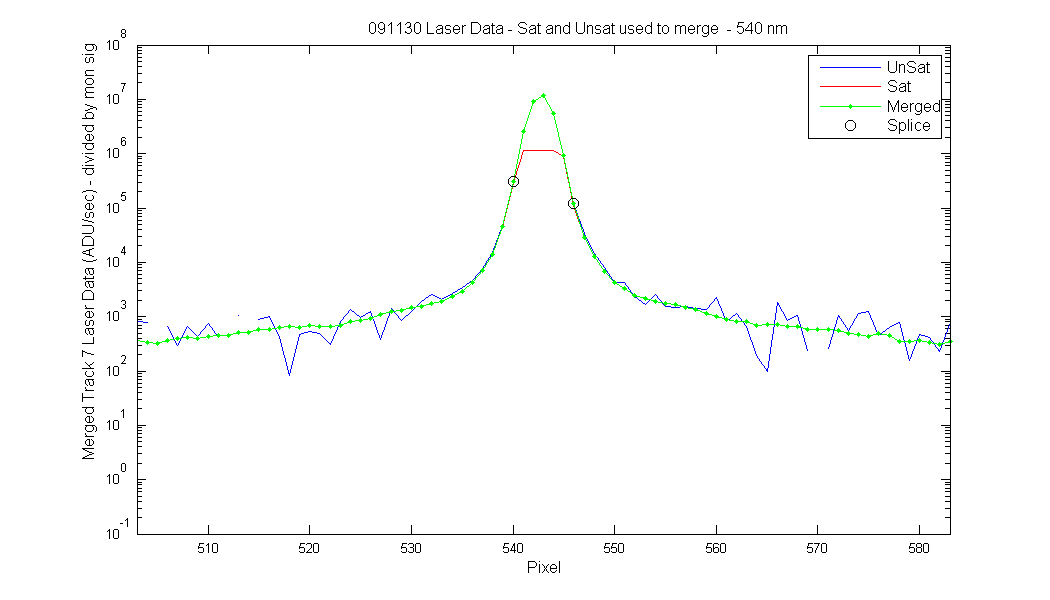
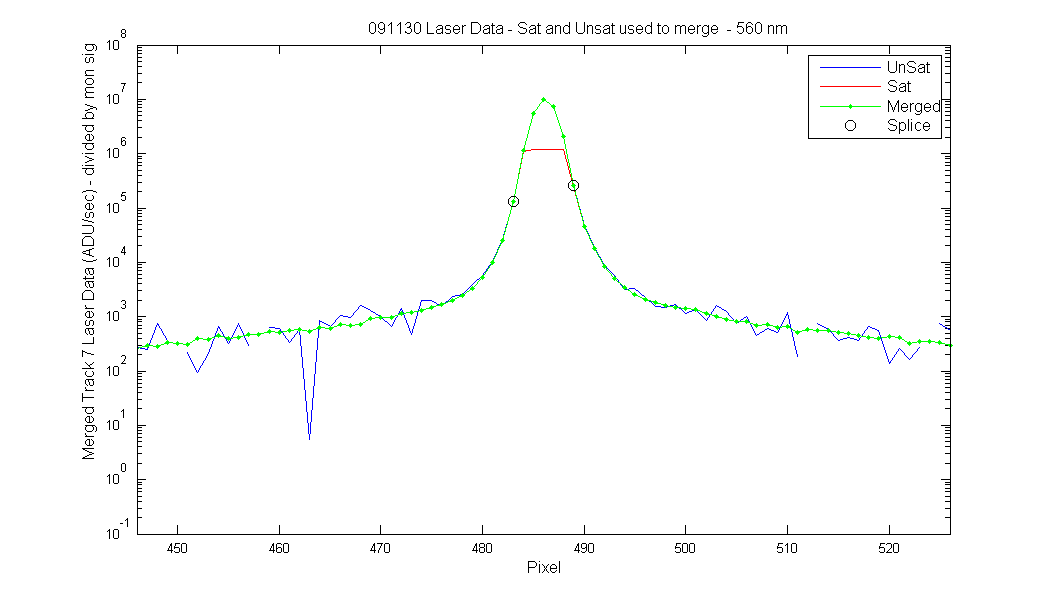
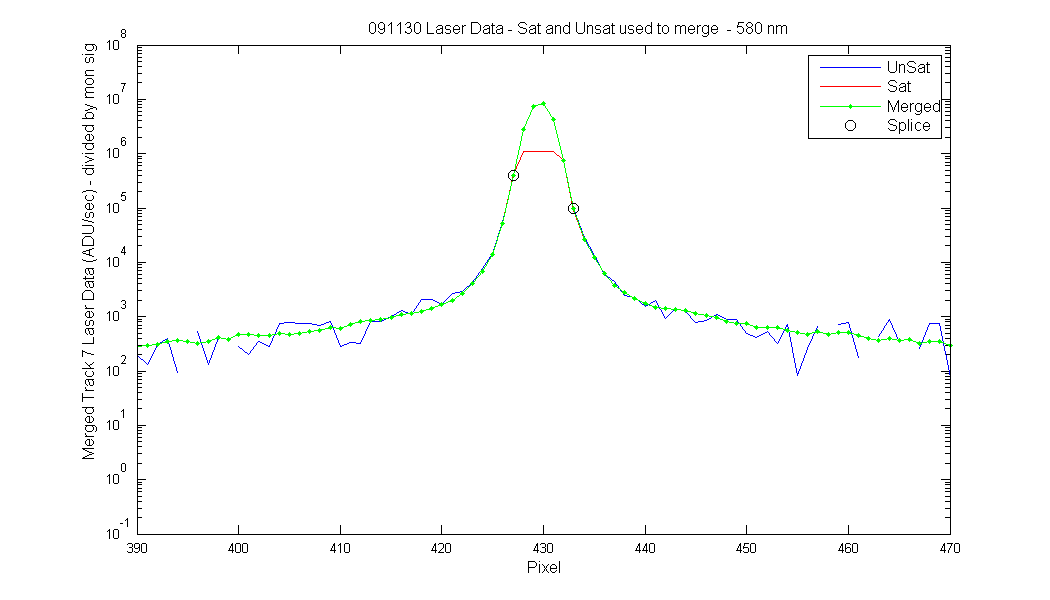
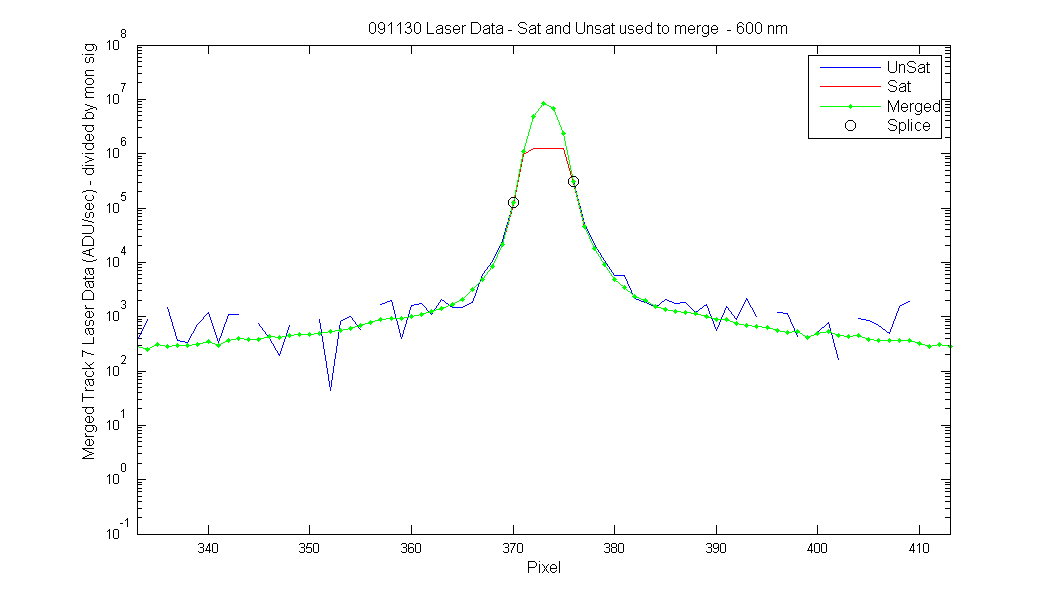
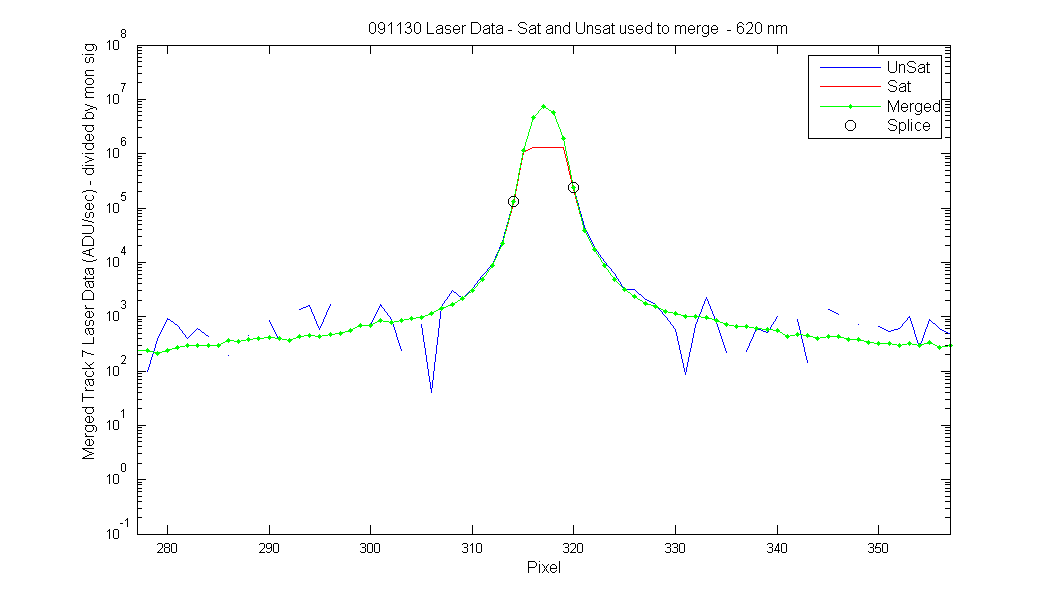
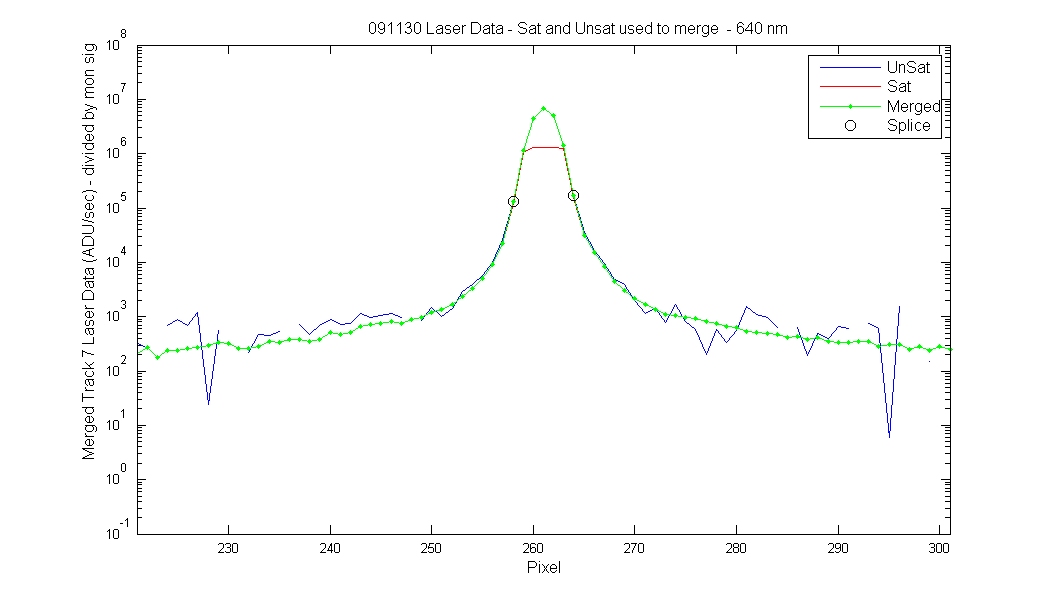
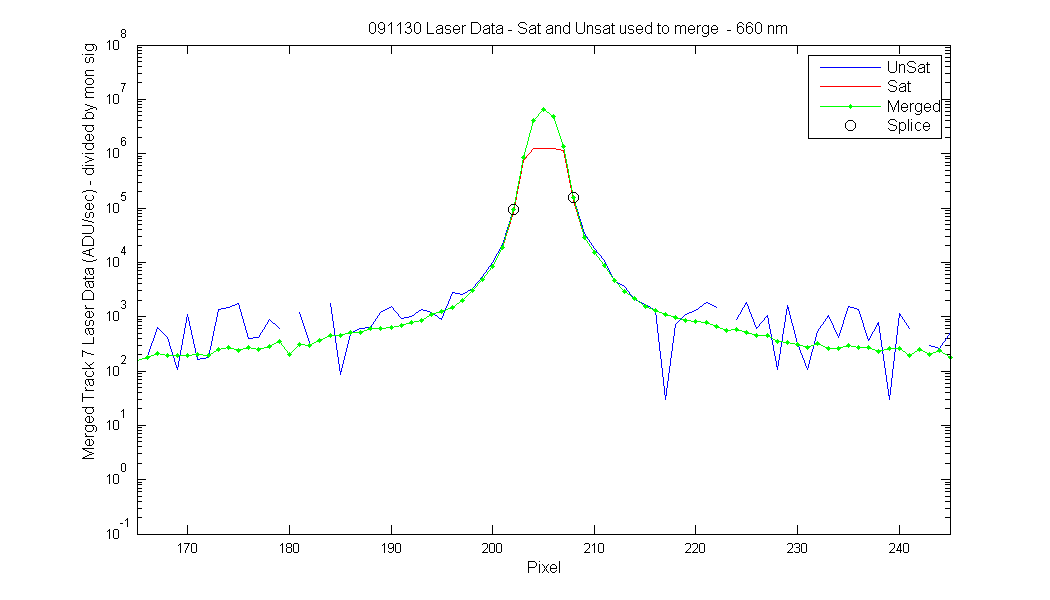
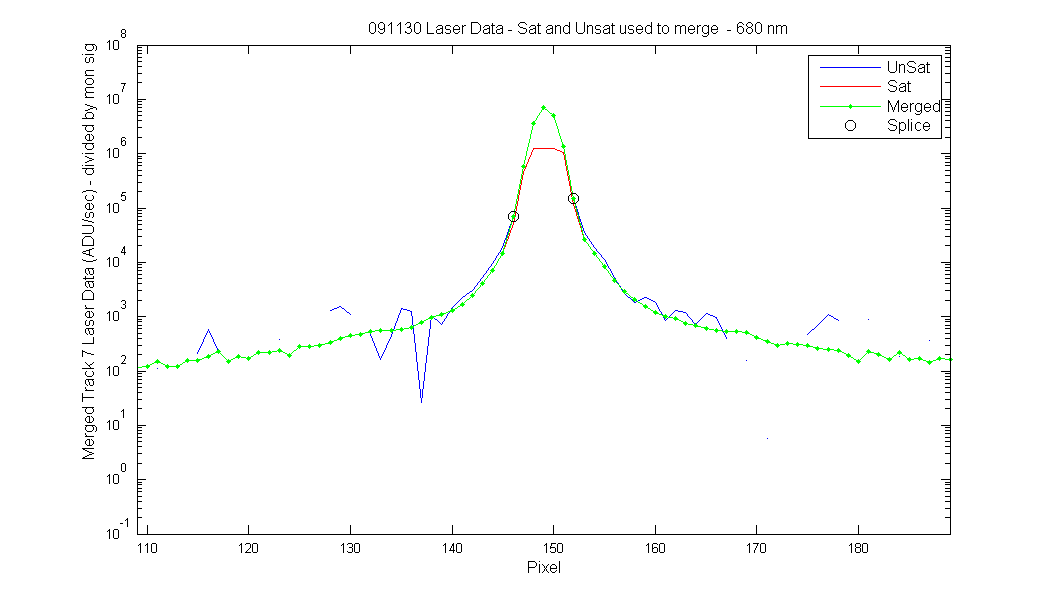
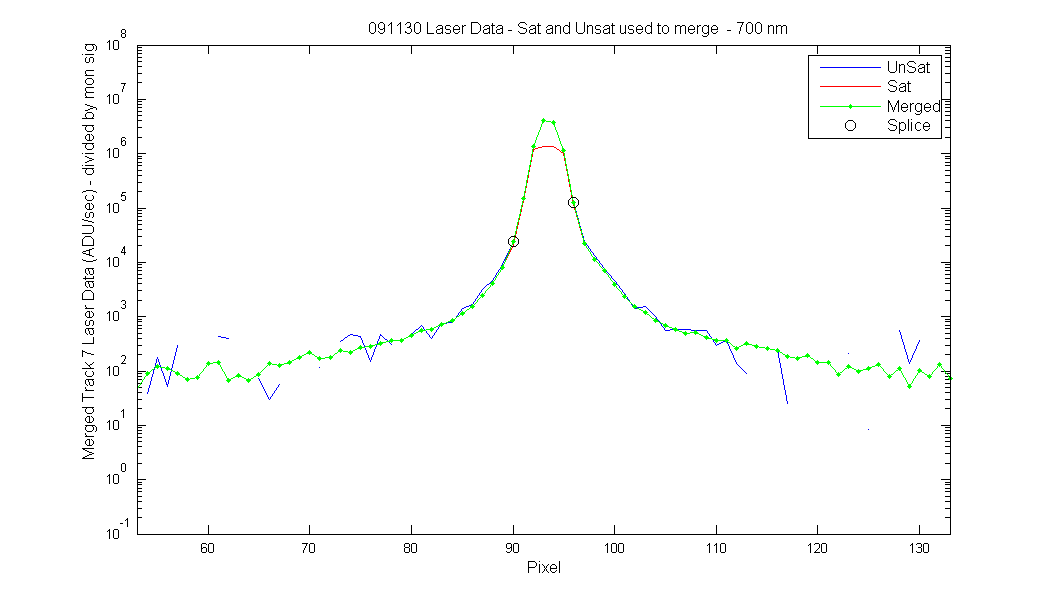
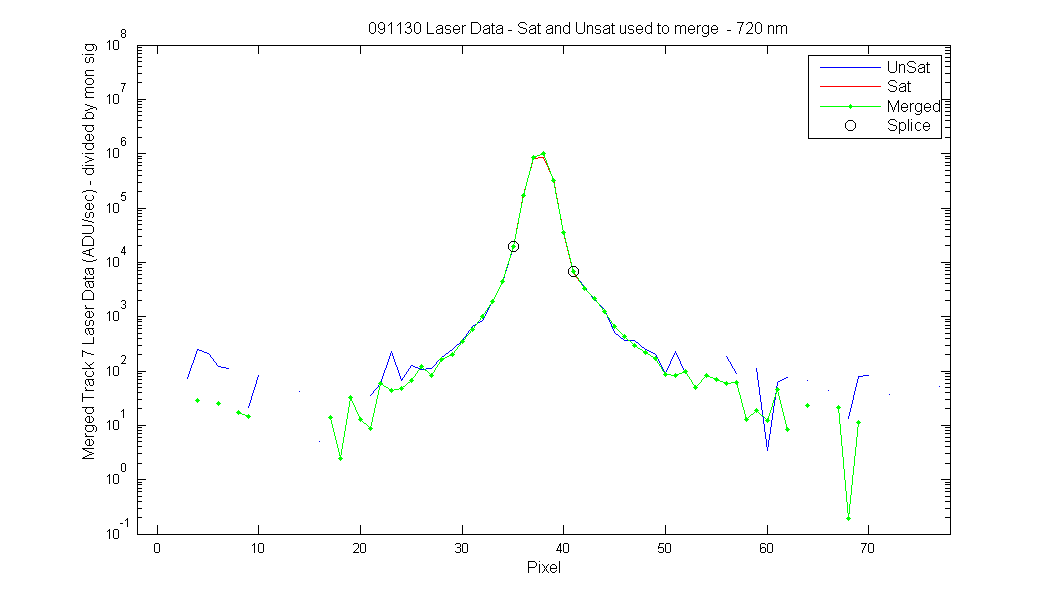
These show the "merged" saturated and unsaturated laser data. To merge the files I divide the sat and unsat data by its monitor signal. I then cut off the top of the unsaturated peak at plus or minus 4 pixels from the peak and stuck in on the saturated data. Notice the artifact peak shows up slightly in the laser data.
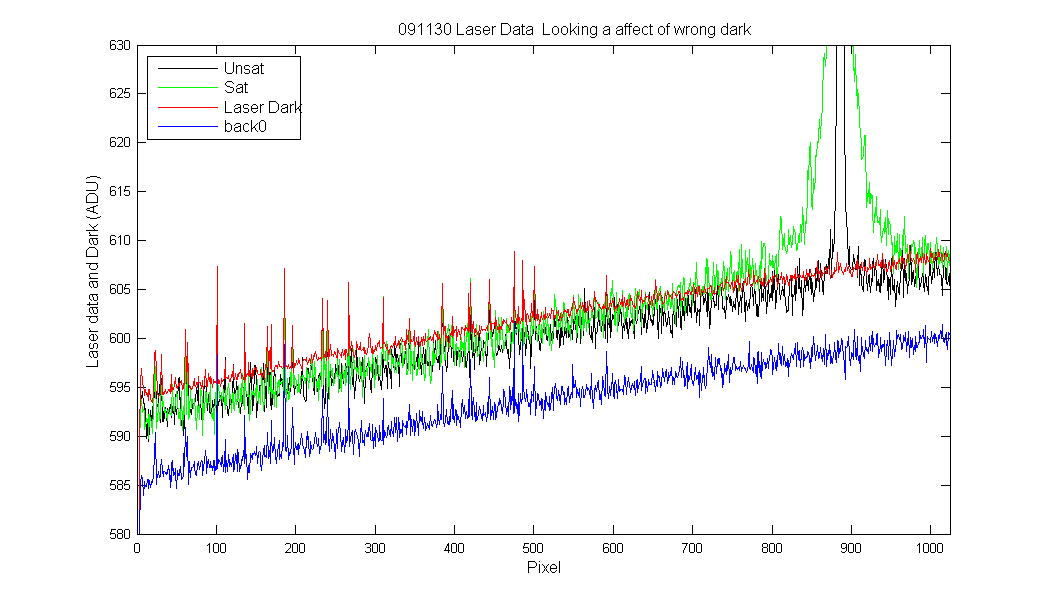
NOTE: I have changed the dark used on this data to the back1 file collected on 20 Nov 2009 The SIRCUS_550_27 file previusly used were higher than the light scans at the edges making them negative. All the "dark" scan collected during the laser work are higher than the light scans , they were also collected with 10 accumulations. Could this make them higher? Not sure but the back0 file makes the data look much more resonable.
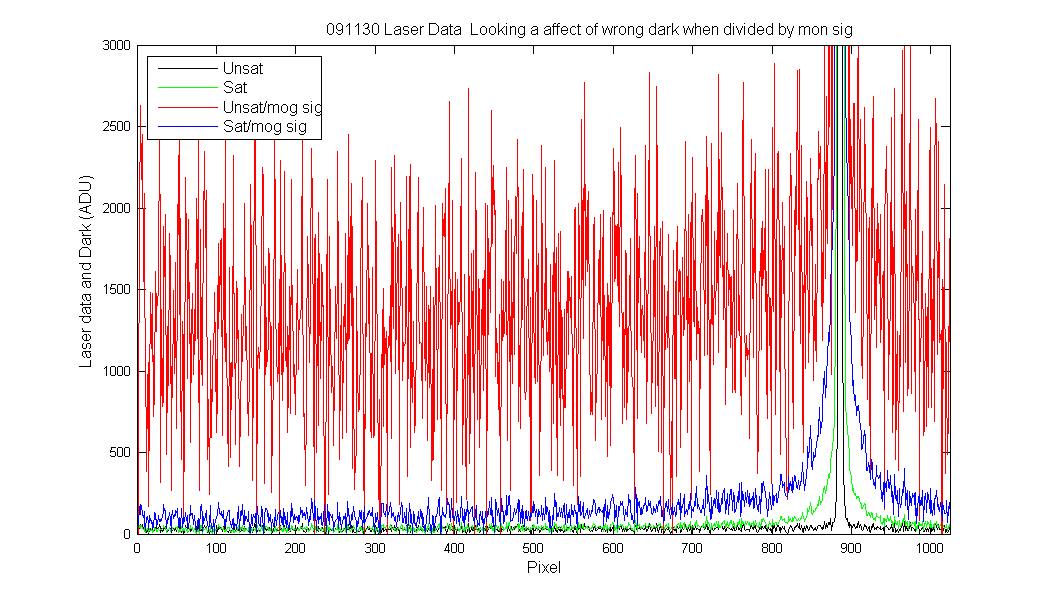
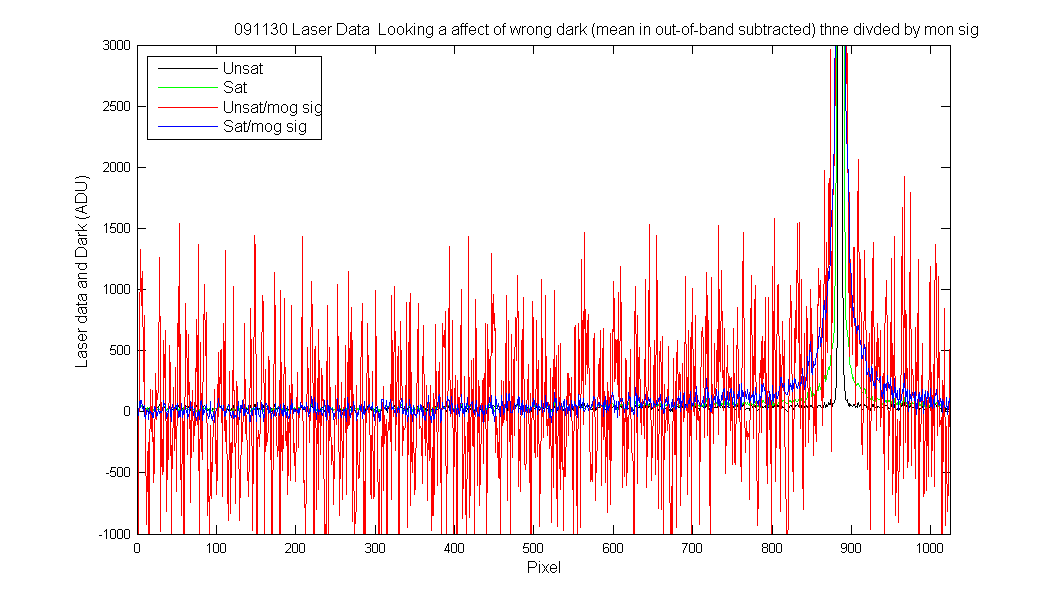
NOTE 21 Feb 2010: After talking to Al Parr I noticed I was using the wrong darks back.mat had a inttime of 1 sec and we need back0 which is 0.1 sec. When we looked at the saturated and unsaturated data after the darks subtraction and division by integration time the out-of-band area of the saturated and unsaturated data were right on top of each other with means of 28.7506 unsat and 29.5683 satuated data for pixel 1-400 and laser data 420 nm. This means no light was added by the increased power of laser to get the saturated data. But when we divided by the laser monitor signal to get the saturated and unsaturated data on the same scale. The data on the wings was now higher for the unsaturated data than the saturated data. This made no sense to Al (or me). Al decided that this mean we did not really understand how the darks were working. So I subtracted off the mean value at pixels 6:20 for all the laser data. Now when we divide by the monitor signal the out-of-band is the same for both the sat and unsat laser. The graphs at the bottom.
Merged at plus or minus 4 pixels from peak
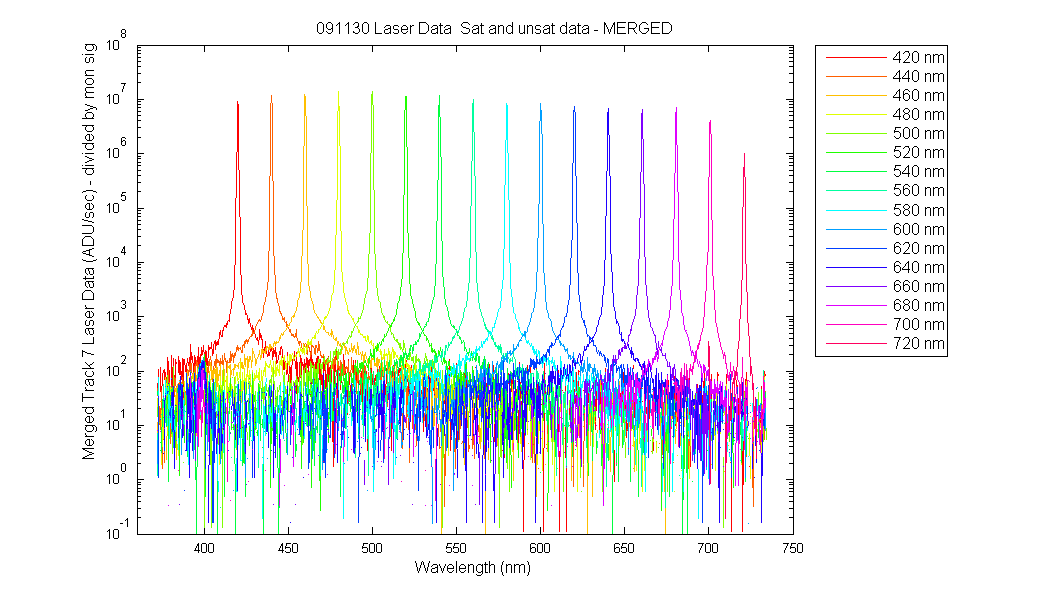
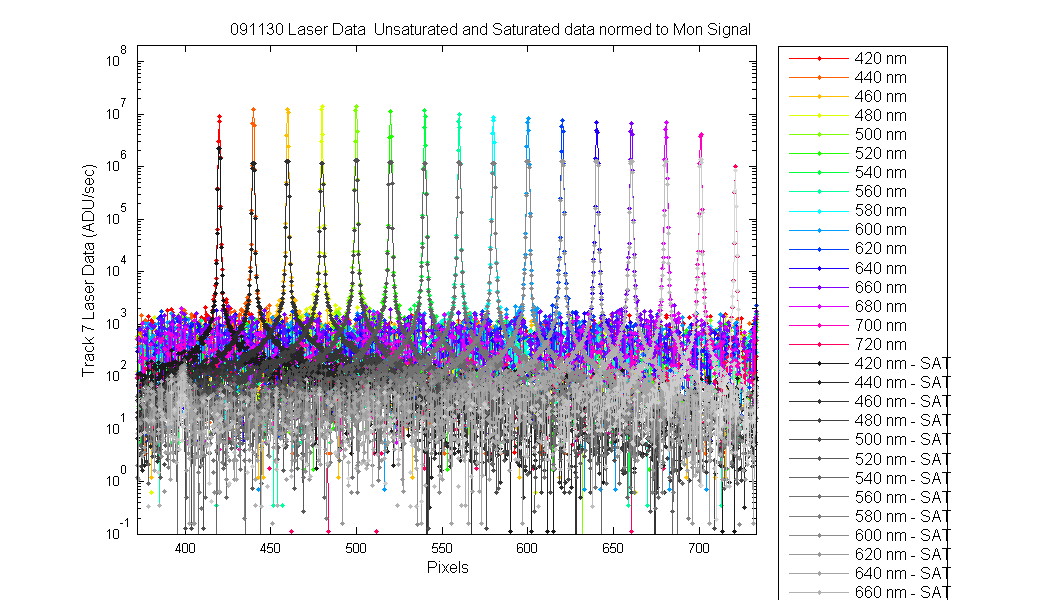
Individual files used to merge
OTHER
OTHER