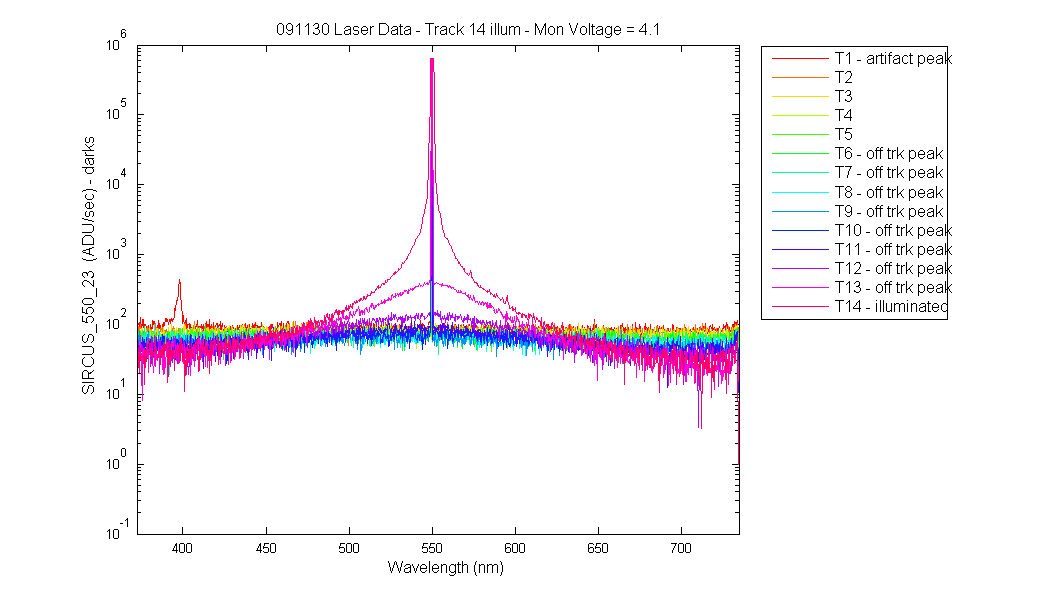
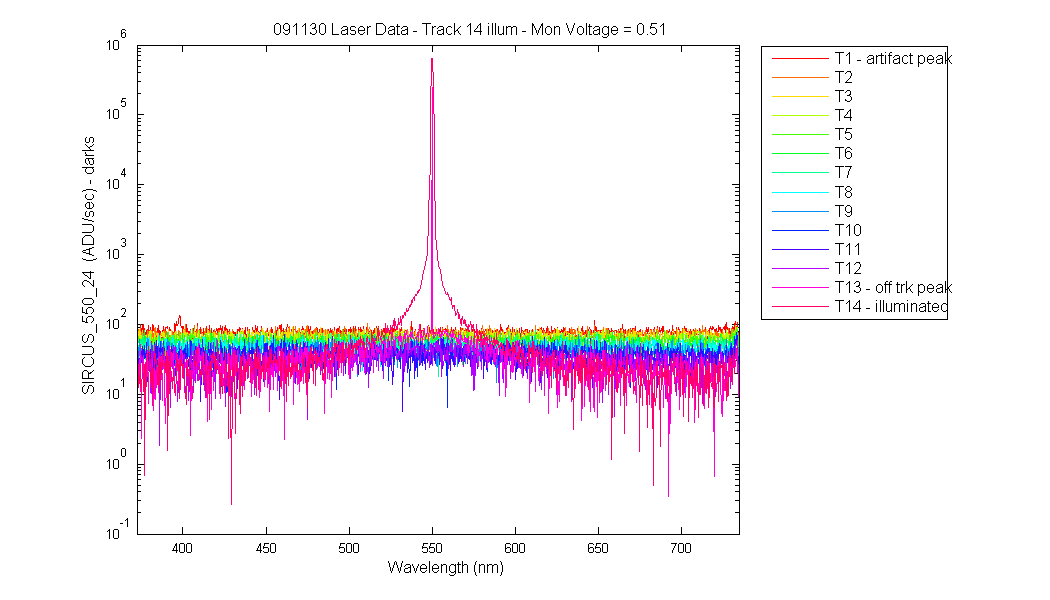
These graphs show and extra peak (bettween 390-400 nm) which should not be there when track 14 is illuminated at 550 nm. The first graphs shows the peak with higher monitor voltage (also note how many tracks have the main peak at 550 nm on them). The second graphs shows the same peak, smaller with the lower monitor voltage and only one track with alot of light from track 14. The last graph shows the darks used to subtract. All data is dark subttracted and divided by accumlations and integration times.
NOTE: I have changed the dark used on this data to the back1 file collected on 20 Nov 2009 The SIRCUS_550_27 file previusly used were higher than the light scans at the edges making them negative. All the "dark" scan collected during the laser work are higher than the light scans , they were also collected with 10 accumulations. Could this make them higher? Not sure but the back1 file makes the data look much more resonable.
Hi Mark,
I am still working on this ghost image problem. ĀI think it is a "double bounce" ghost reflection off of two refractive surfaces that then get imaged on the detector in the 0th order. ĀI will try to track down the culprits in the next day or two.
Mike
Artifact at 400 nm at two montior voltages and dark counts.