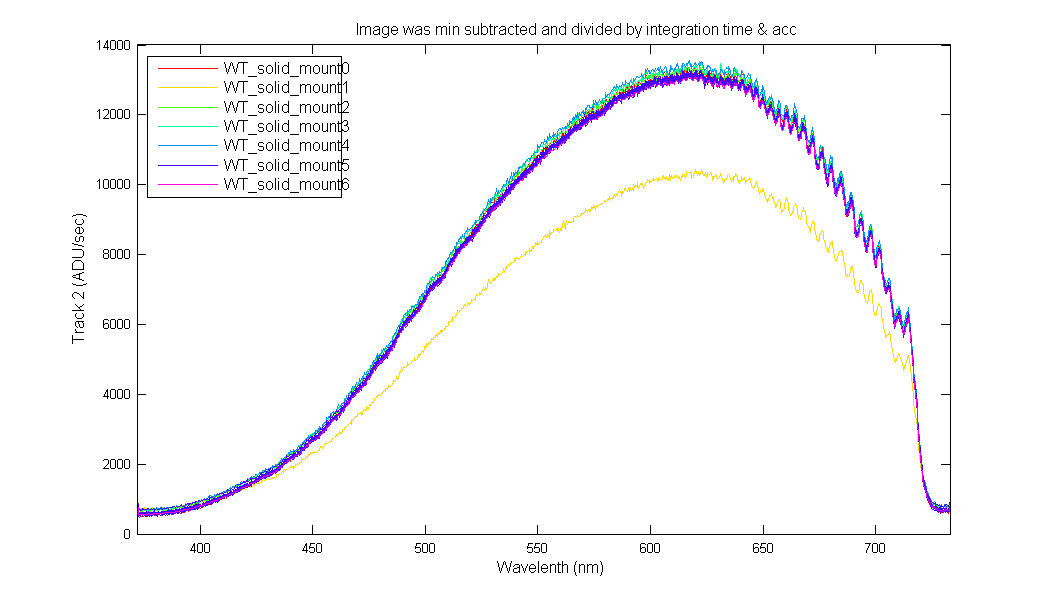
These graphs shows the affect on the spectral data when the fibers were bent. There are three experiements: WT_solid_mount, WT_brighter_source and WT_rand 0, there data are shown below.
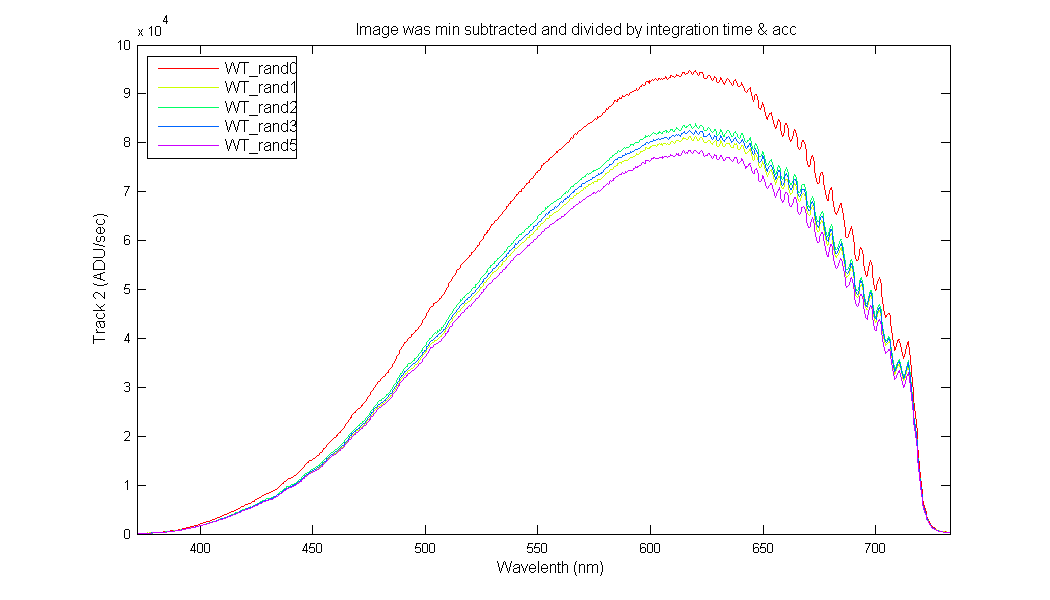
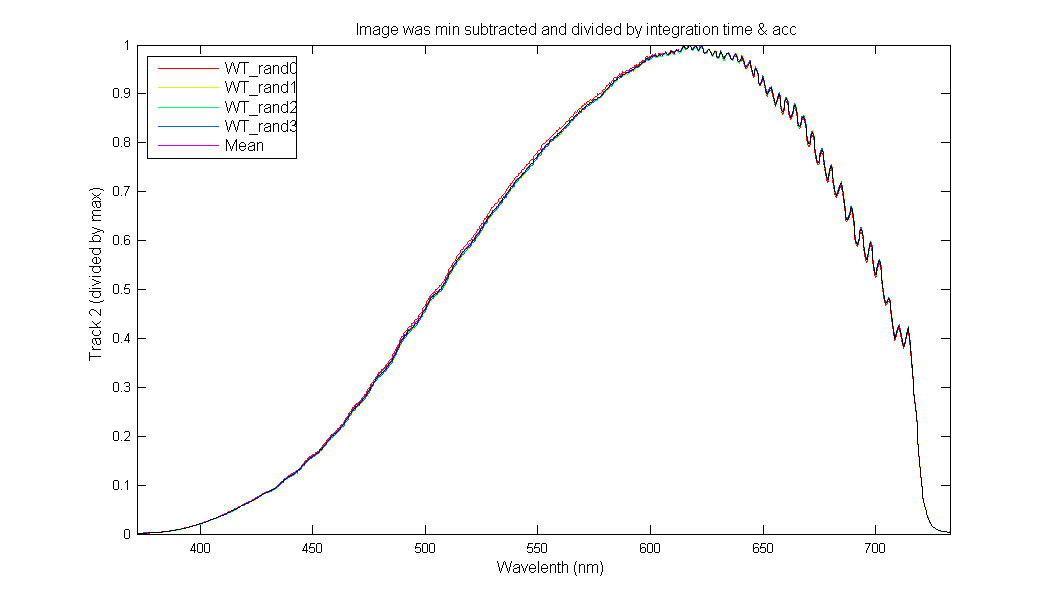
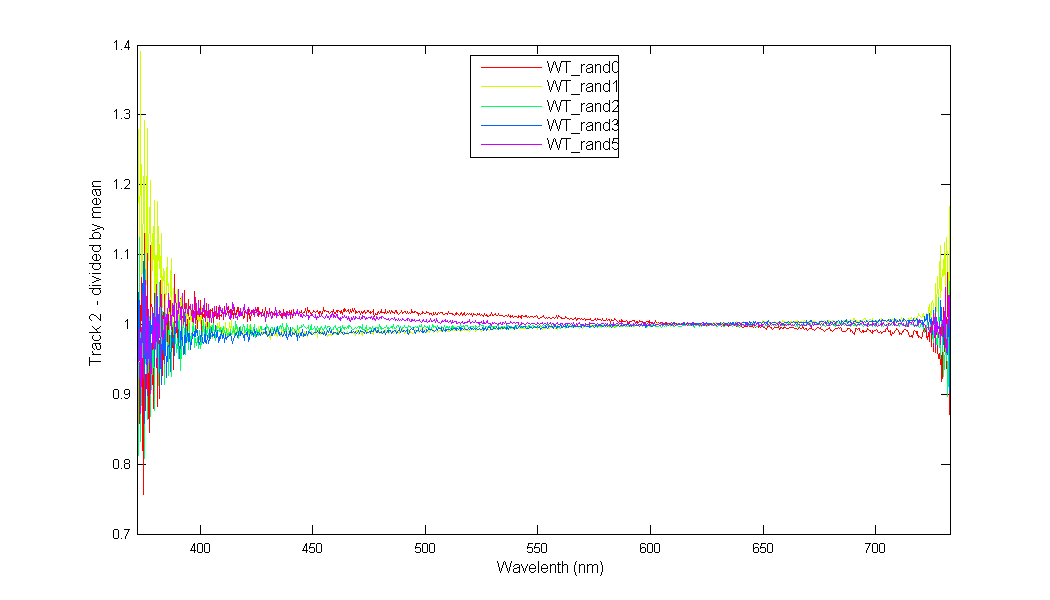
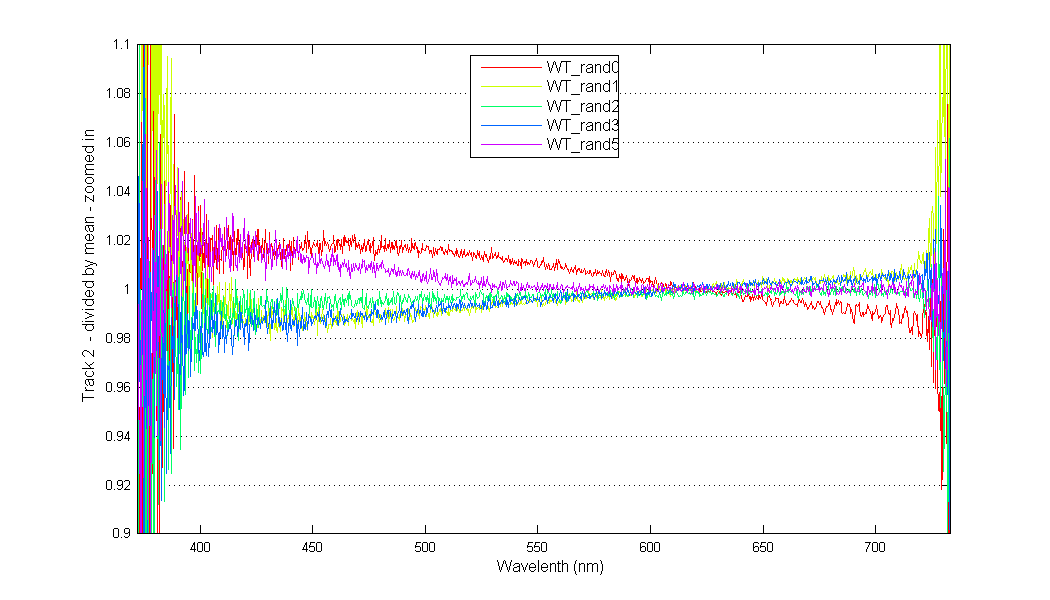
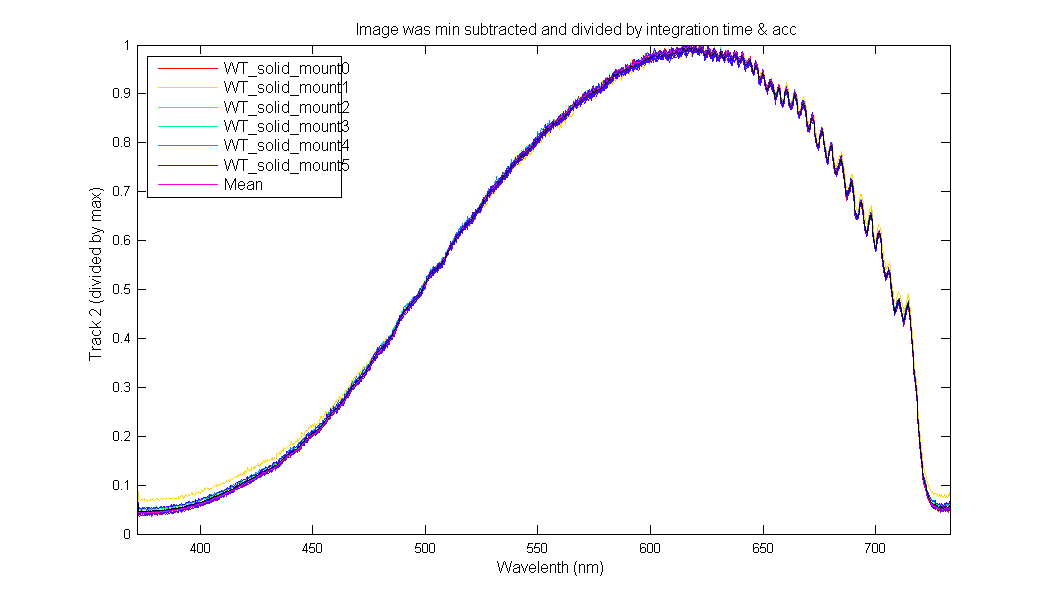
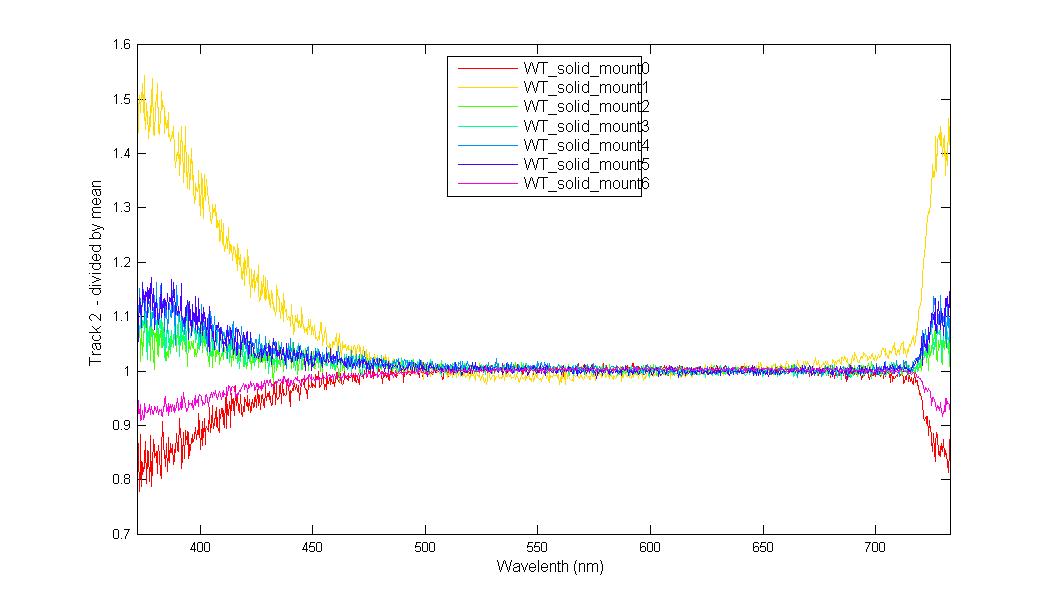
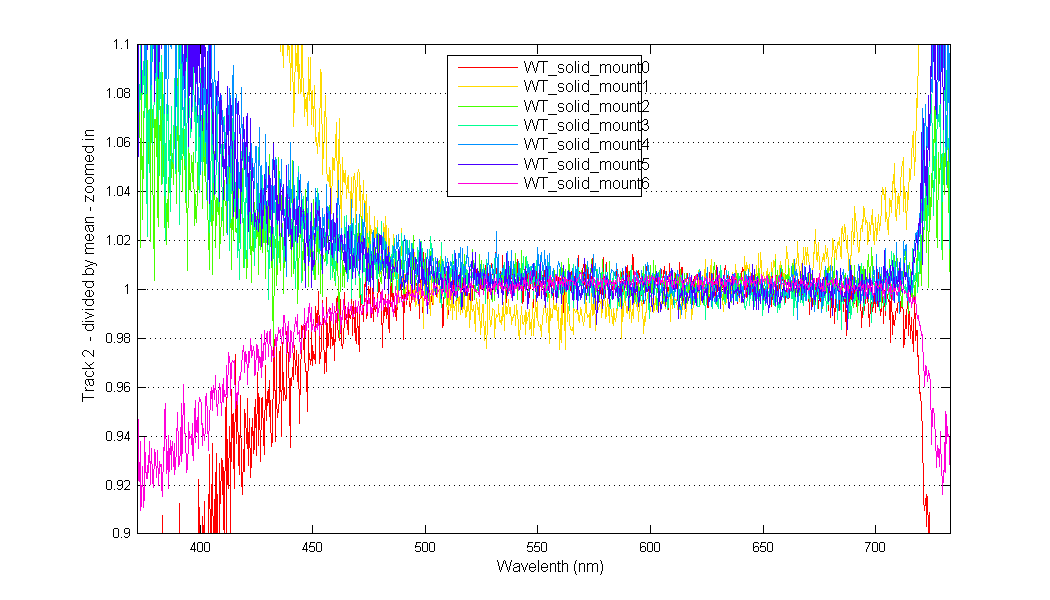
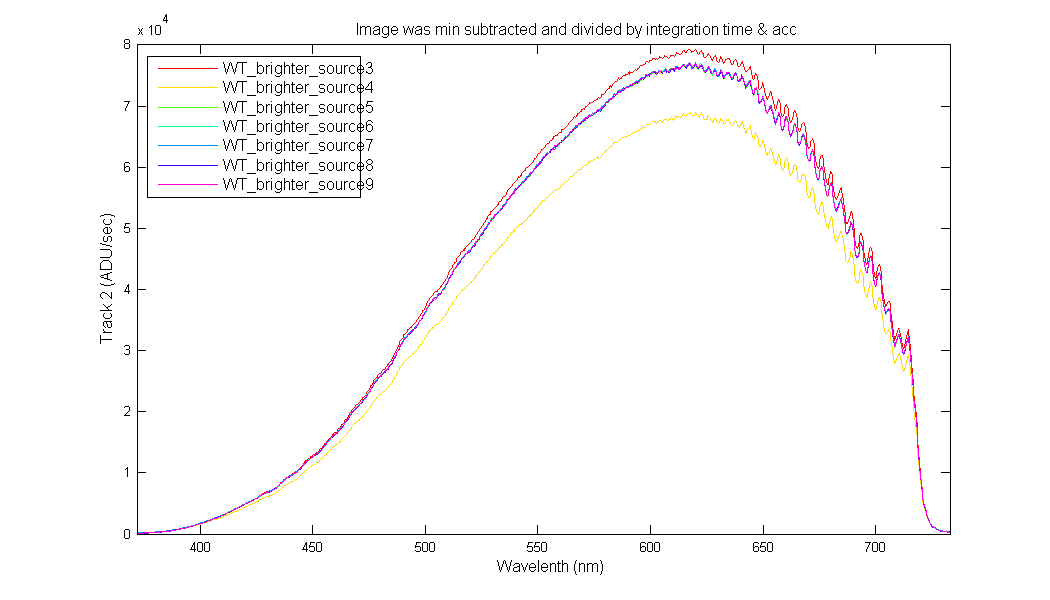
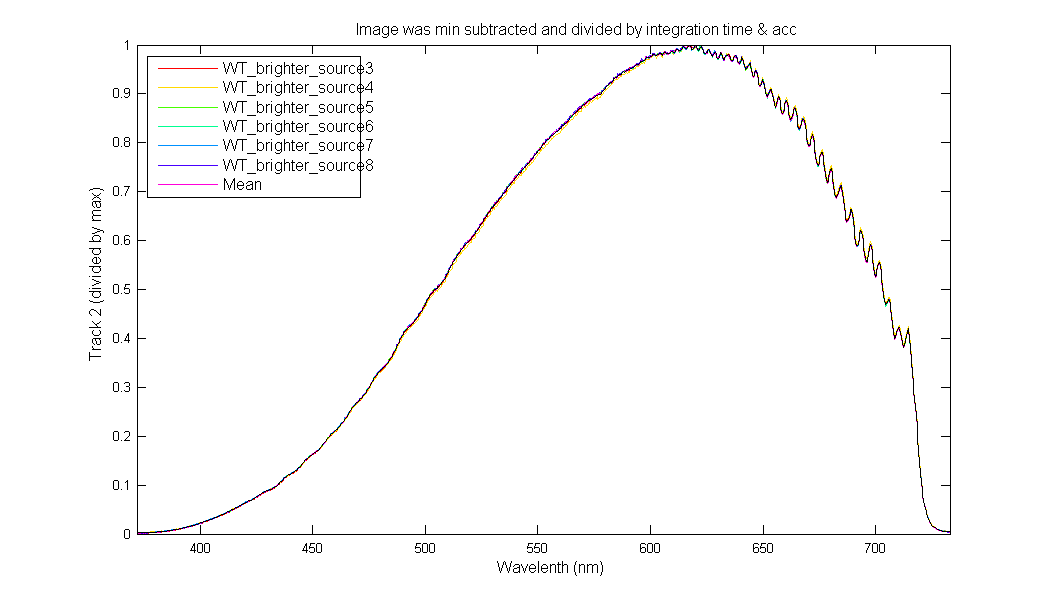
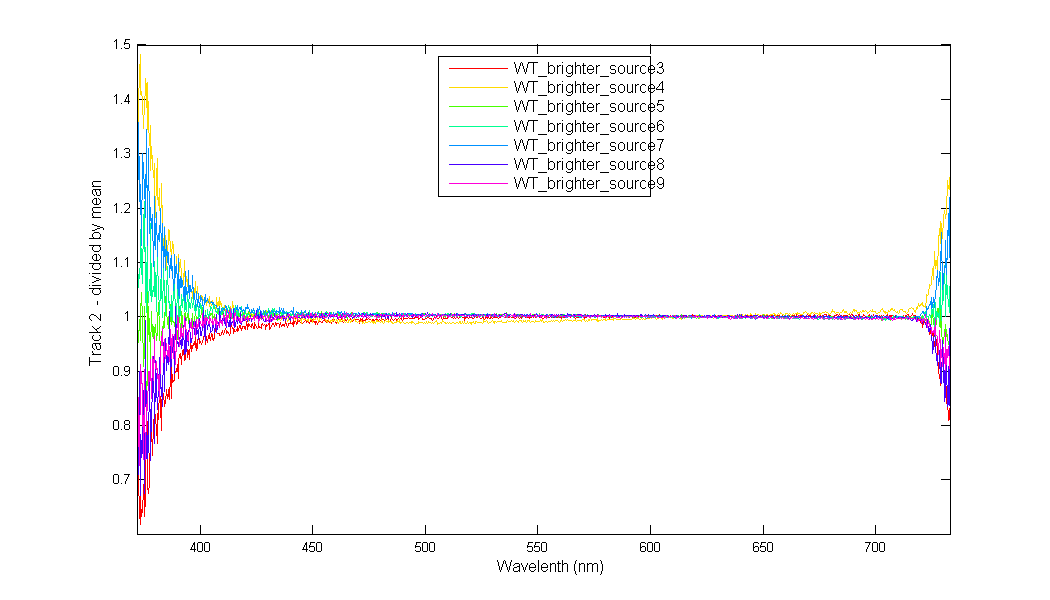
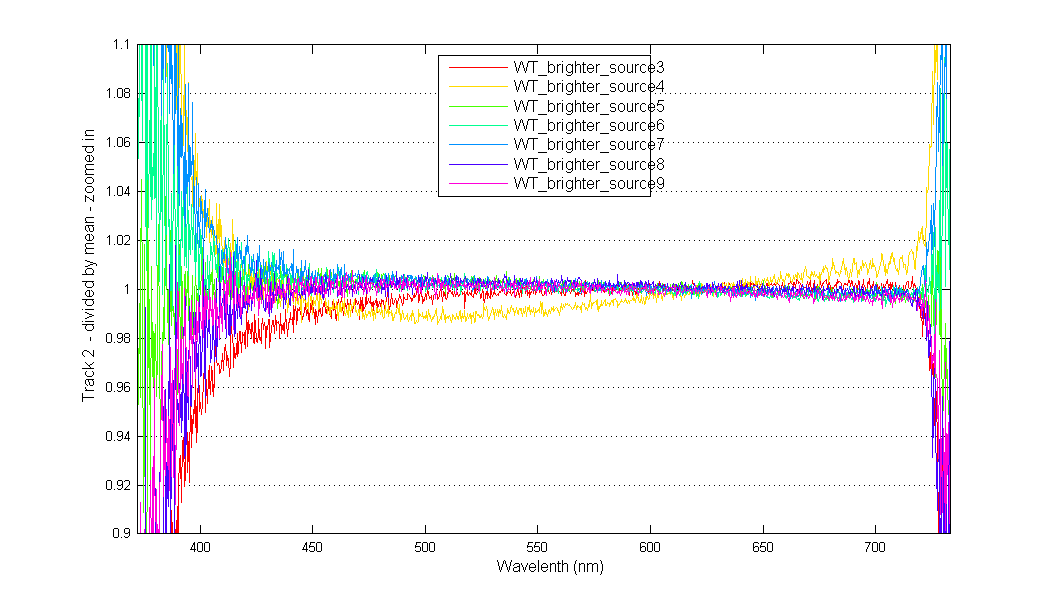
In each experiment there are 4 graphs. The first graph shows the data in ADU/sec so you can see the change in light levels with the benting. The second graphs is the data normalized to the max (ie removing the change in light level and just showing the shape change. The third graph shows the ratio of the data relative to the mean. The forth graph is a zoomed in view of the ratio graph to see the shape changes in areas with high light.
WT_solid_mount*
WT_solic_mount	0	initial configuraton, fiber on right side of mount
WT_solic_mount	1	big bend with post
WT_solic_mount	2	put back where it was
WT_solic_mount	3	small bend, fiber on left hand side of mount
WT_solic_mount	4	repeated 3 quickly, no change to fiber
WT_solic_mount	5	repeated number of images to 10 and moved fiber up and down 1 cm during acquisiton
WT_solic_mount	6	repeated accumulations to 10 and moved fiber up and down 1 cm during acquisiton
WT_brighter_source*
WT_brighter_source	3	starting over reference position on right of mount
WT_brighter_source	4	big bend using post
WT_brighter_source	5	repeat 3
WT_brighter_source	6	just keep taking images manually, checking source stability
WT_brighter_source	7	just keep taking images manually, checking source stability
WT_brighter_source	8	just keep taking images manually, checking source stability
WT_brighter_source	9	just keep taking images manually, checking source stability
WT_rand*
WT_rand	0	took out fiber and put it back and readjusted light
WT_rand	1	these were taken as Carol was putting gentle S curves with one hand
WT_rand	2	these were taken as Carol was putting gentle S curves with one hand
WT_rand	3	these were taken as Carol was putting gentle S curves with one hand
WT_rand	4	was a mistake
WT_rand	5	these were taken as Rand was putting in multiple bends with both hands