This is the second wavelength calibration (first on was done on 091120 by Carol and Bob). All the tracks had the same pixels for each HgPen wavelength. I do not do Mikes gaussian fit to each peak, which would likely give slightly different pixels asignments to each track.
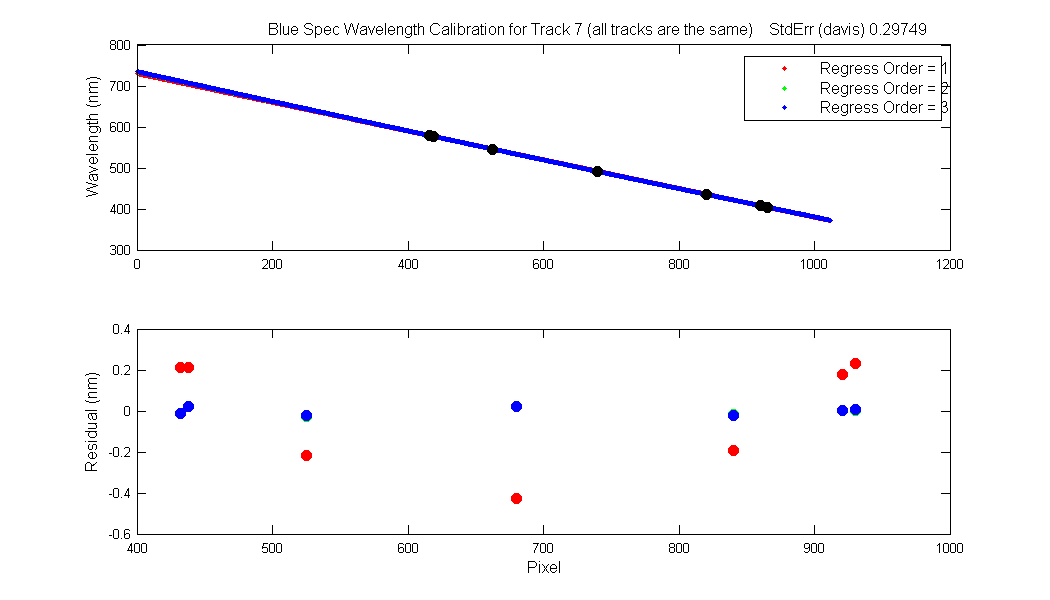
2nd order polynomial: [1.092718e-005 -0.3651134 734.8]
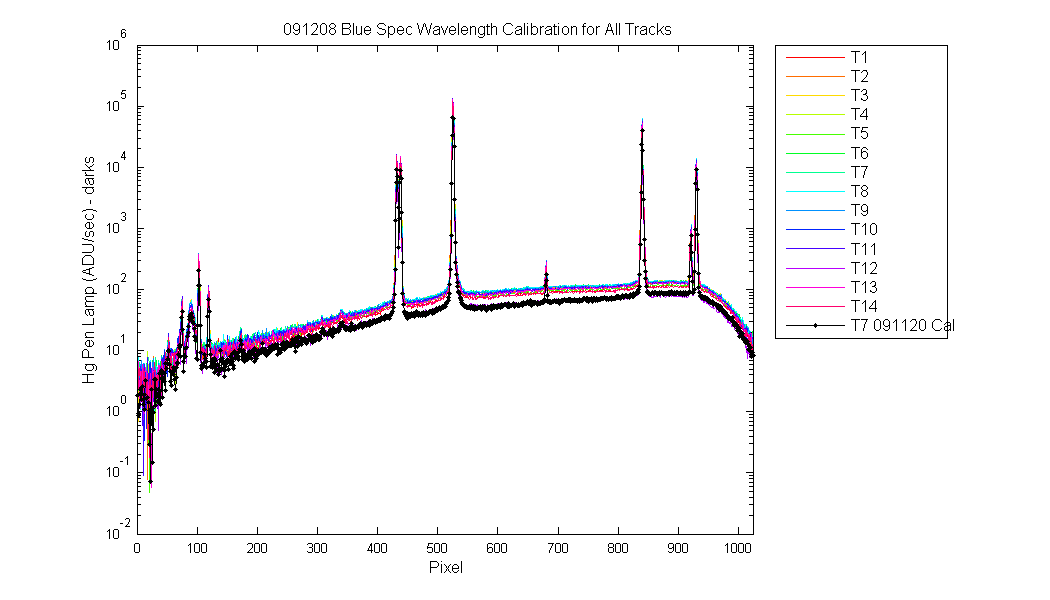
Pixels: [930 921 840 680 525 438 432]
Waves: [404.7 407.8 435.8 491.6 546.1 577 579.1]
Wavelength Min and Max: [372.3819 734.4349]
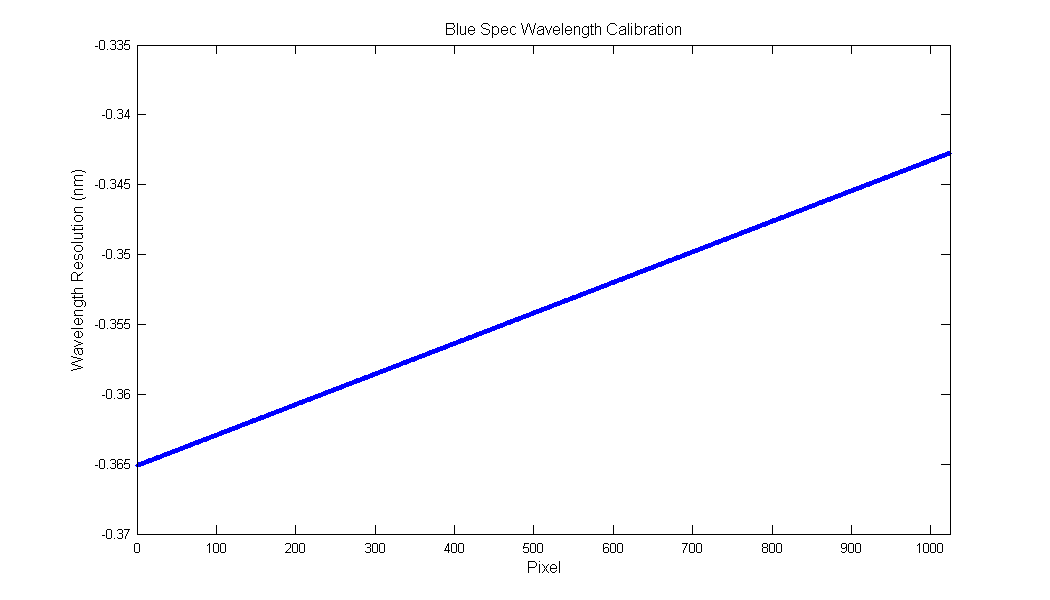
Resolution in nm: [-0.35391]
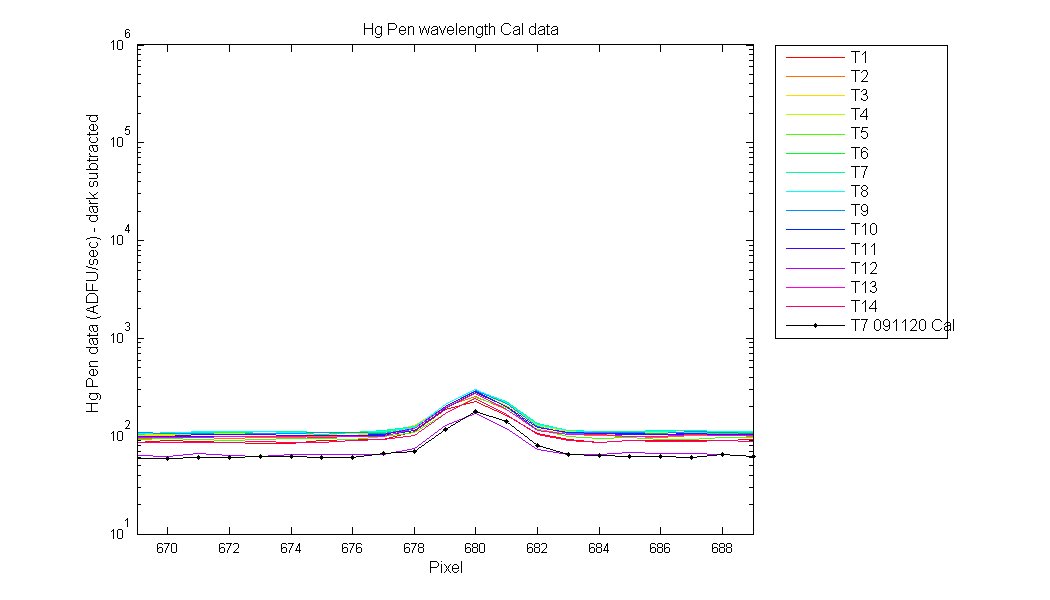
All three data sets. Why does the shape look so different for 1 sec??
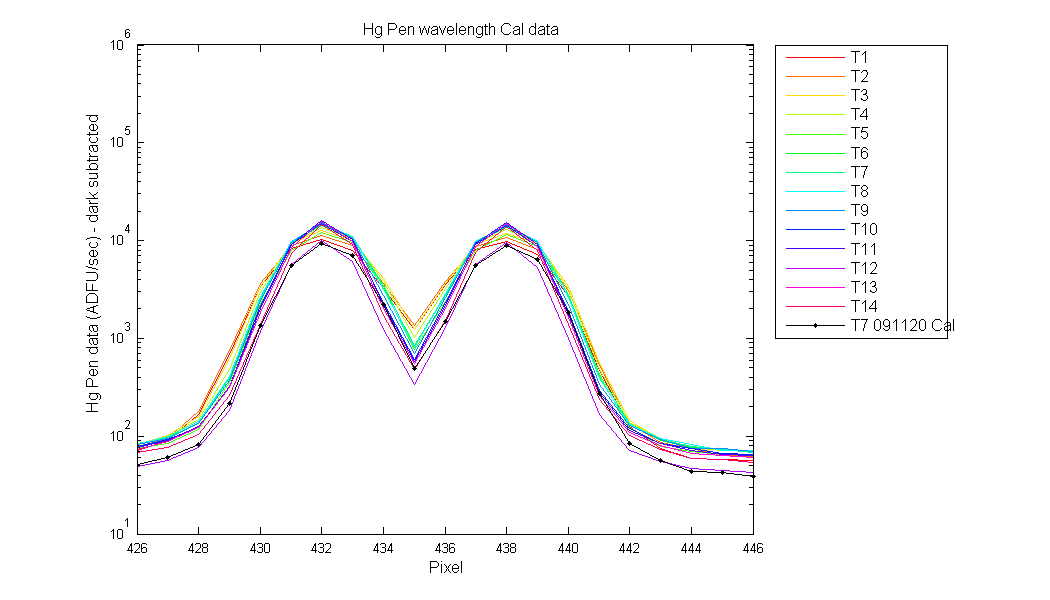
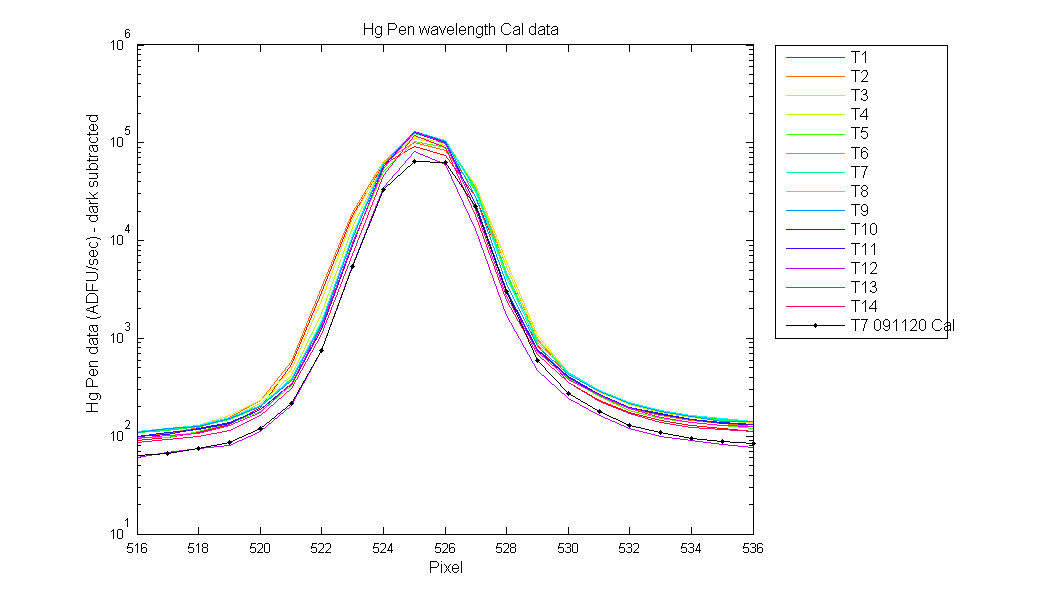
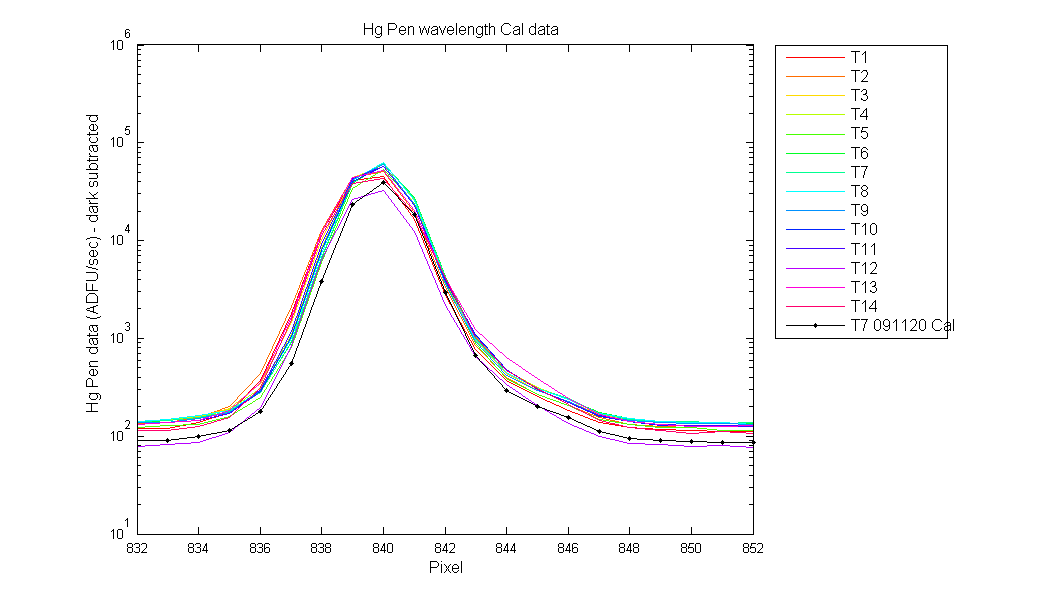
Zoomed in view of each peak
Wavelength regression
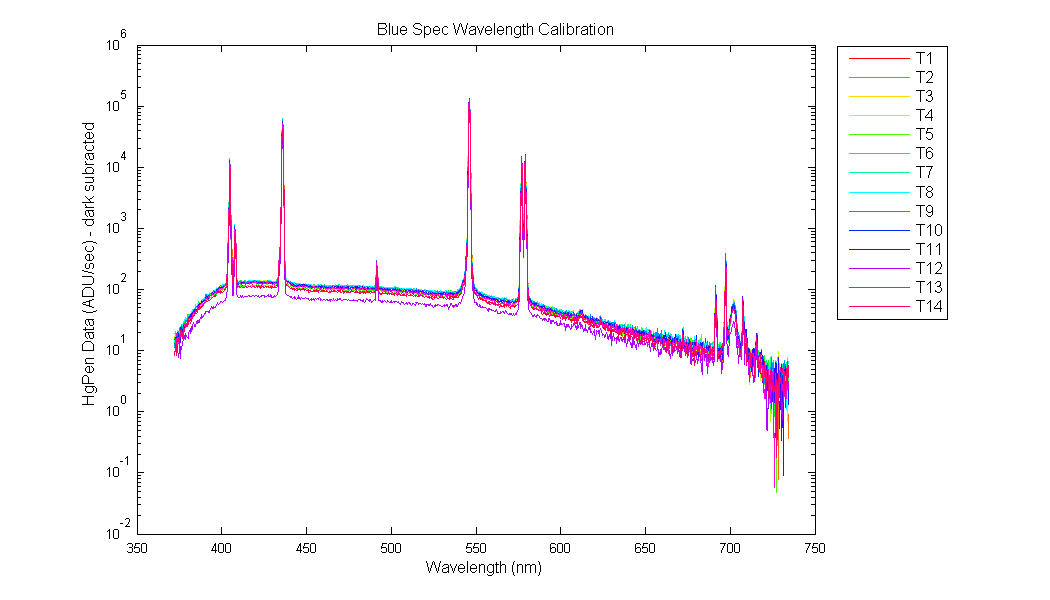
HgPen data verse Wavelength
Resolution Graph