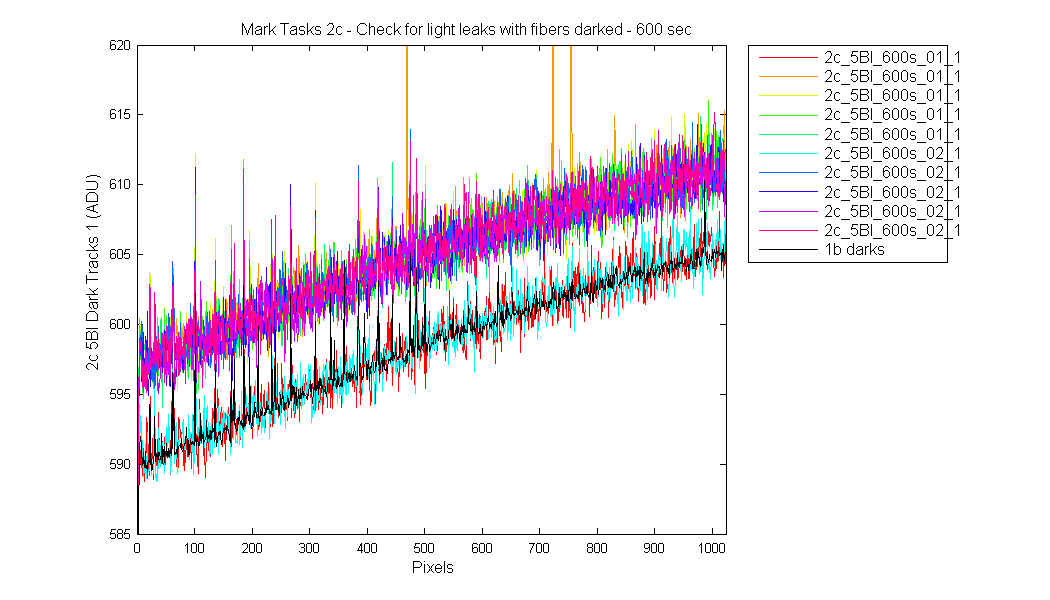
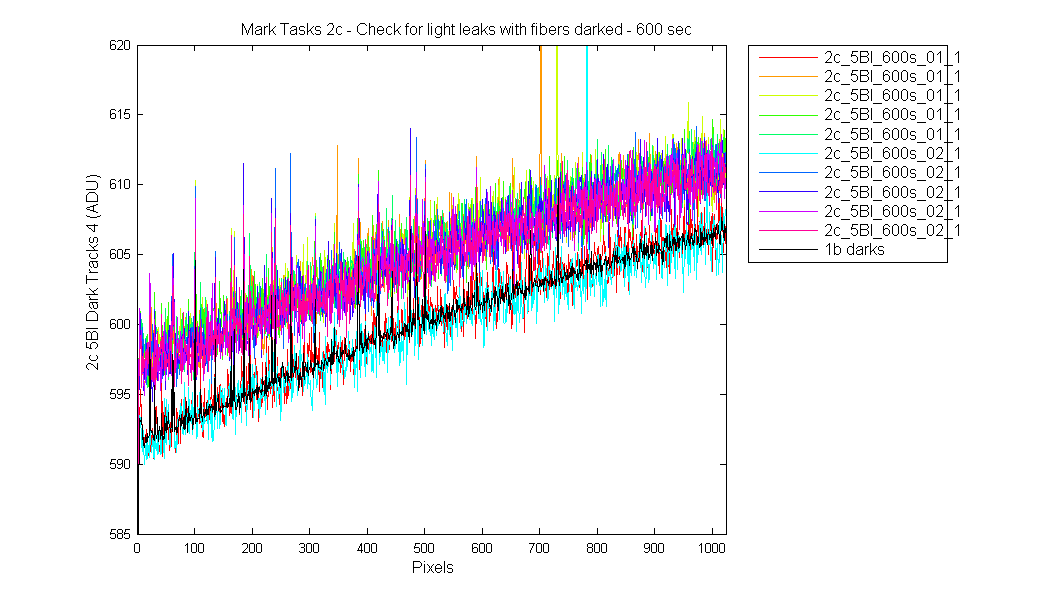
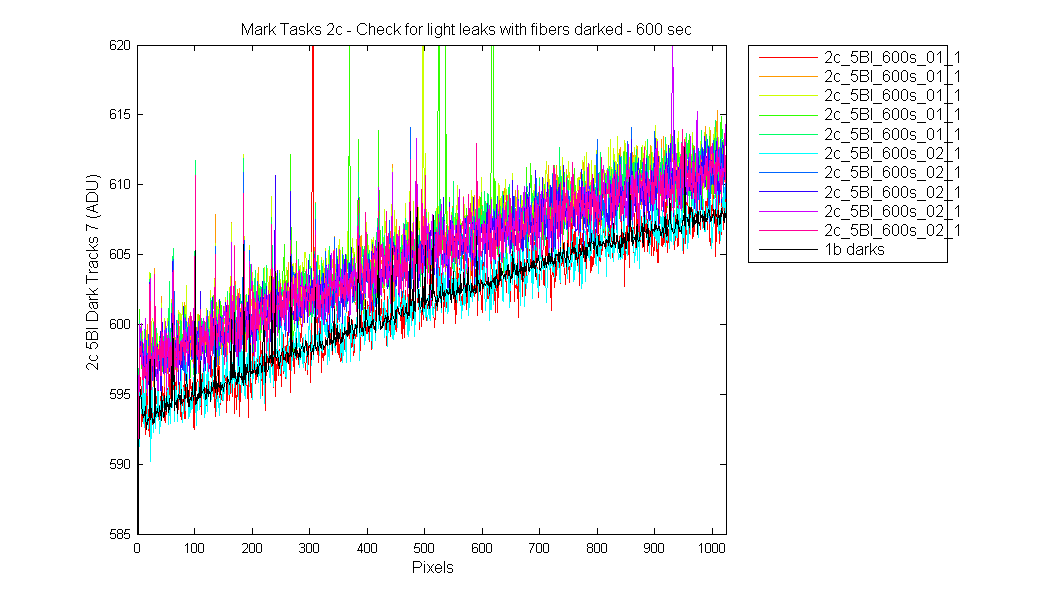
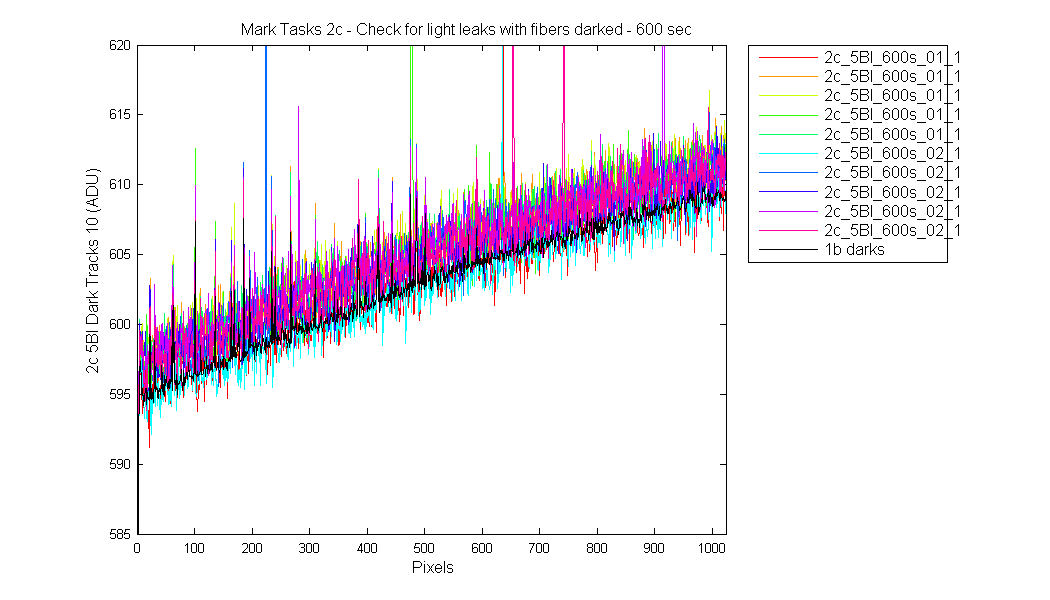
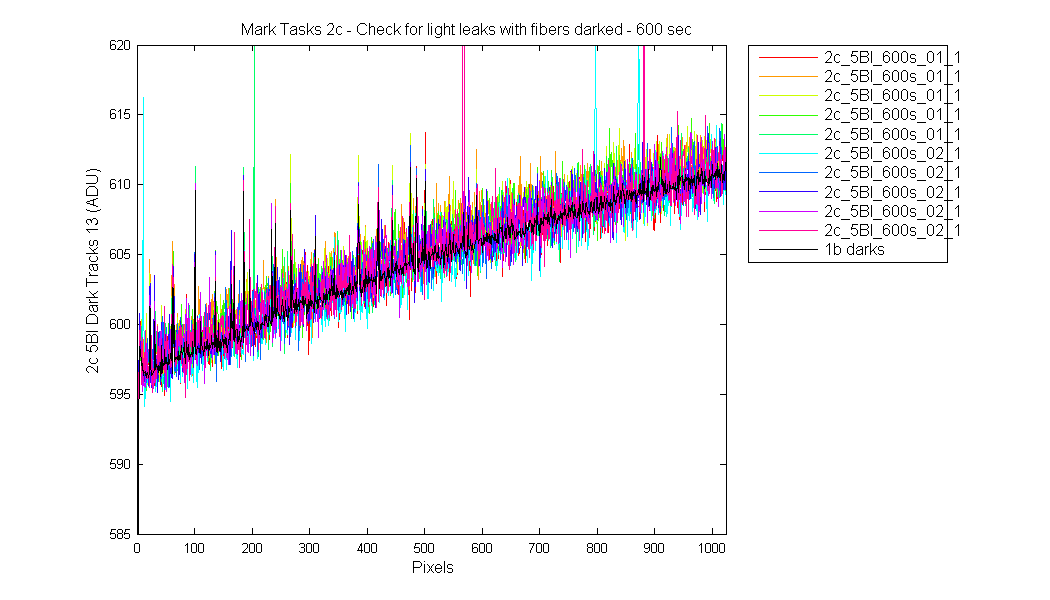
These graphs should show light leaks with fibers darked - 2c - 600 sec . See excerpt from Tasks doc below.
These darks were taken a 5 frames in one file and with a integration time of 600 sec.
Tests 1 and 2 below should be done each time the setup is moved or significantly reconfigured, though in the future only one or two long integration time FDI scans would likely be required to confirm the absence of light leakage.
Analysis: eiii, 2c should be similar to 1b
Note that in these graphs, the first image/frame from each file (red and cyan line) are lower than the following images!
The black line is the 1b dark, which was collected wth just one image/frame in the file. The question is why is the first
frame of the darks lower. Is this a cleaning issue?? Ie would doing a clean between frame help?
Notice also that is affect decrease from track 1 to track 14??
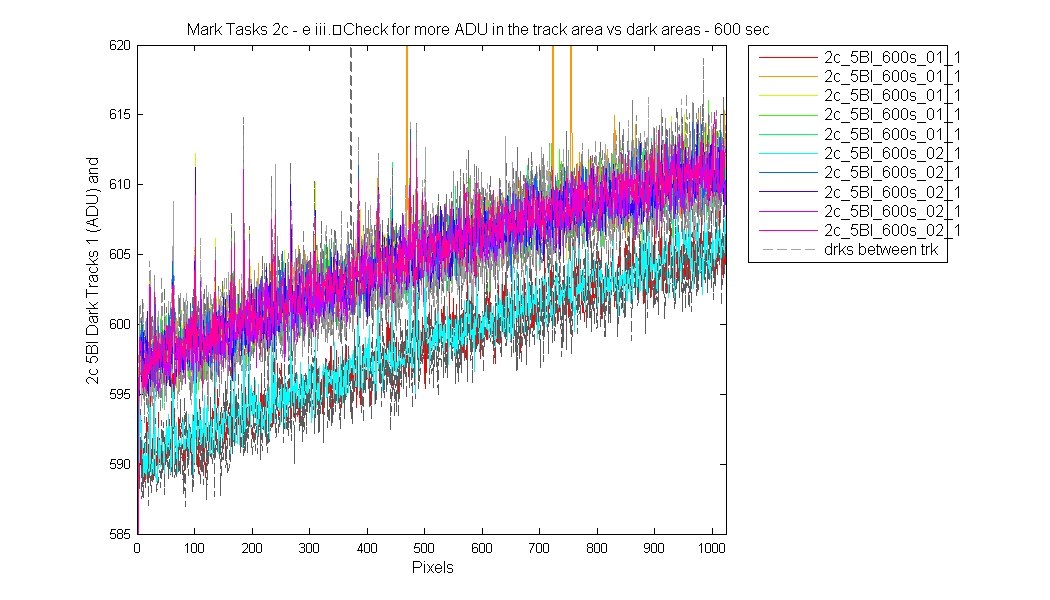
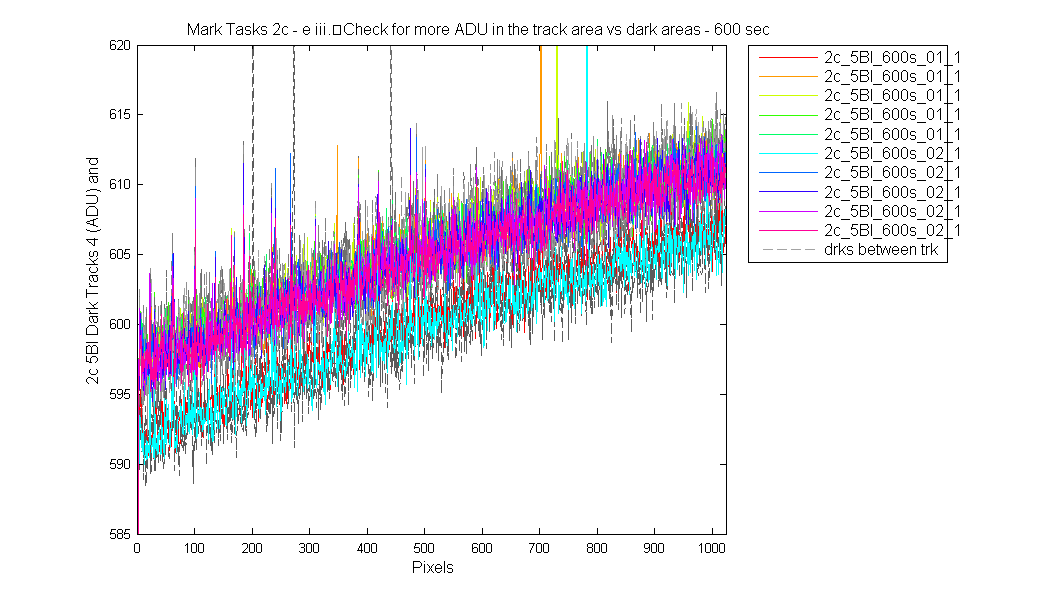
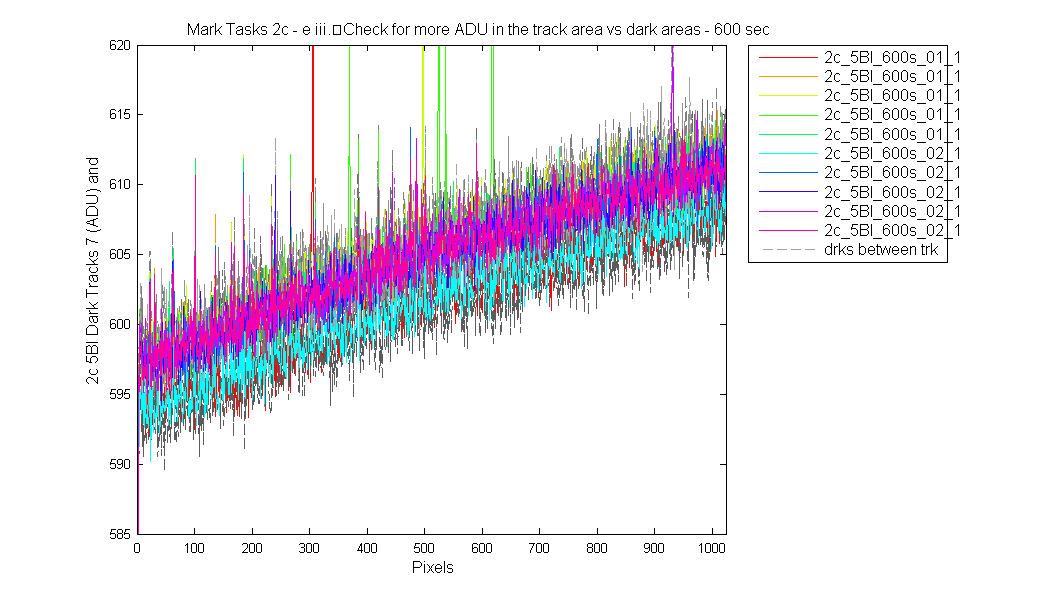
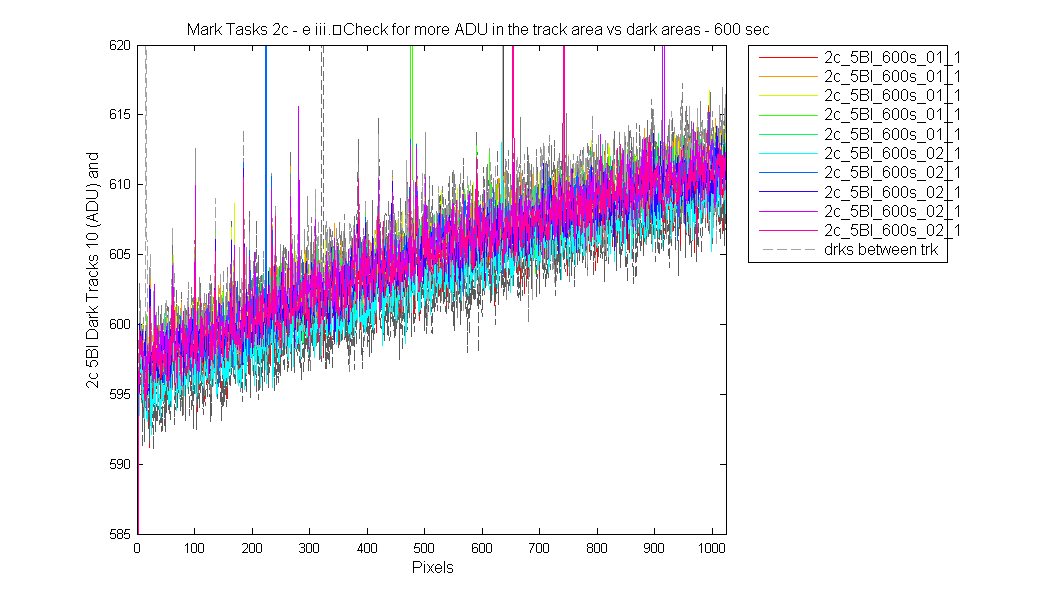
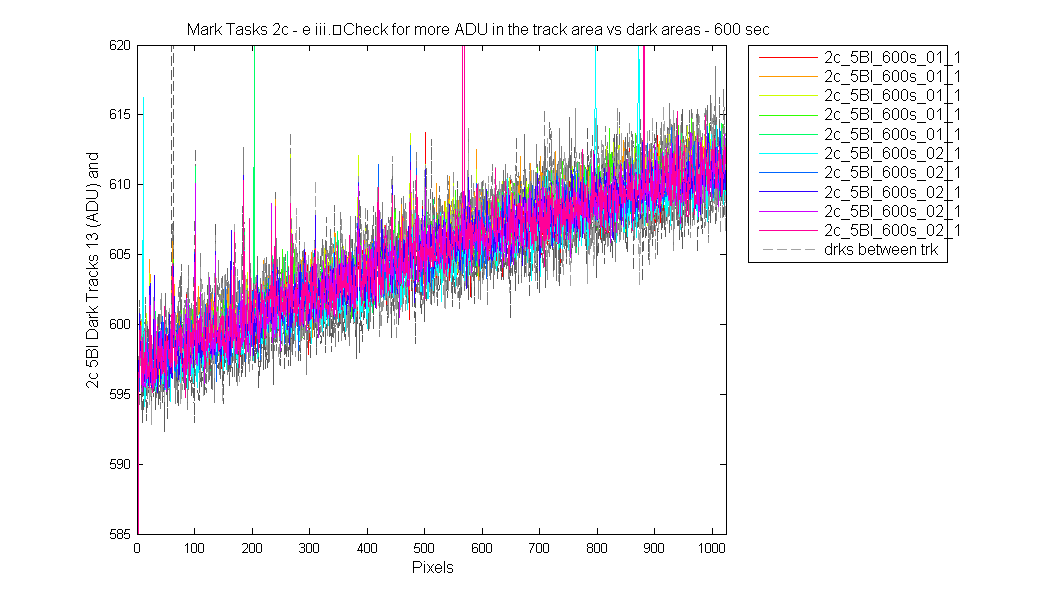
Analysis: eiii, Check for more ADU in the track area vs dark areas using the 600 sec 2c data.
The gray lines are the dark tracks between the light tracks. Normally I only use one row of pixels between
the light tracks but that created very noisy data. So I meaned 19 pixels around the between dark tracks. Looks
pretty good.