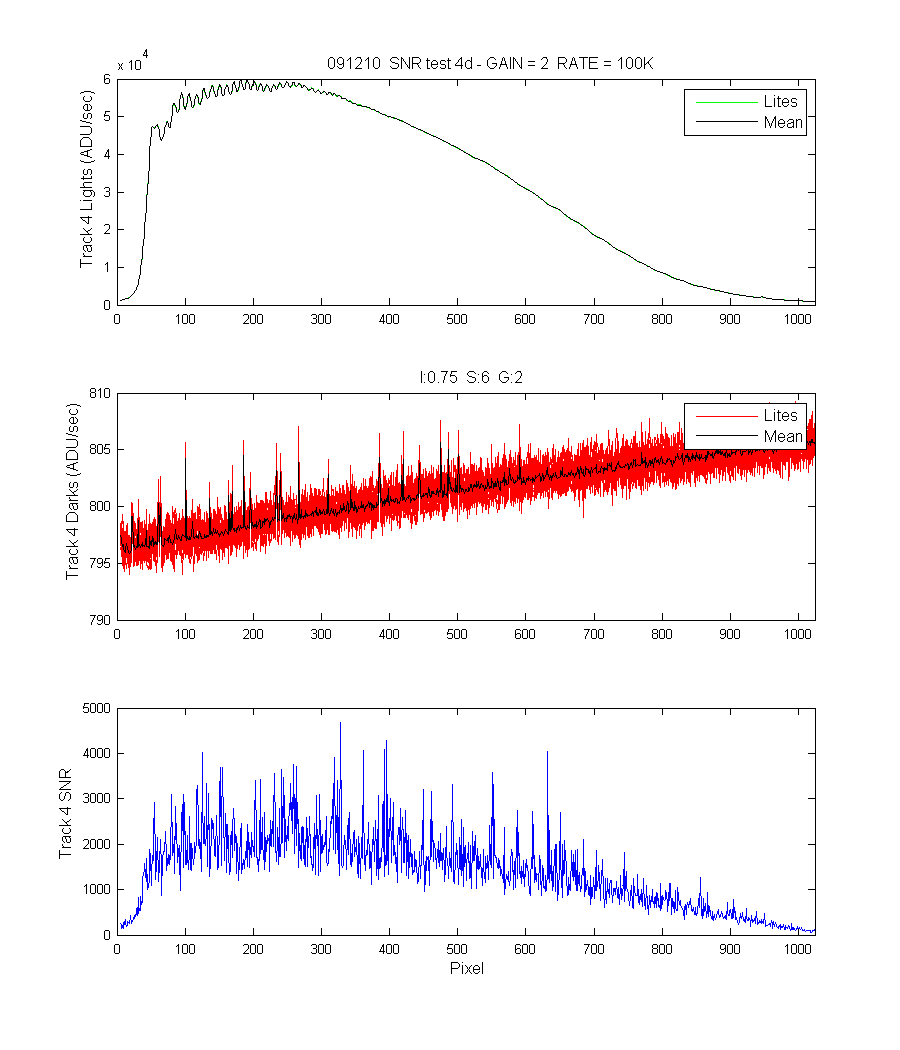
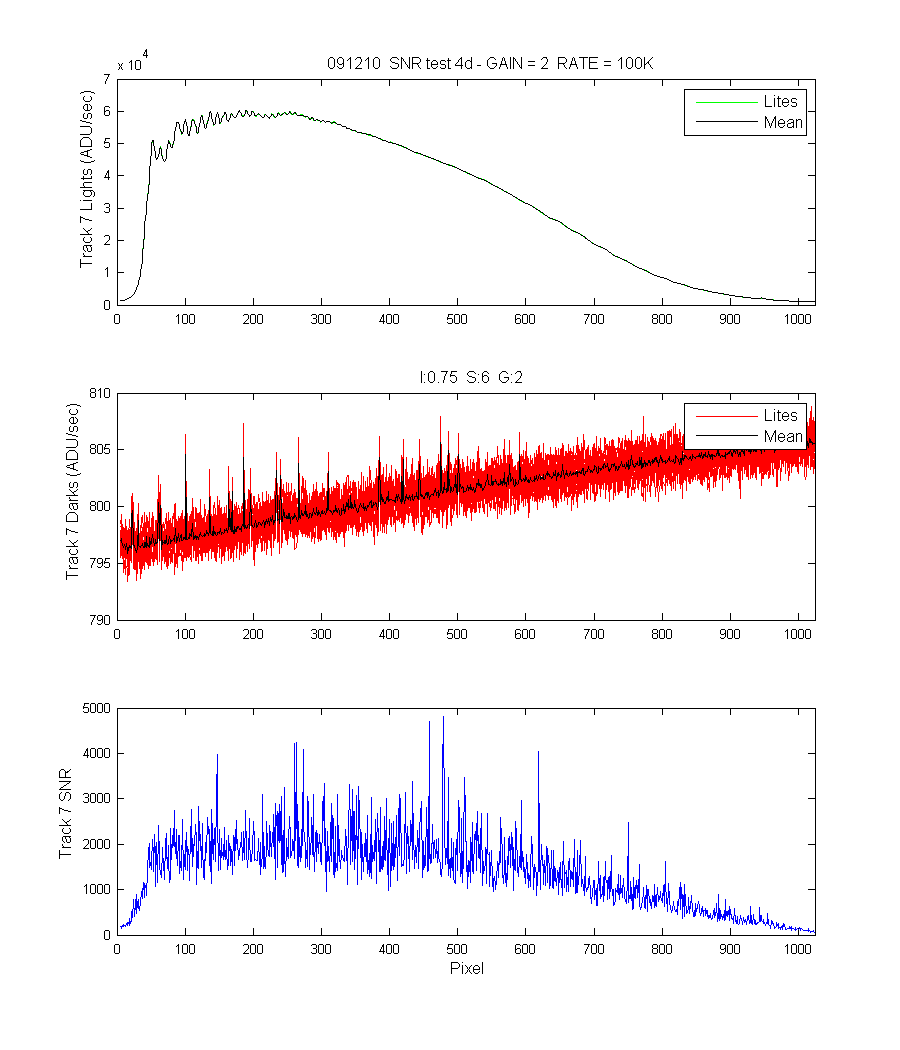
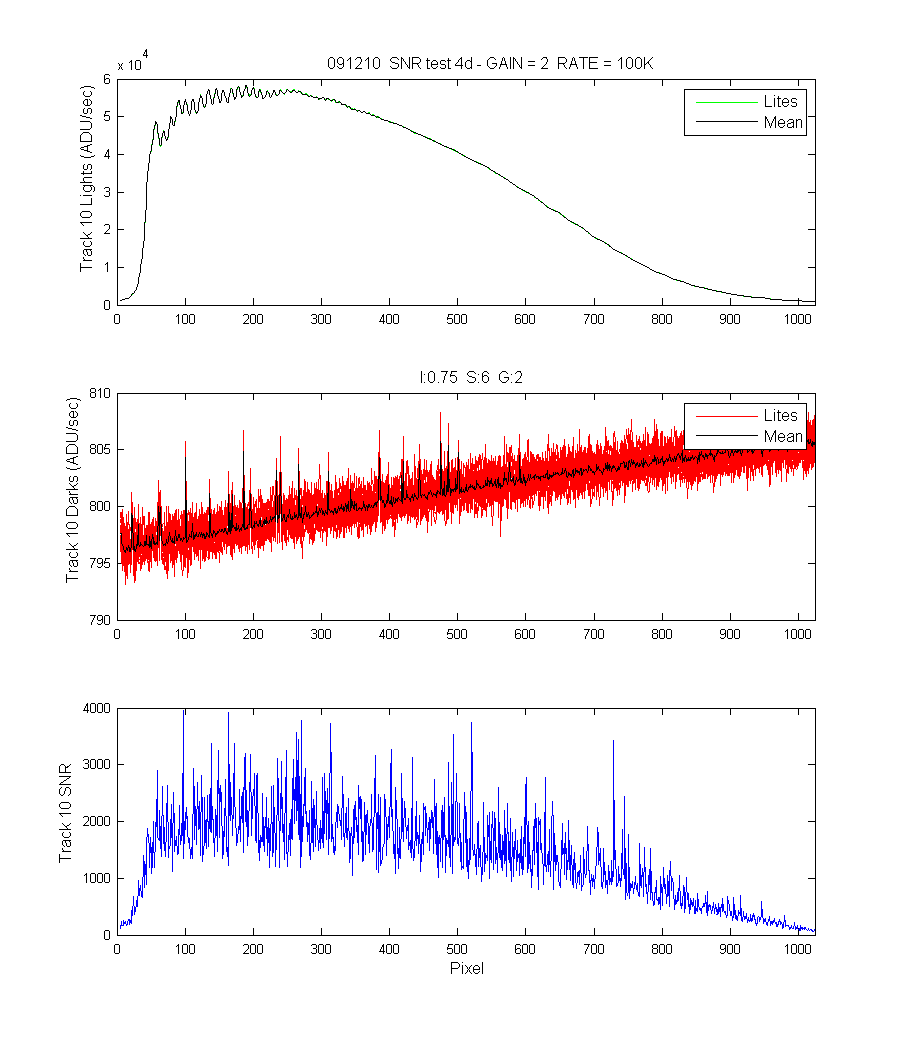
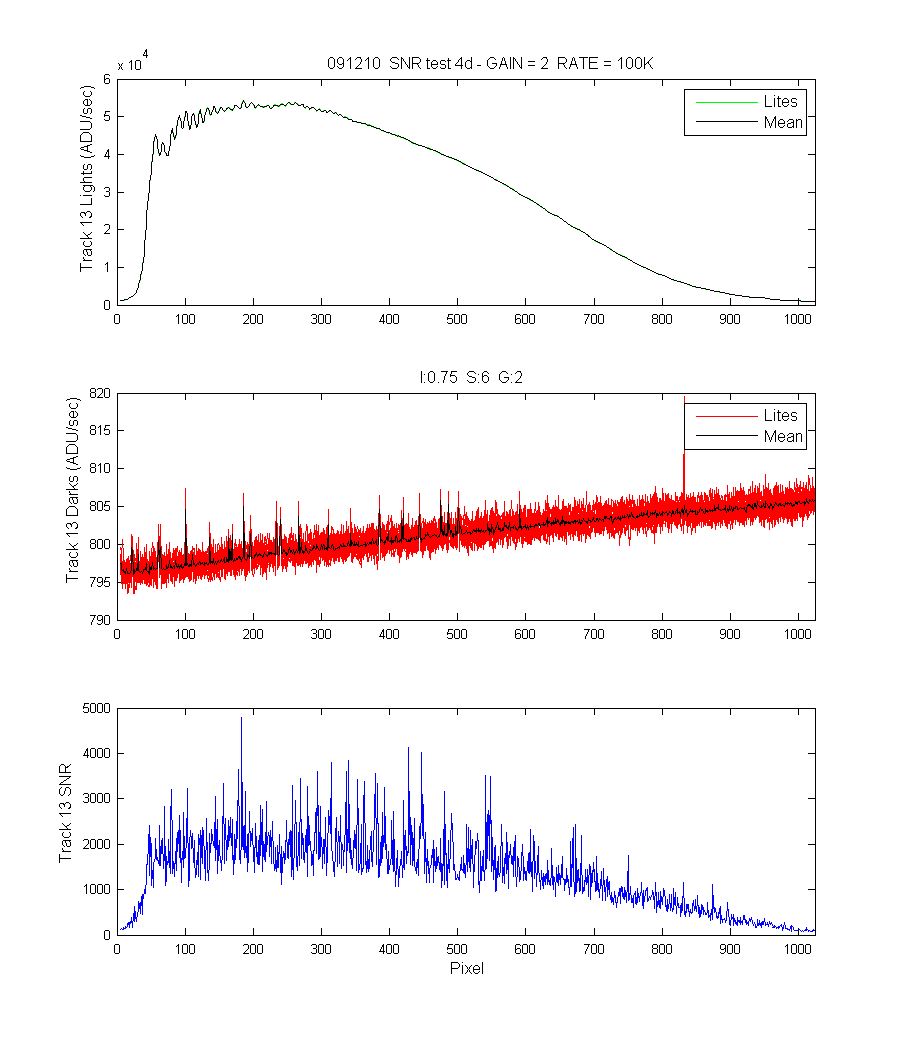
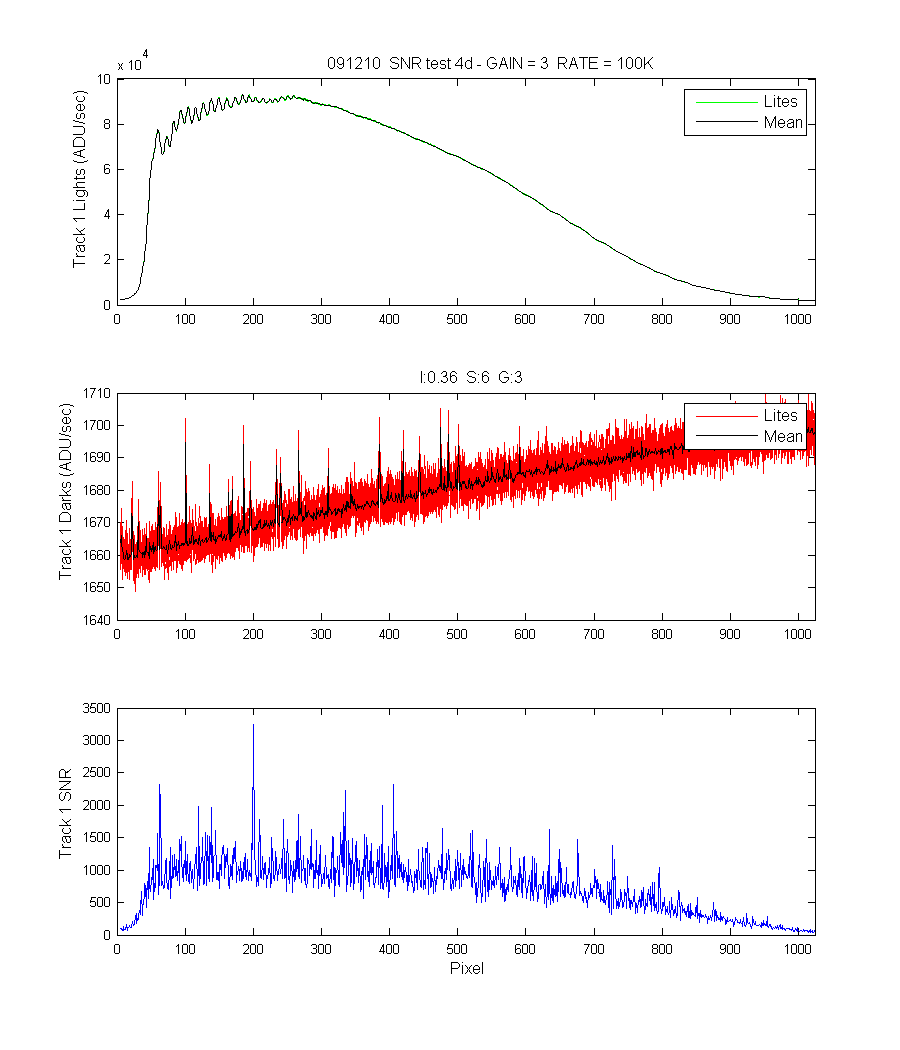
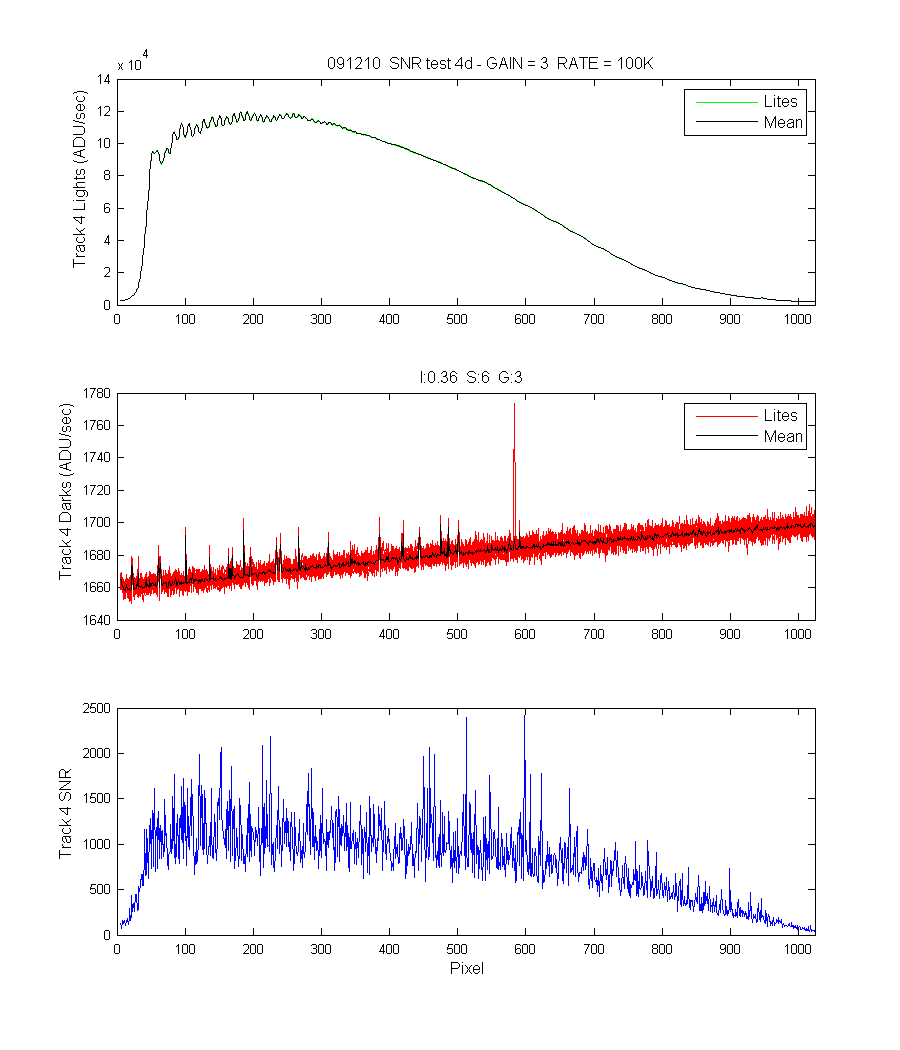
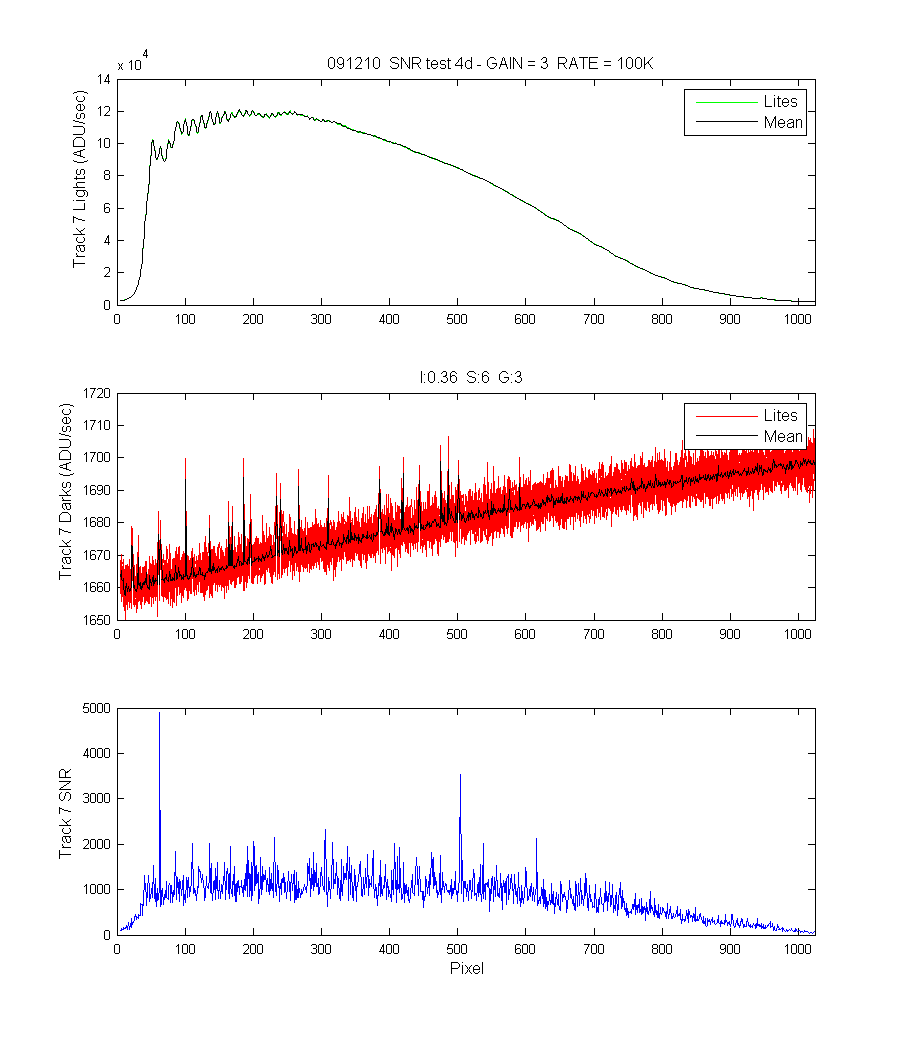
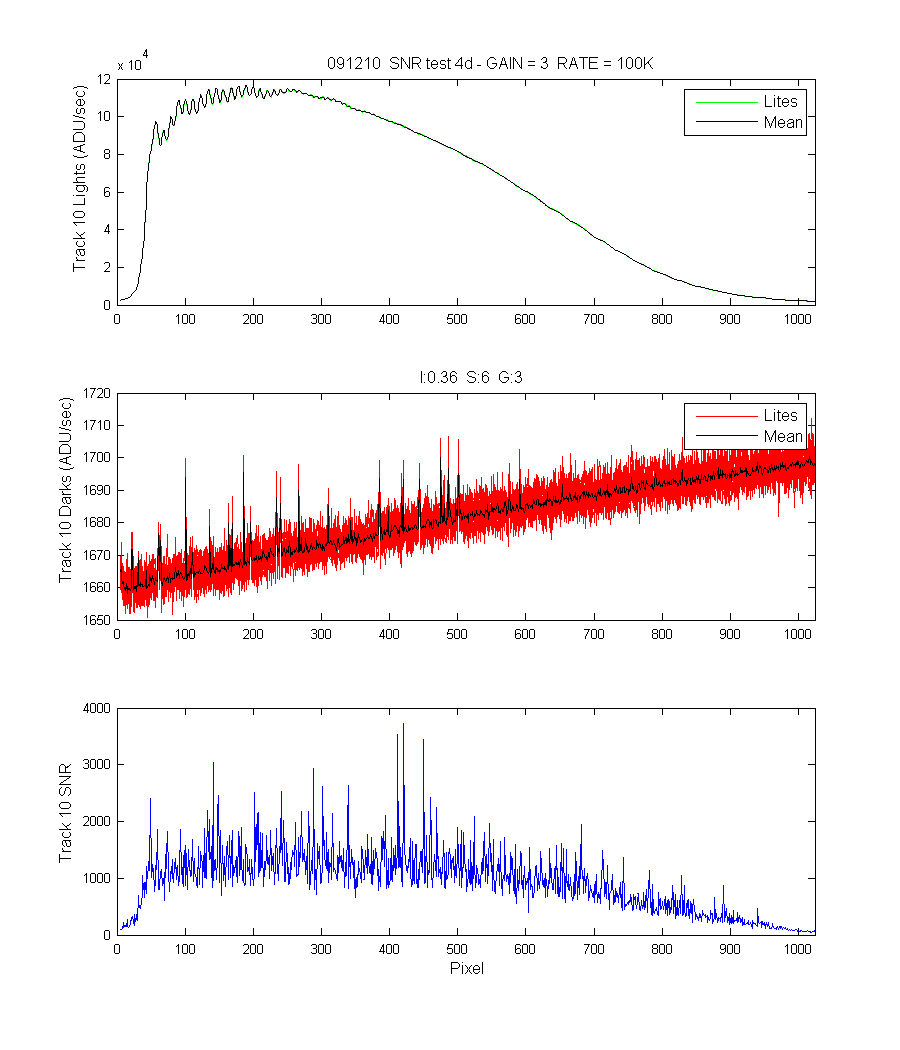
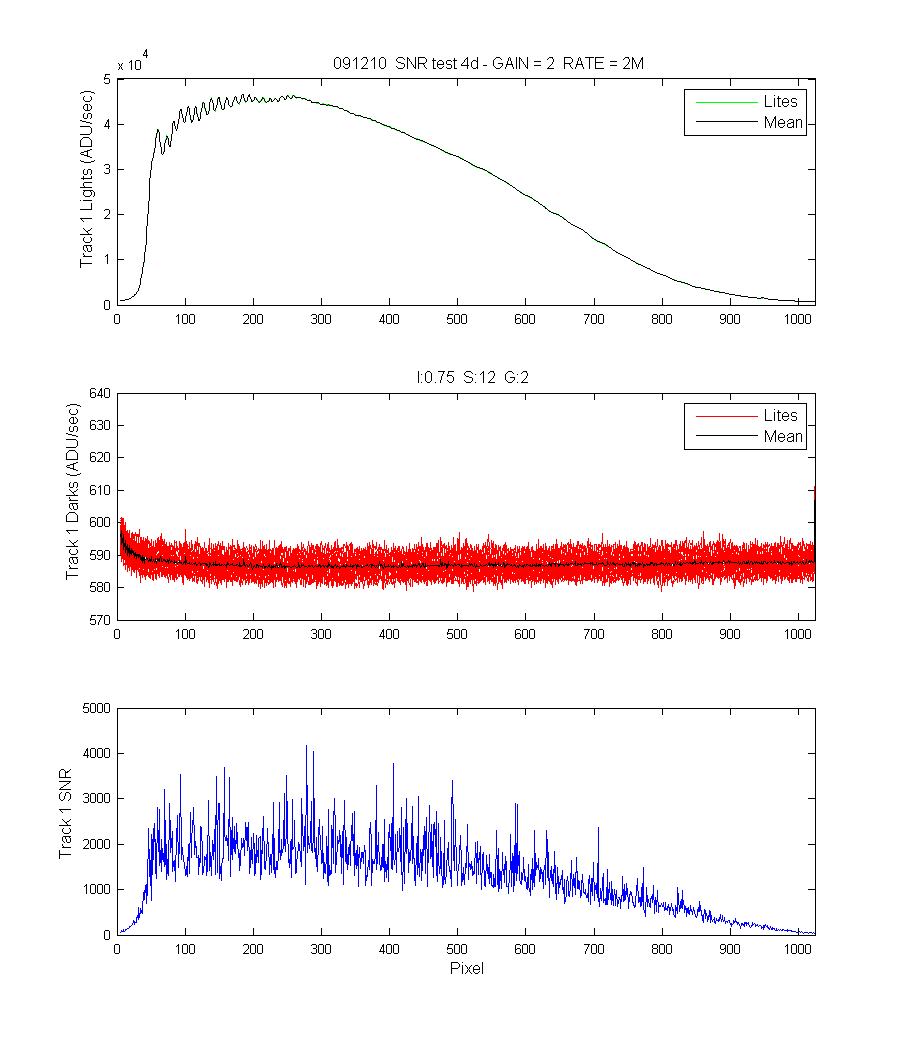
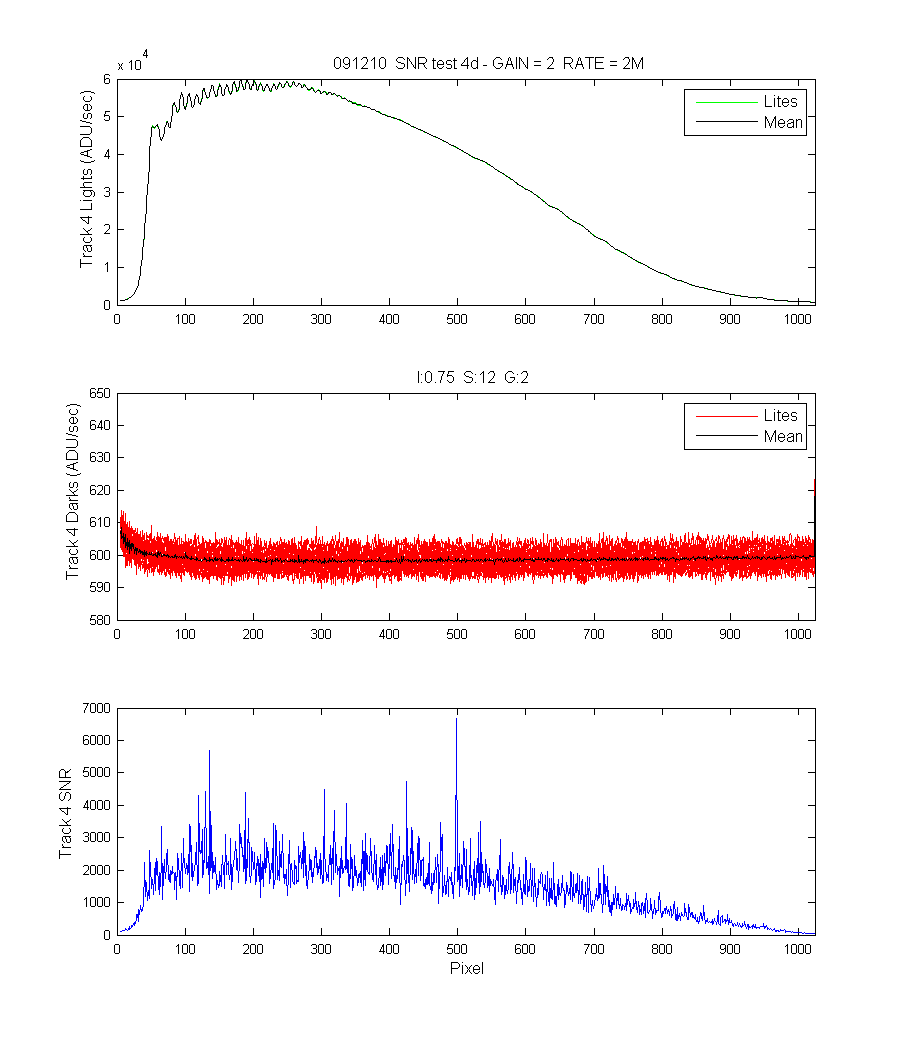
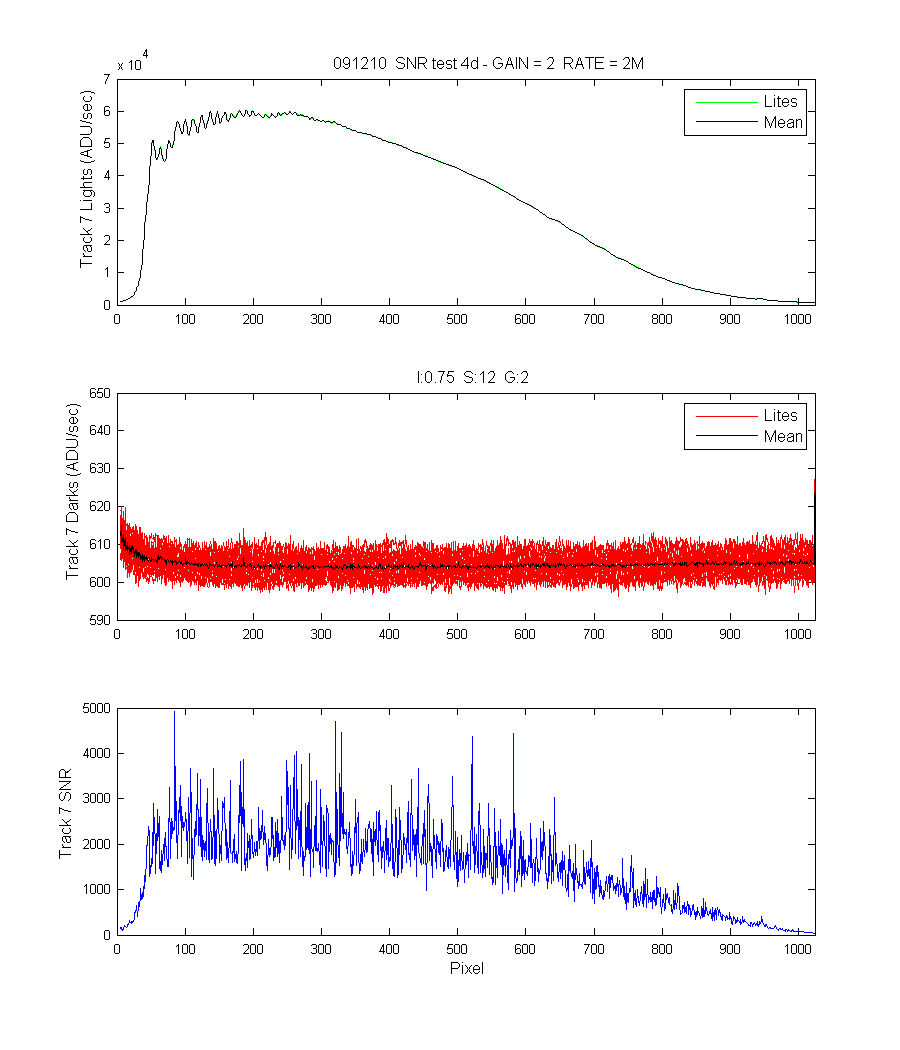
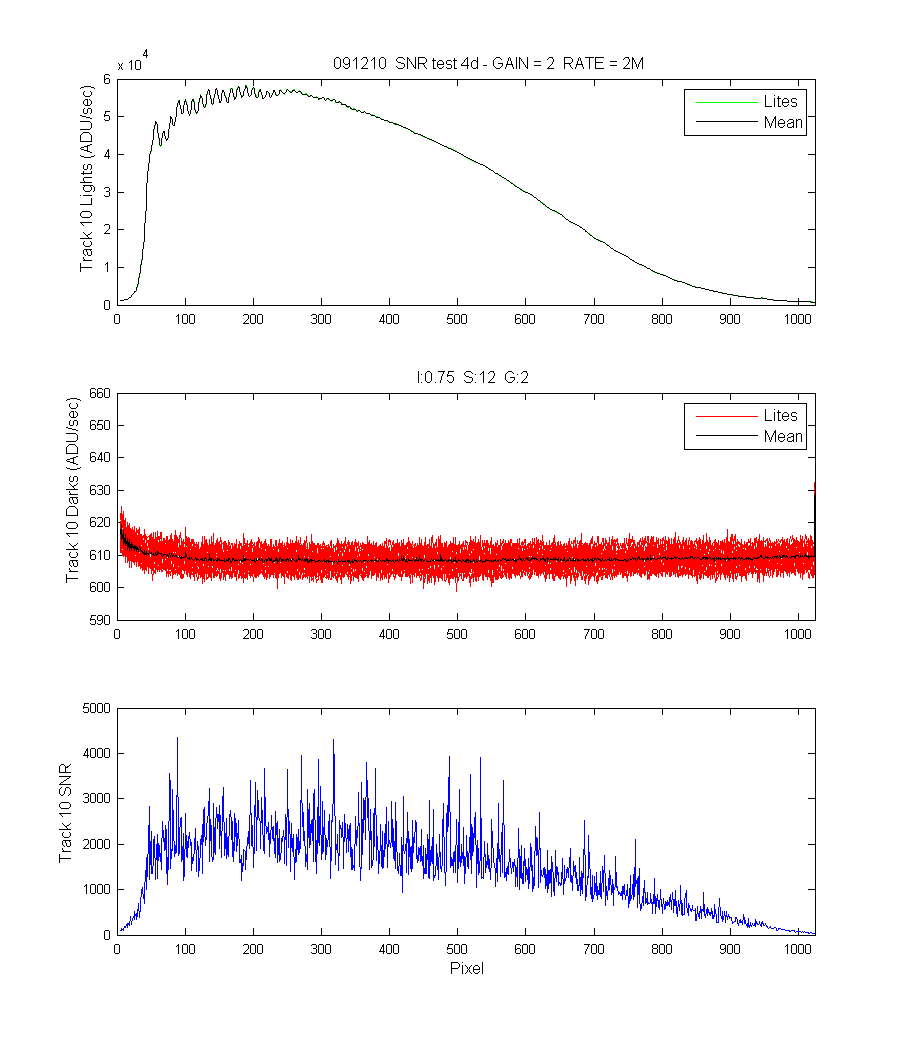
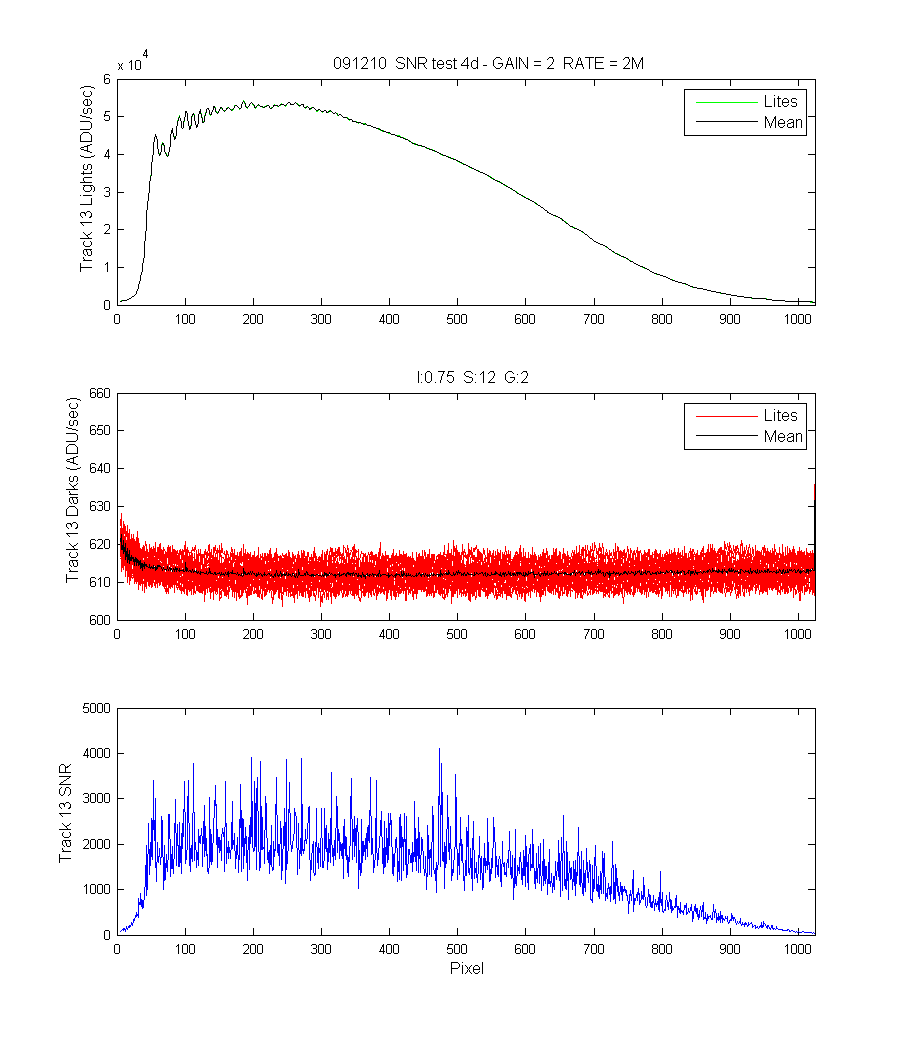
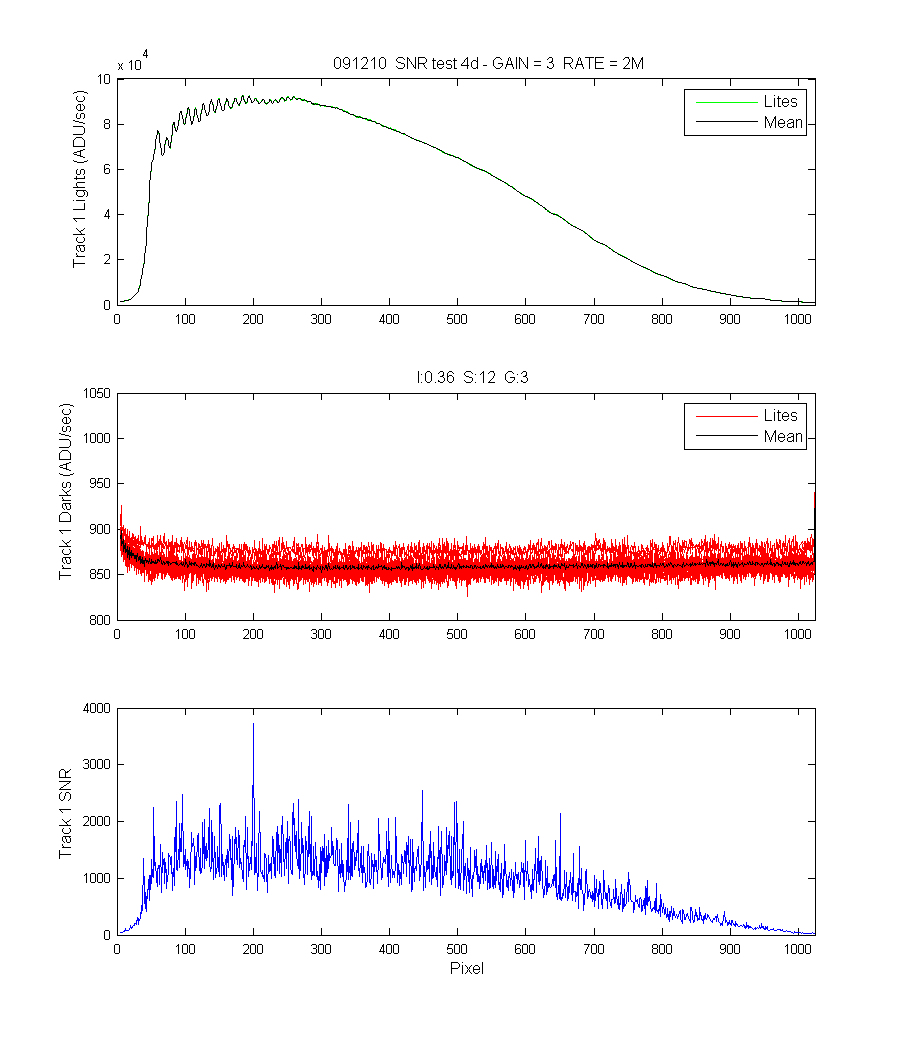
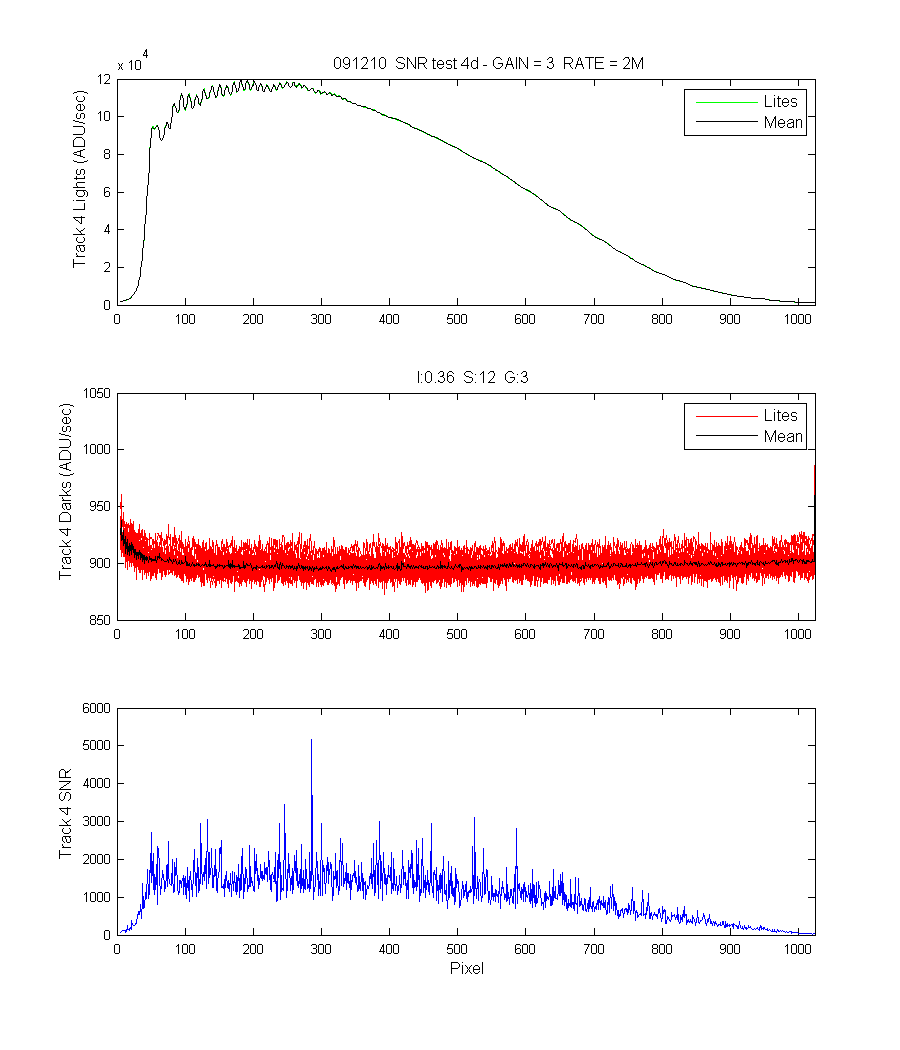
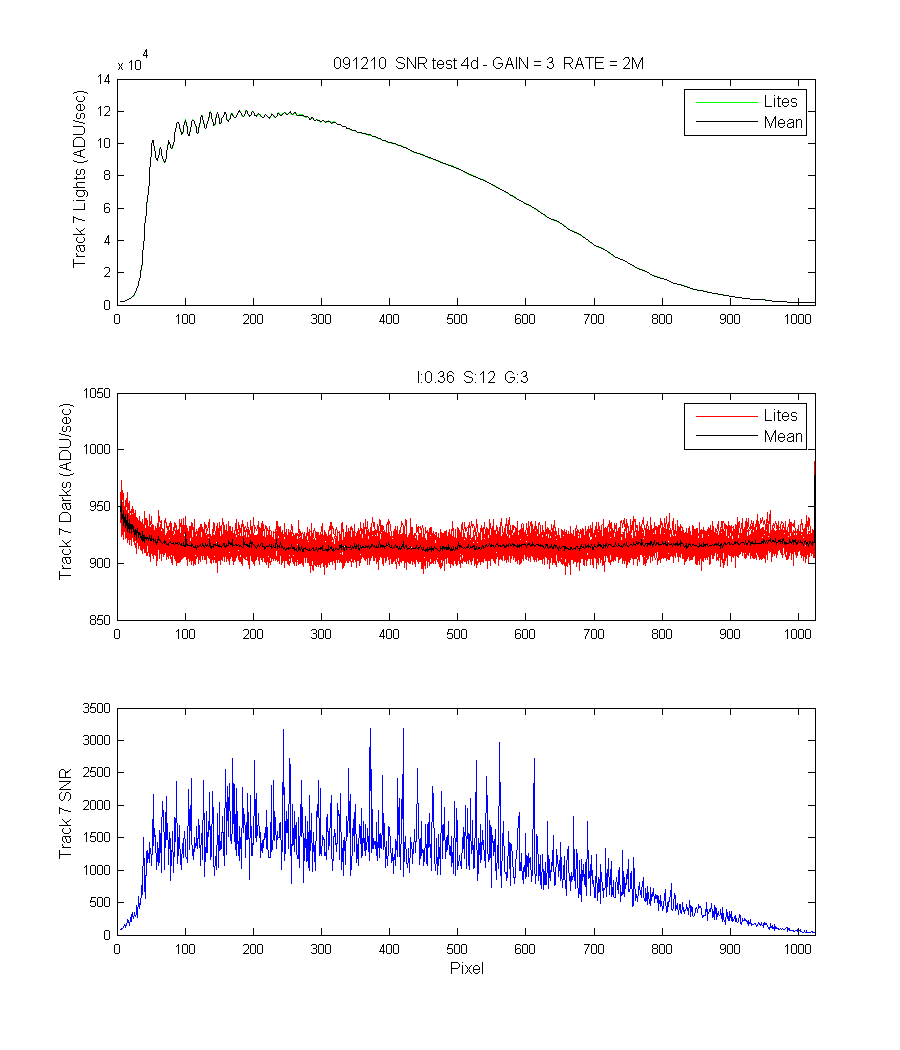
- 4. Determine Noise at different speed and gain settings
- a. Source: Stable broadband, all fibers illuminated I think we should use the OL420 since the stability of the fiber optic illuminator is unknown
- b. Image sequence for this test: 10 BI, 10LI, 10BI
- c. Integration time for 55K max signal Check at the “cusps” and make sure we are not saturated anywhere
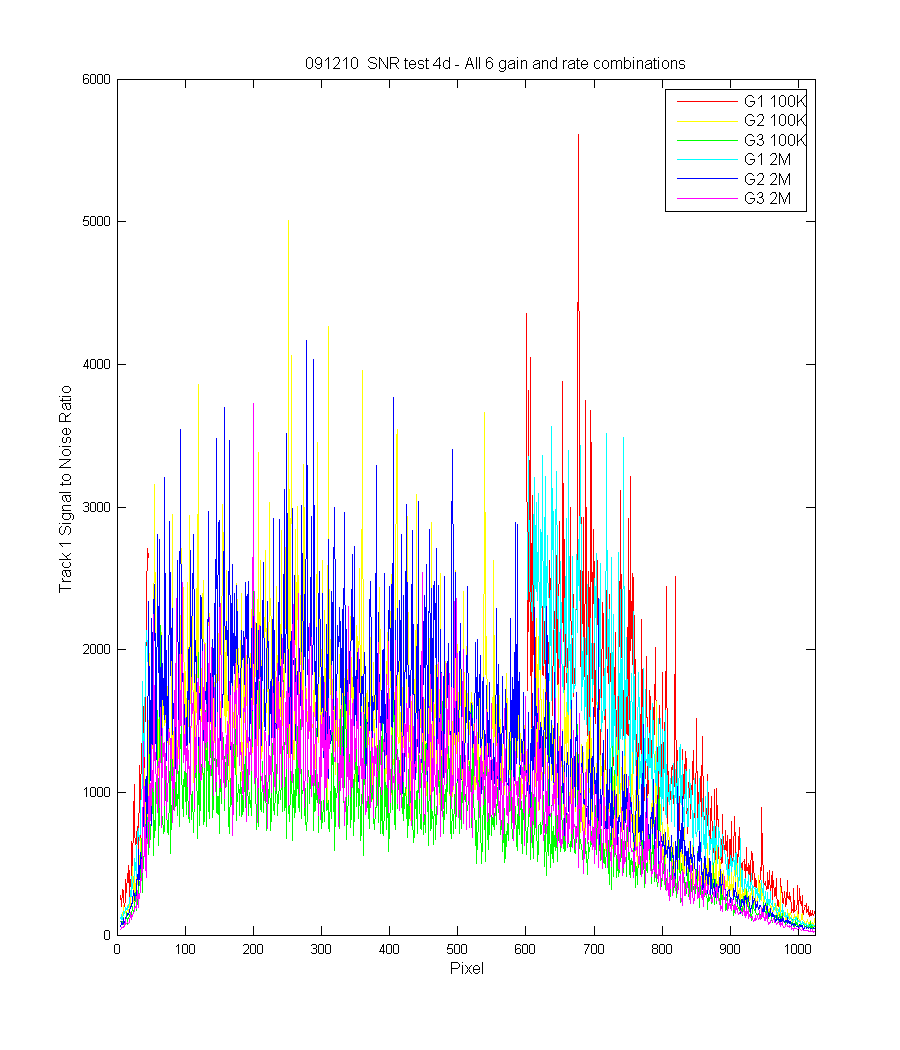
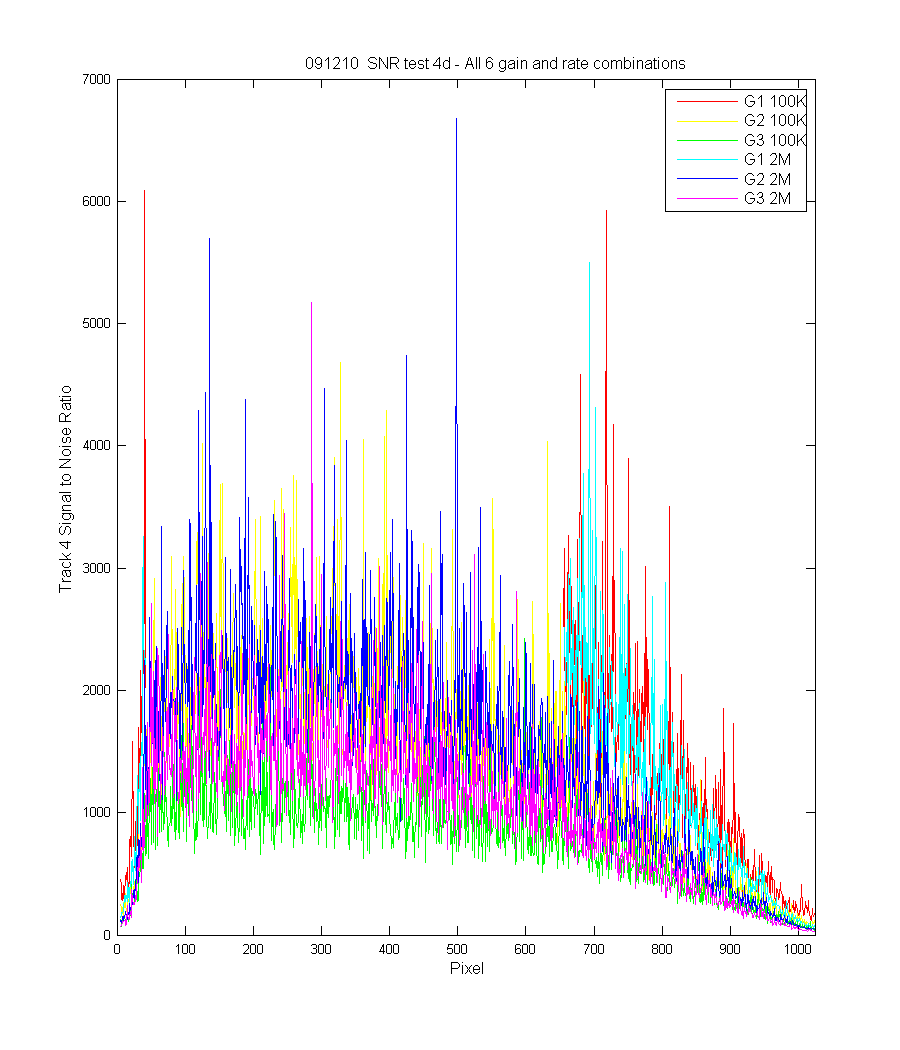
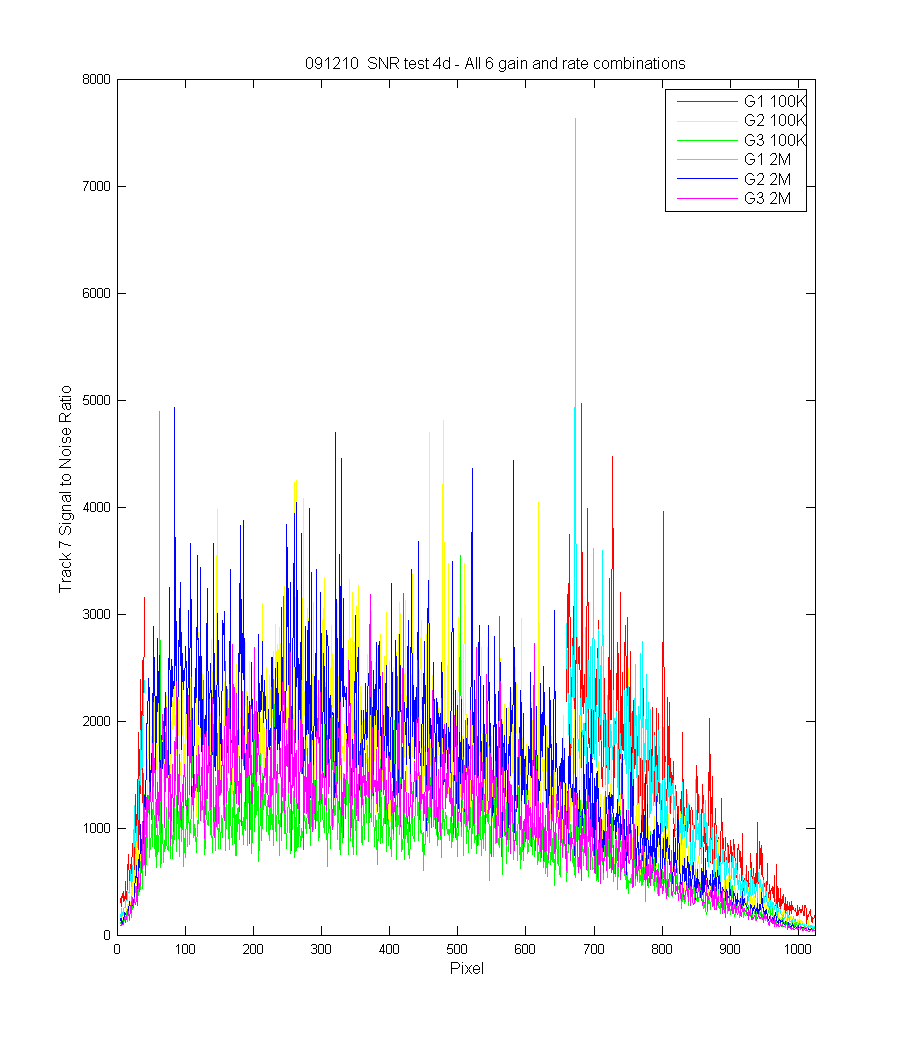
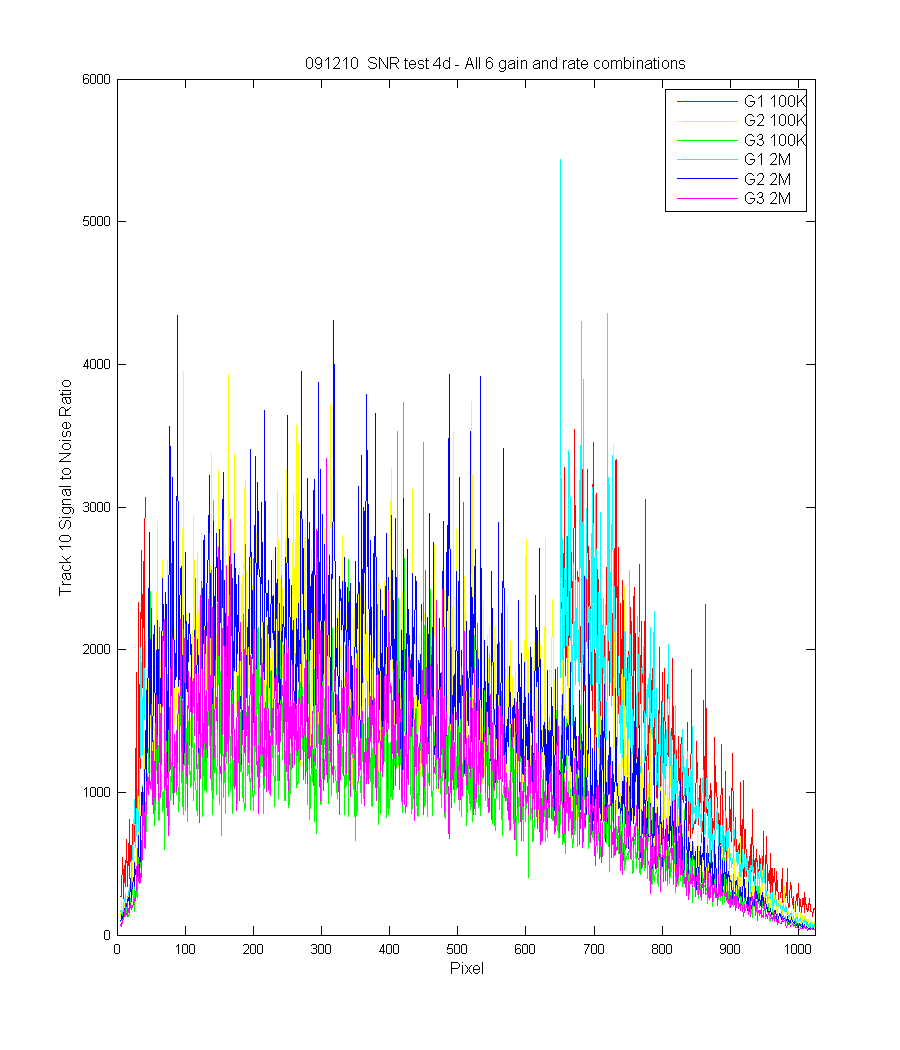
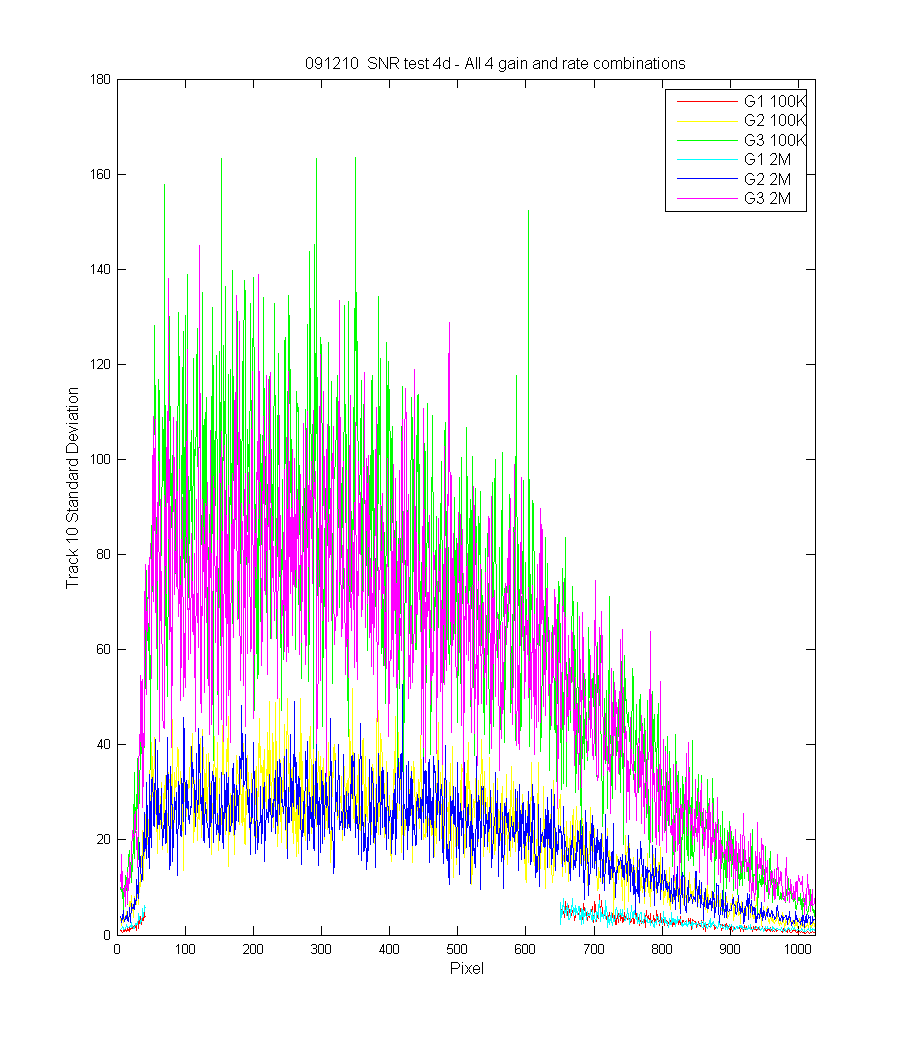
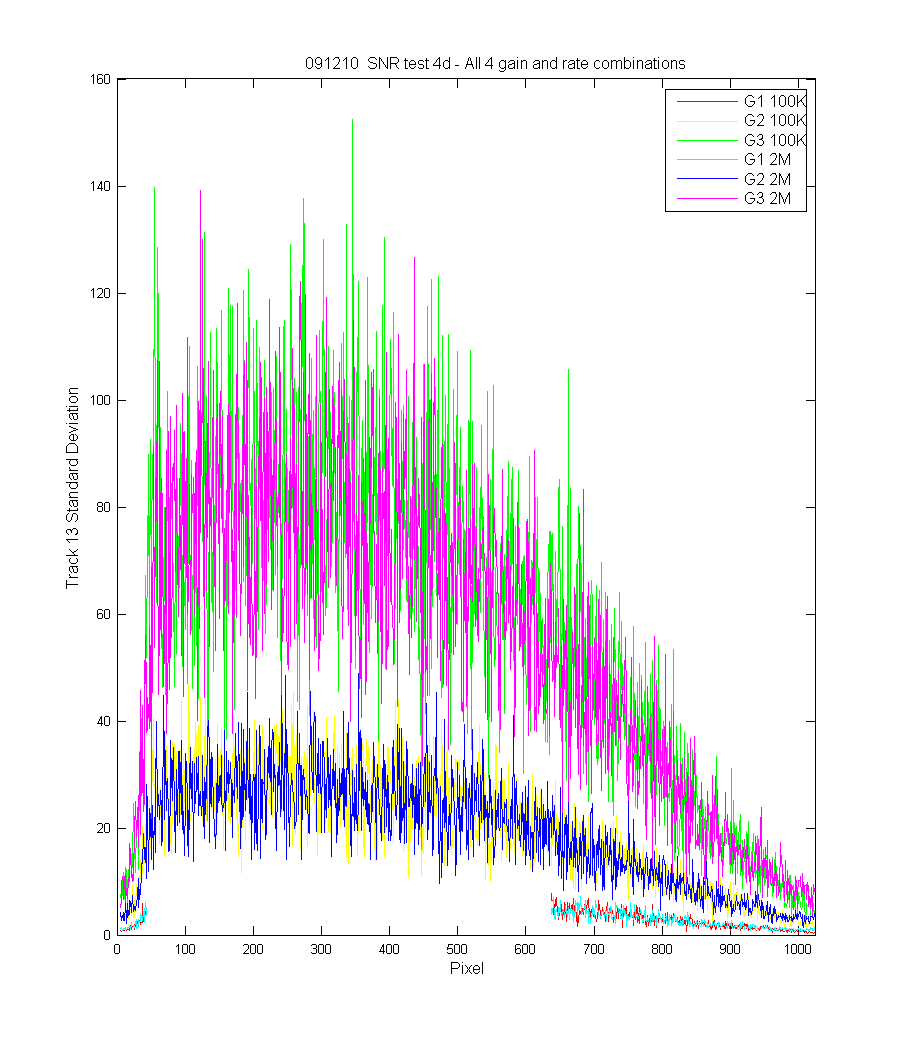
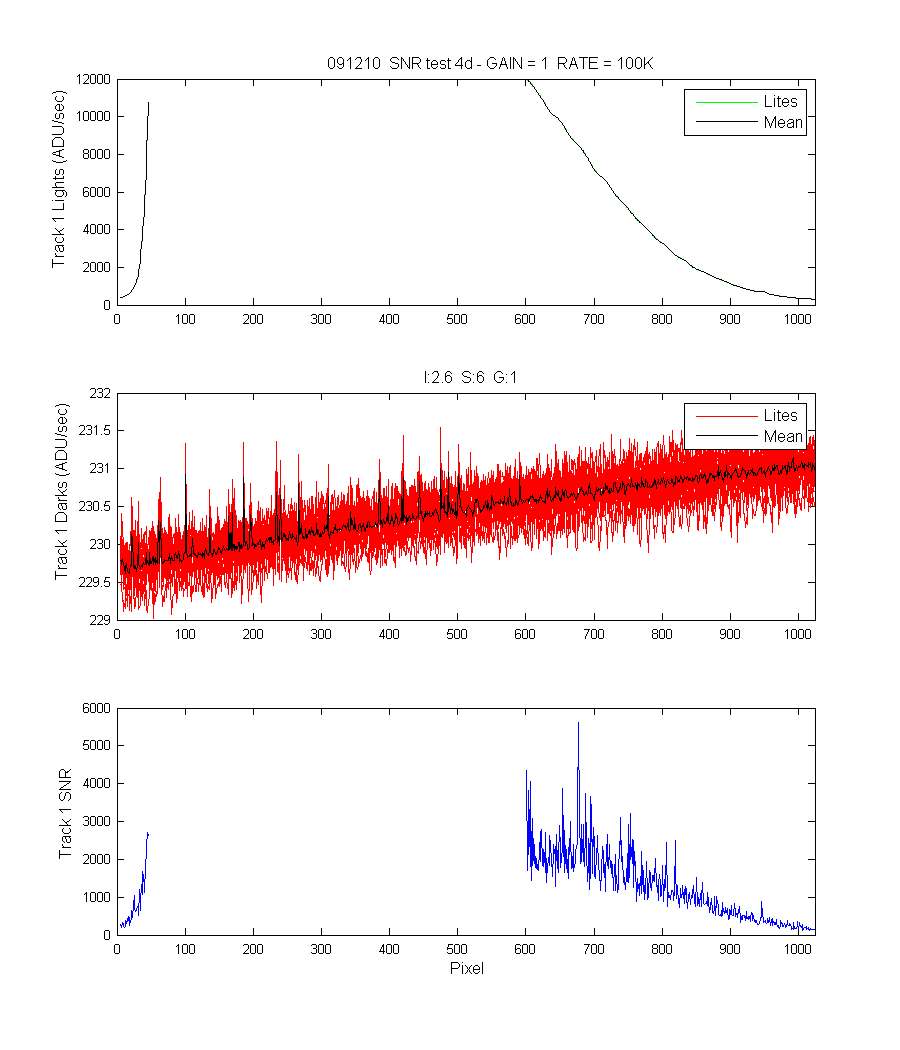
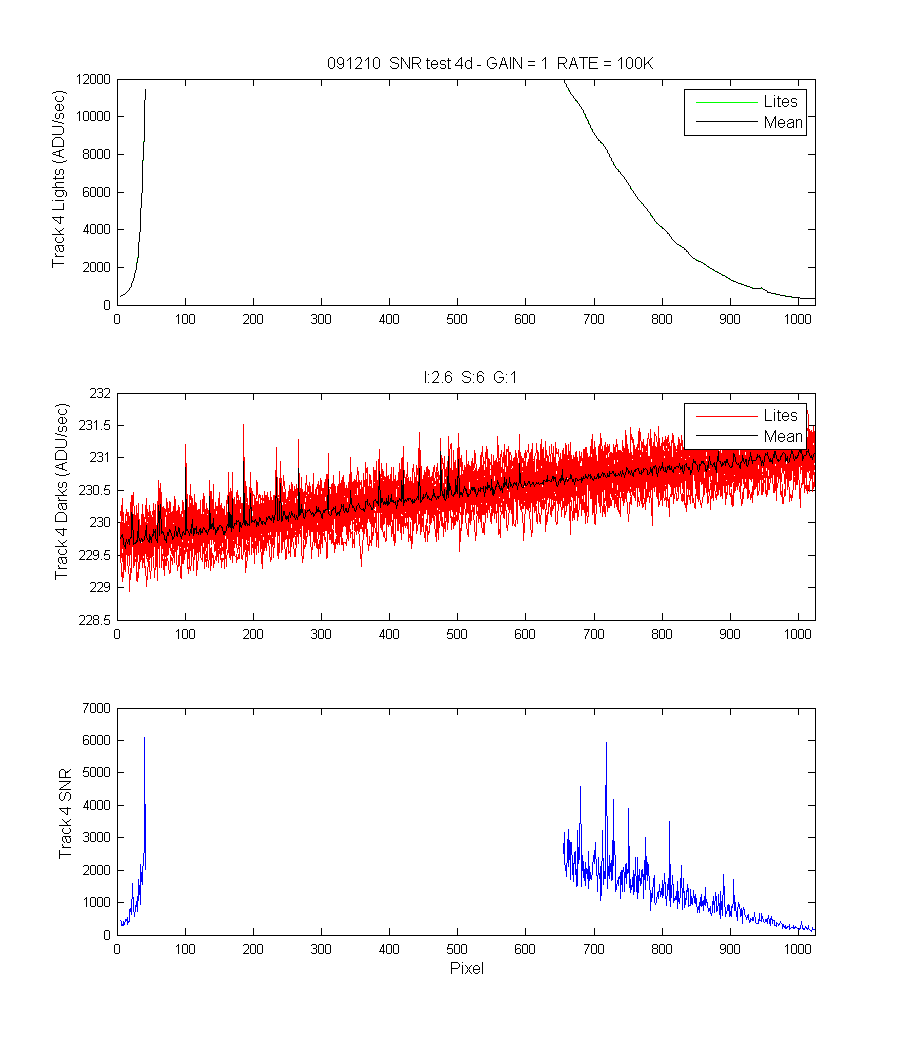
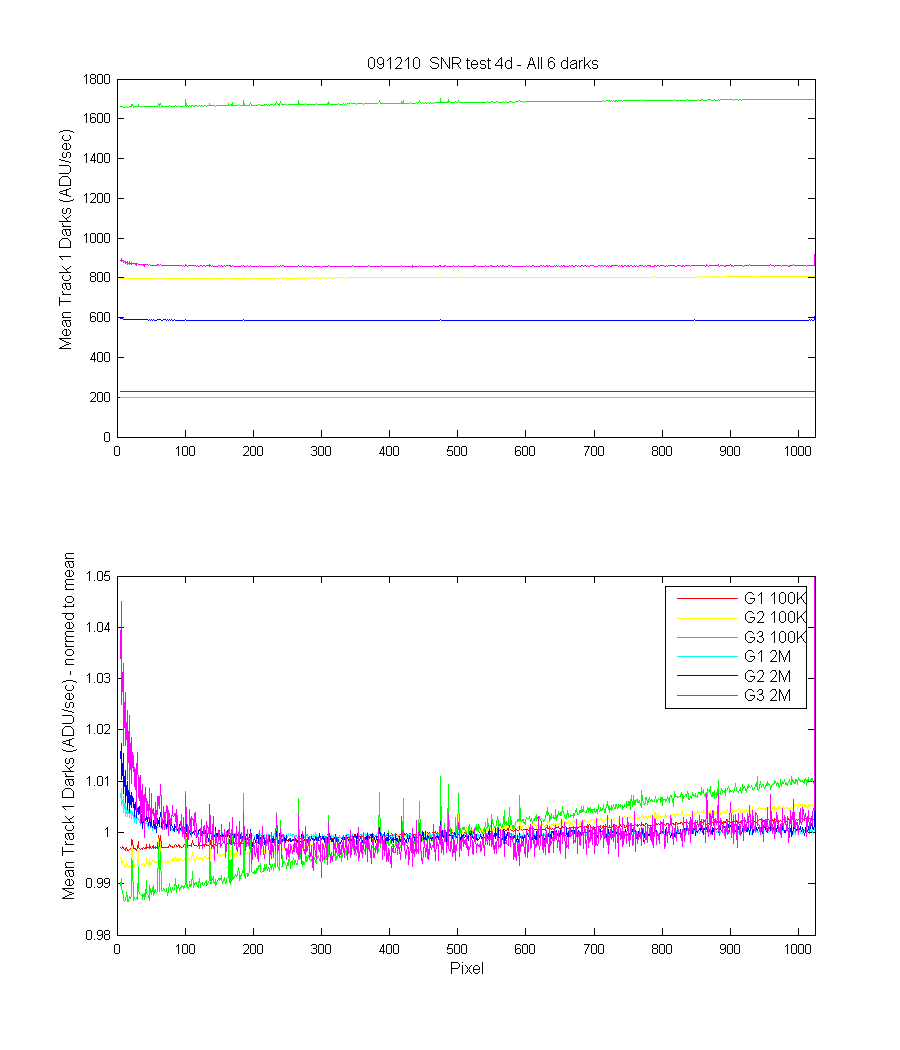
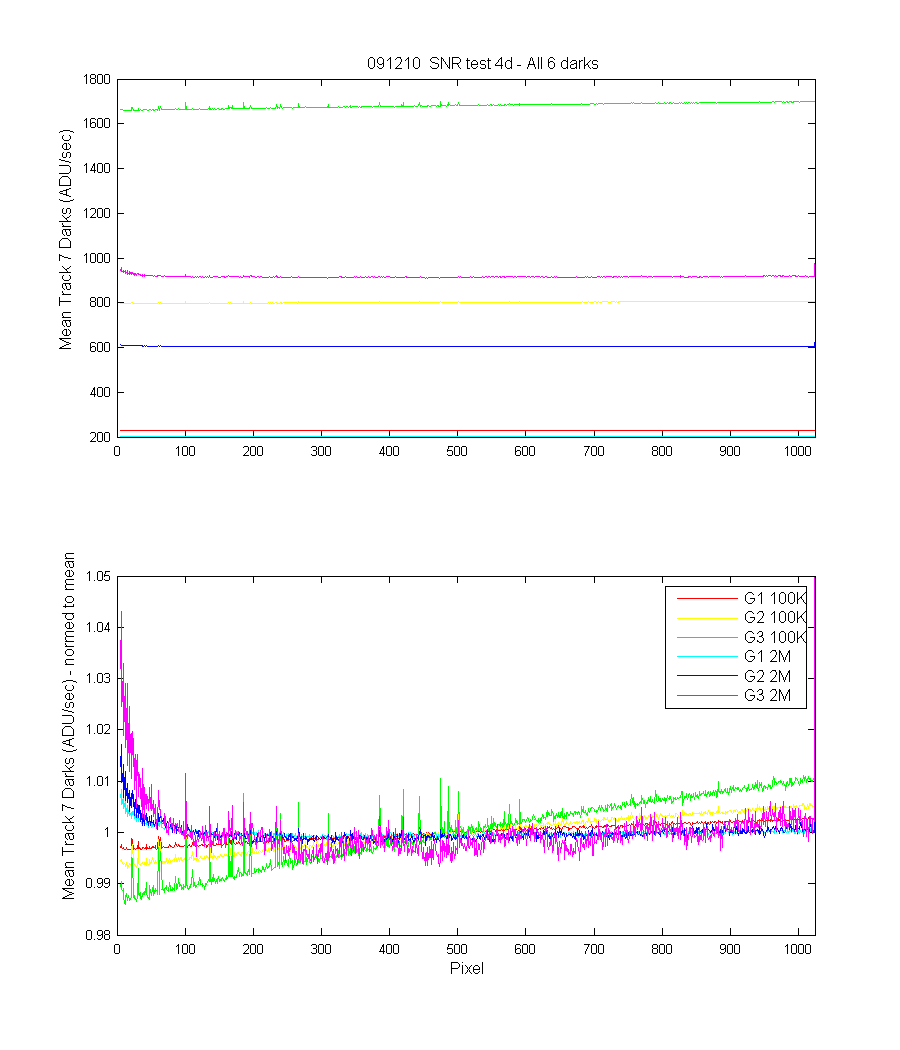
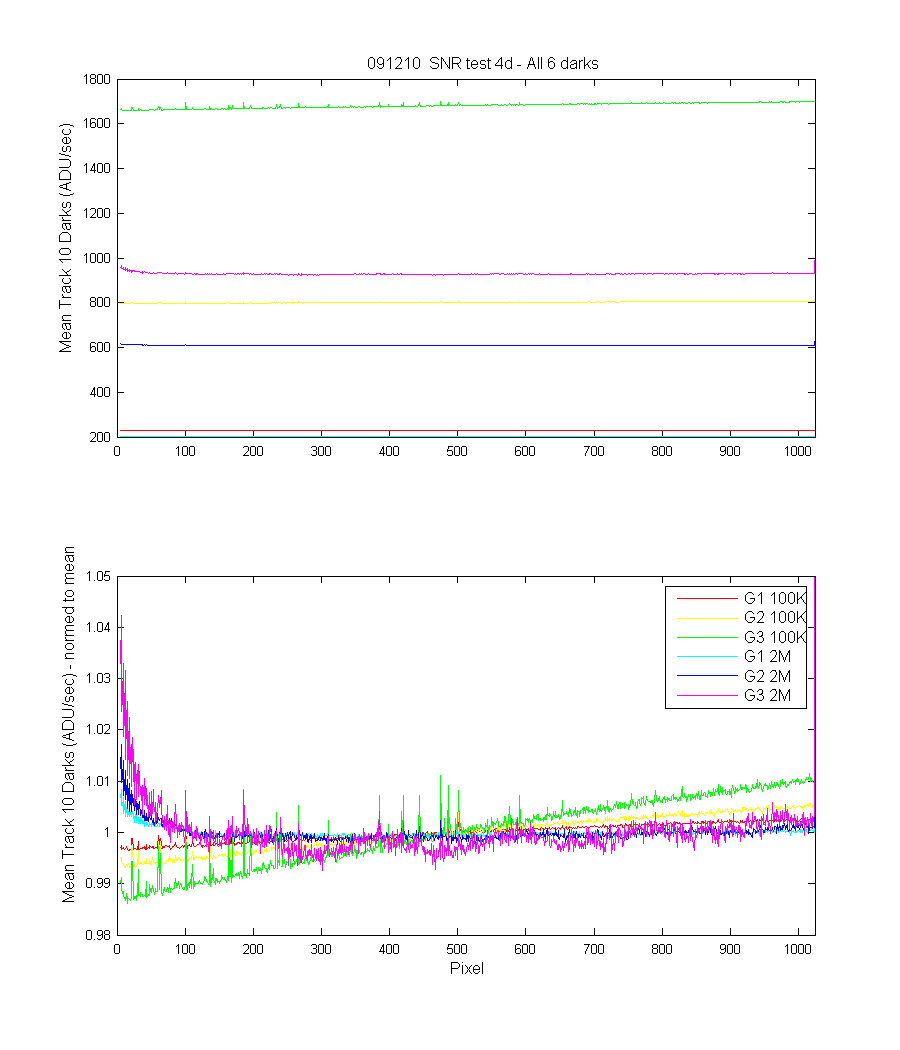
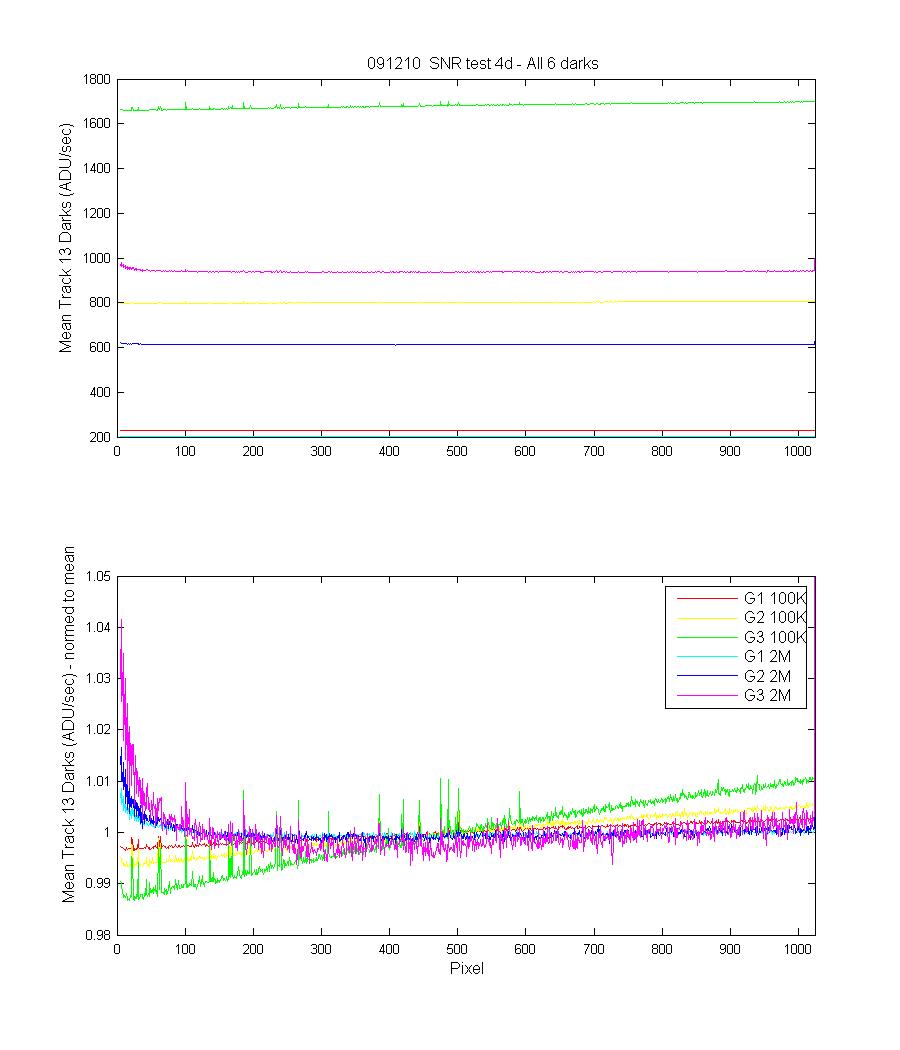
- d. Take 1 image set at each speed (100khz, 2Mhz) and gains( 1,2,3) at both speeds.
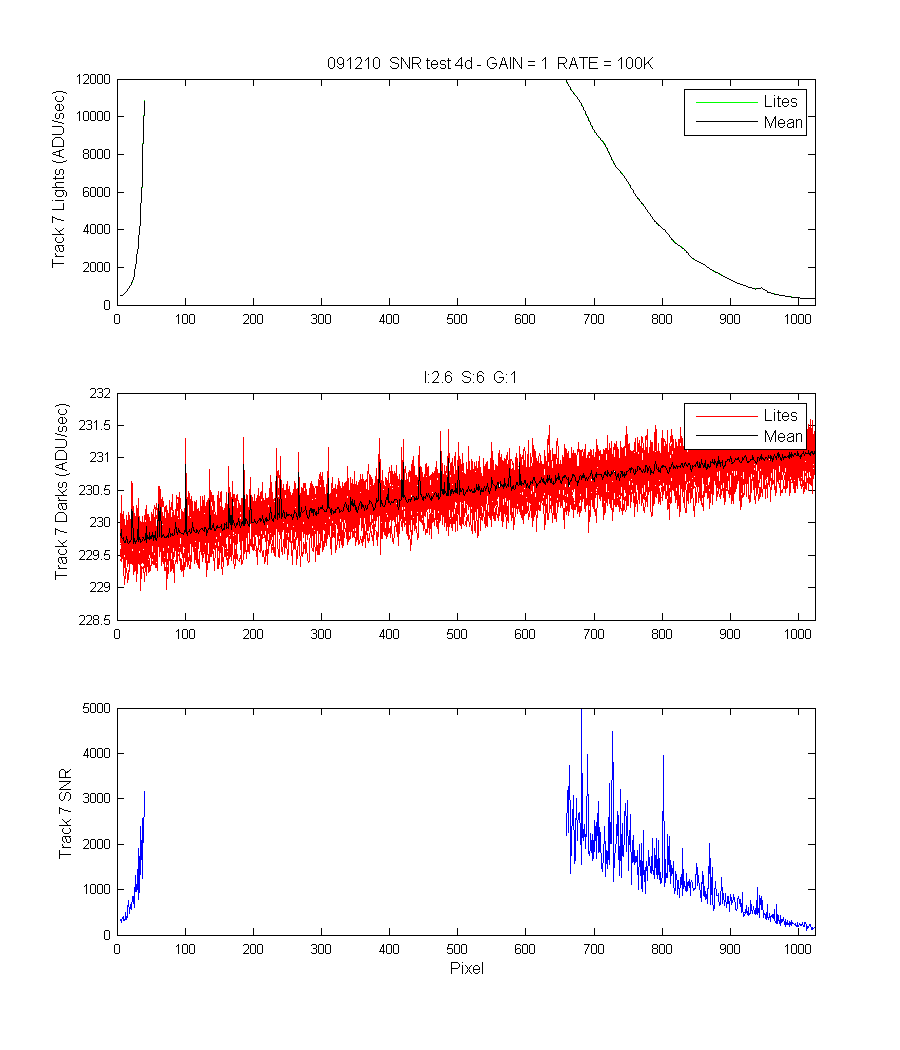
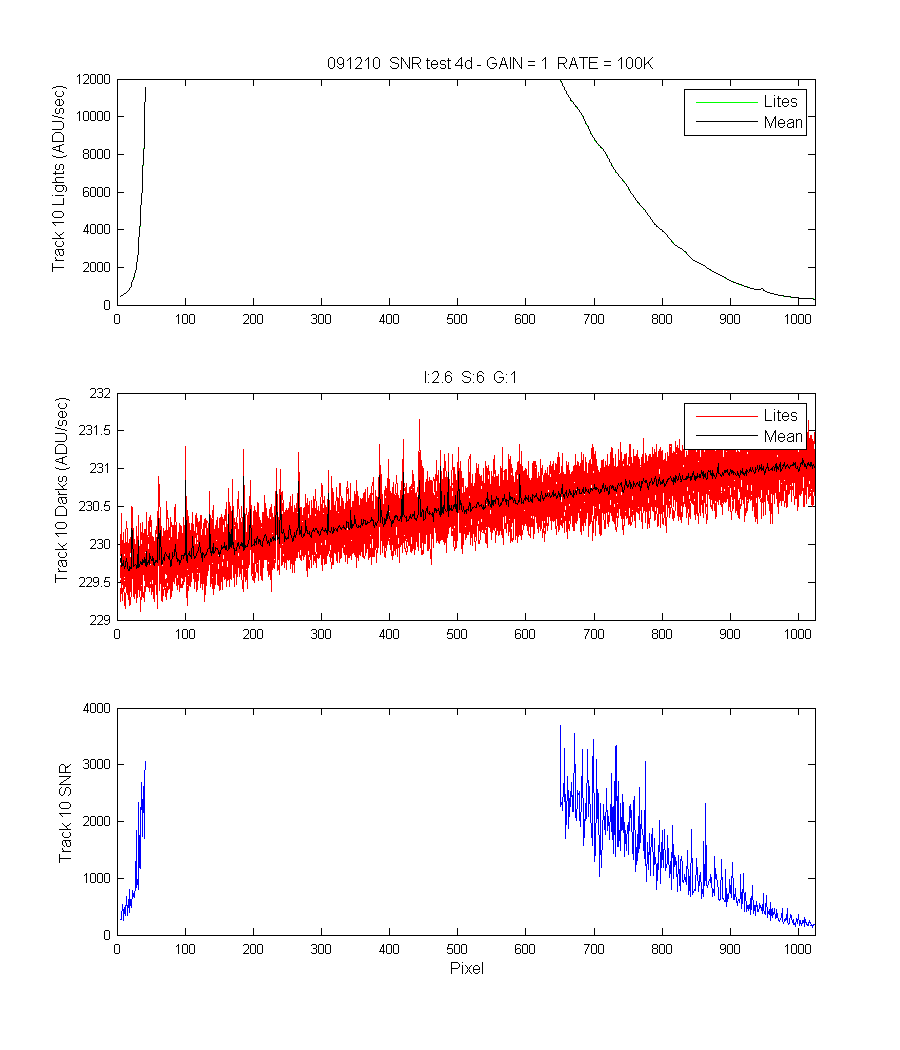
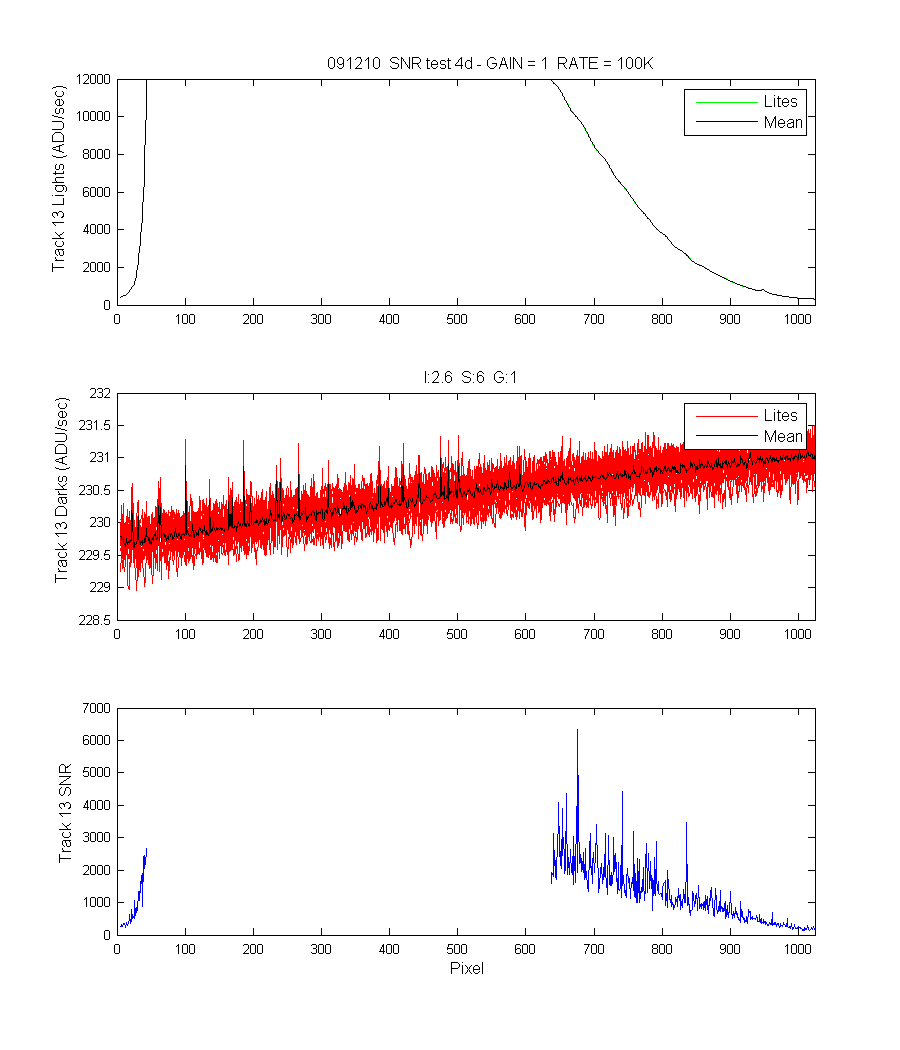
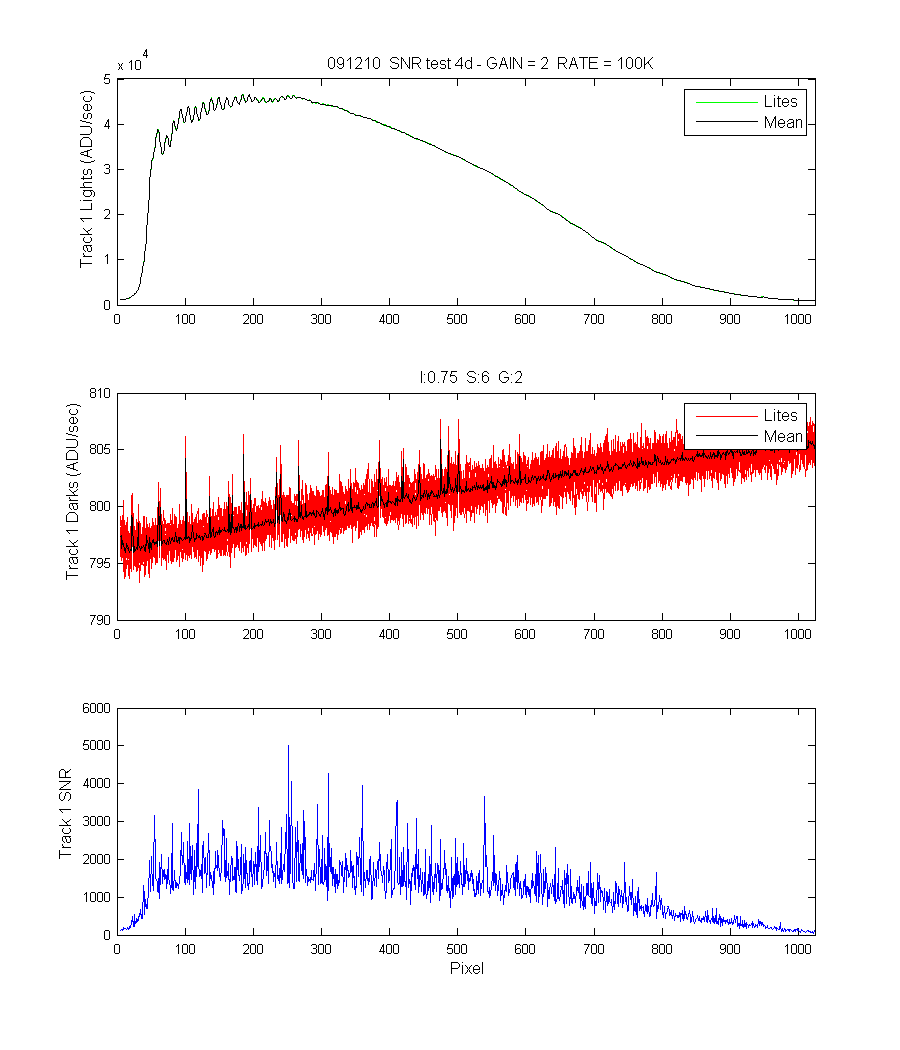
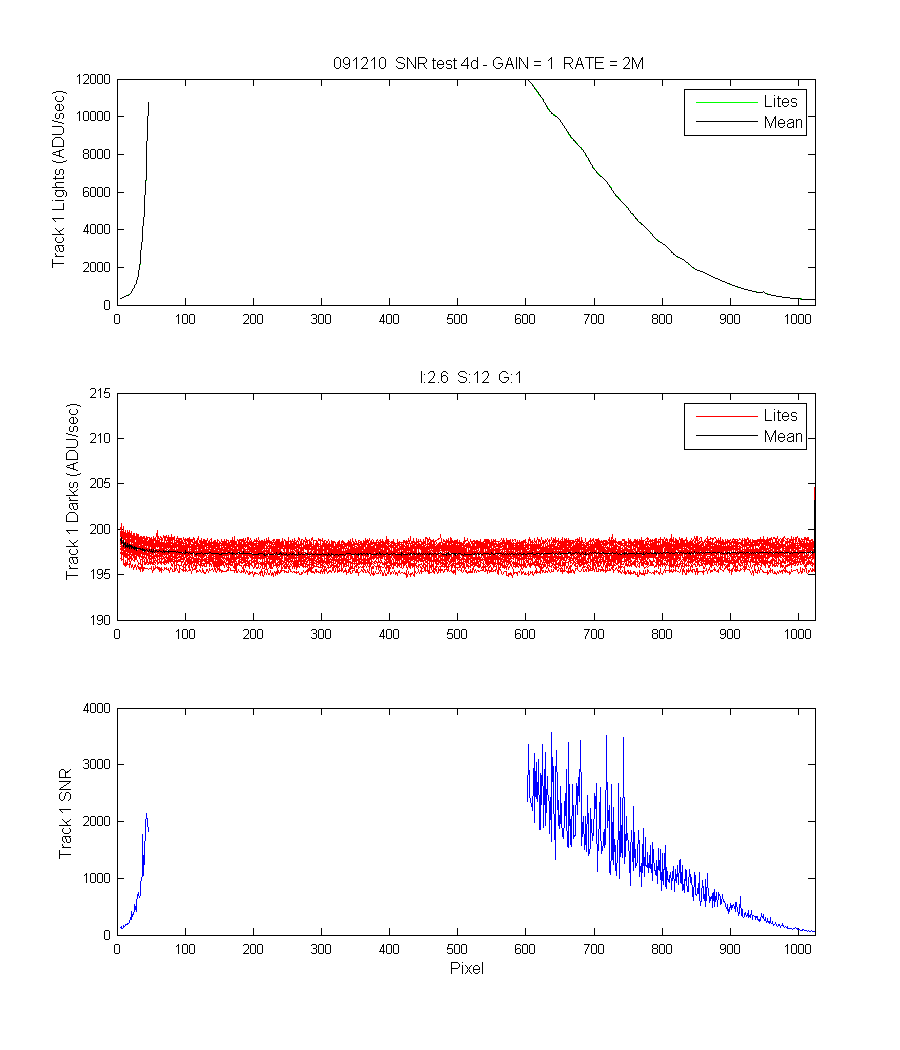
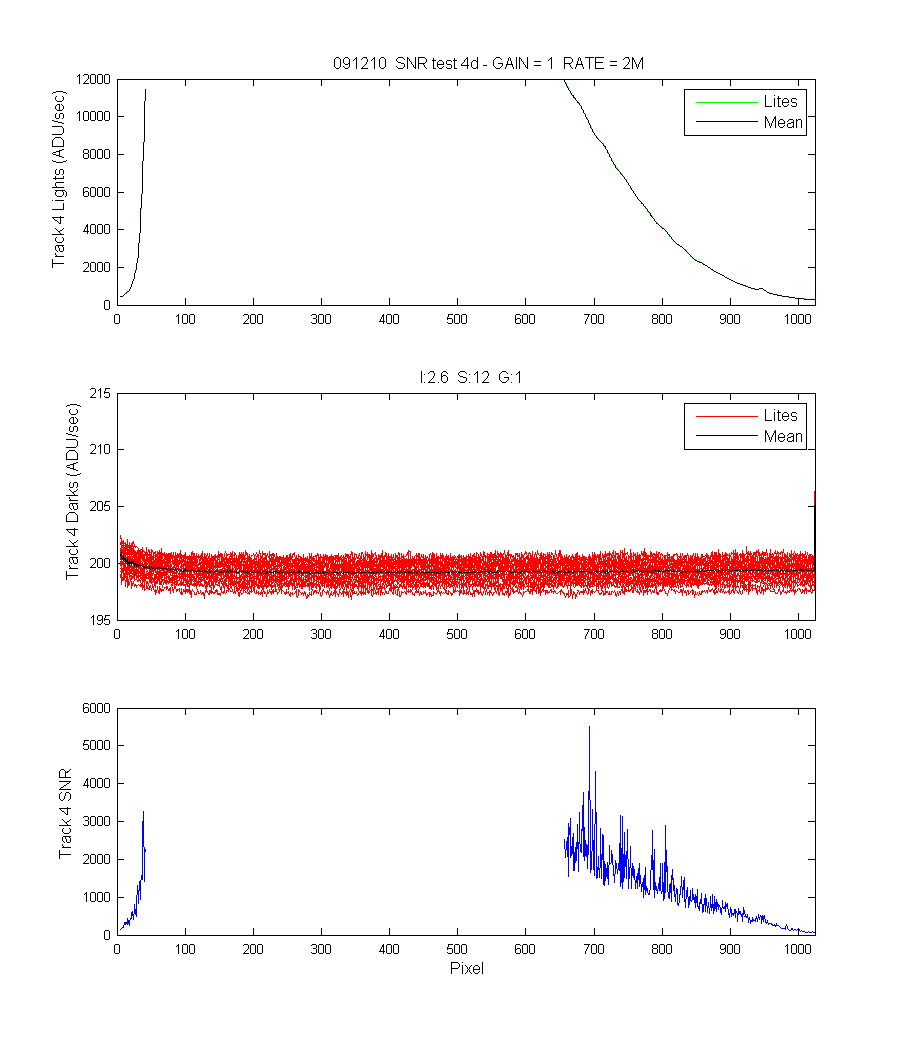
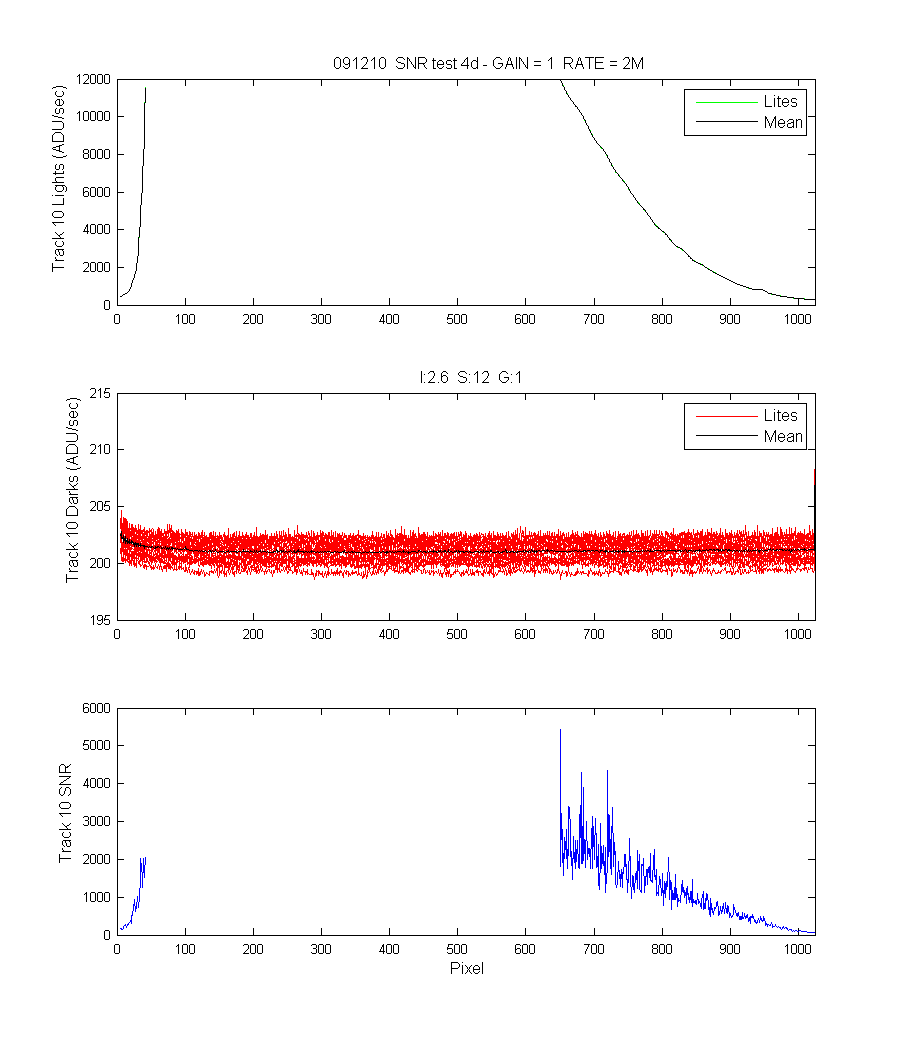
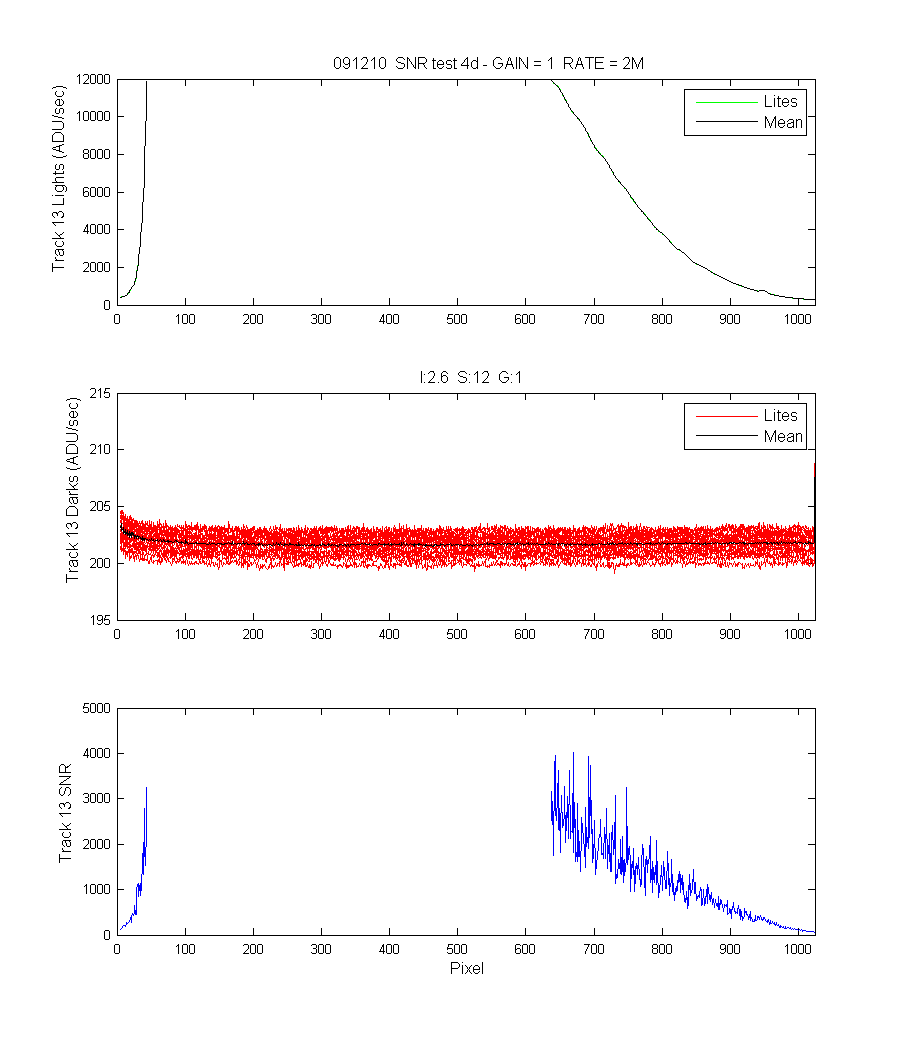
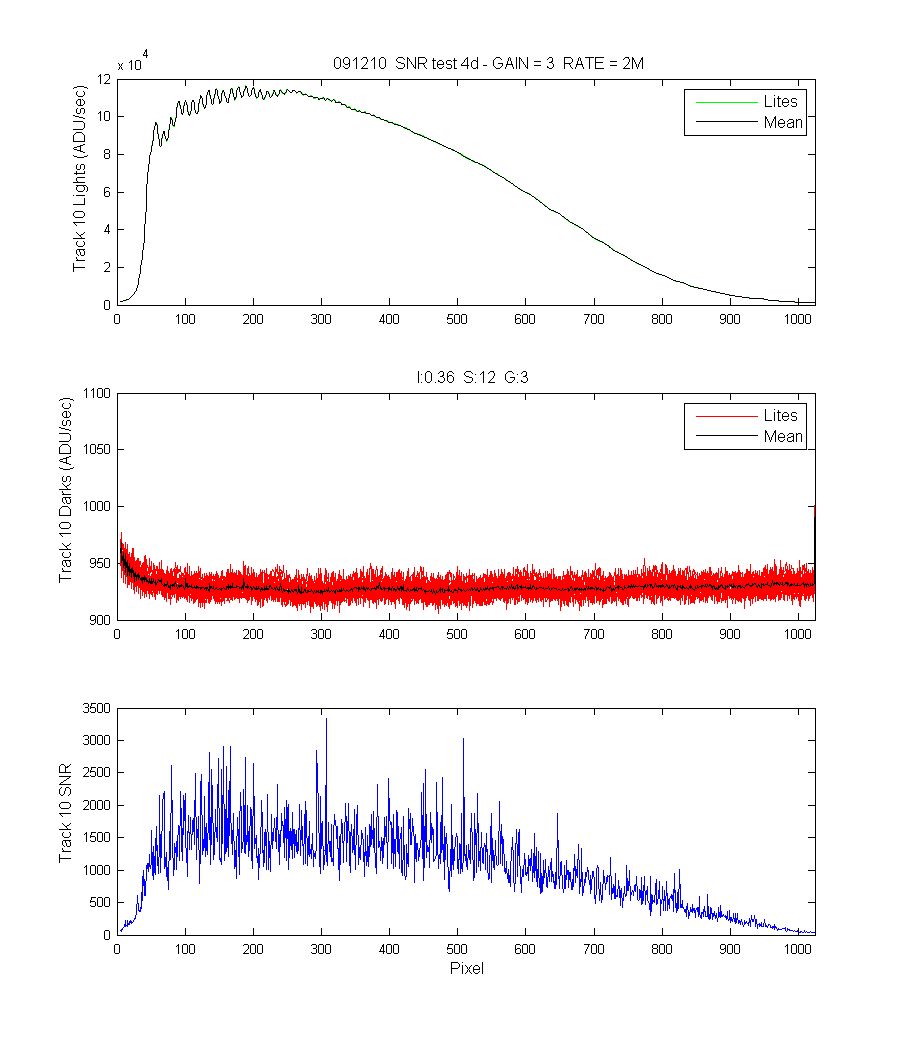
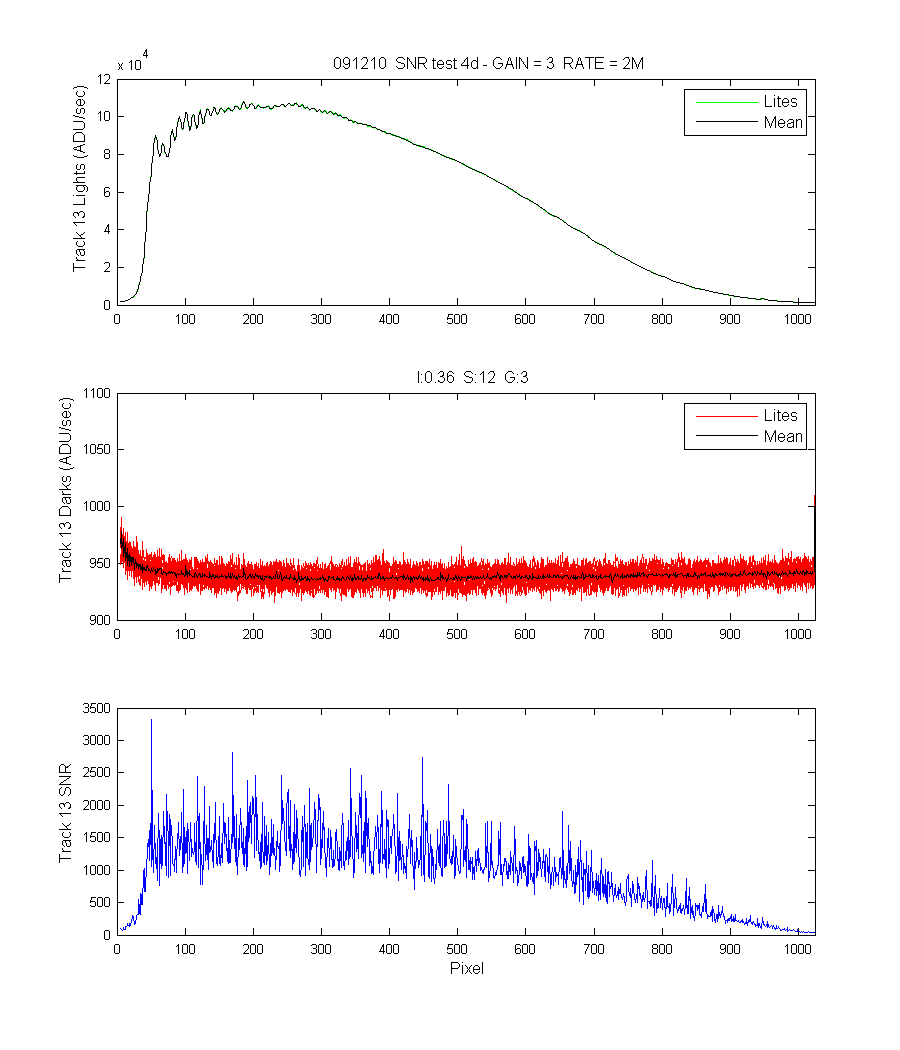
- e.Analysis
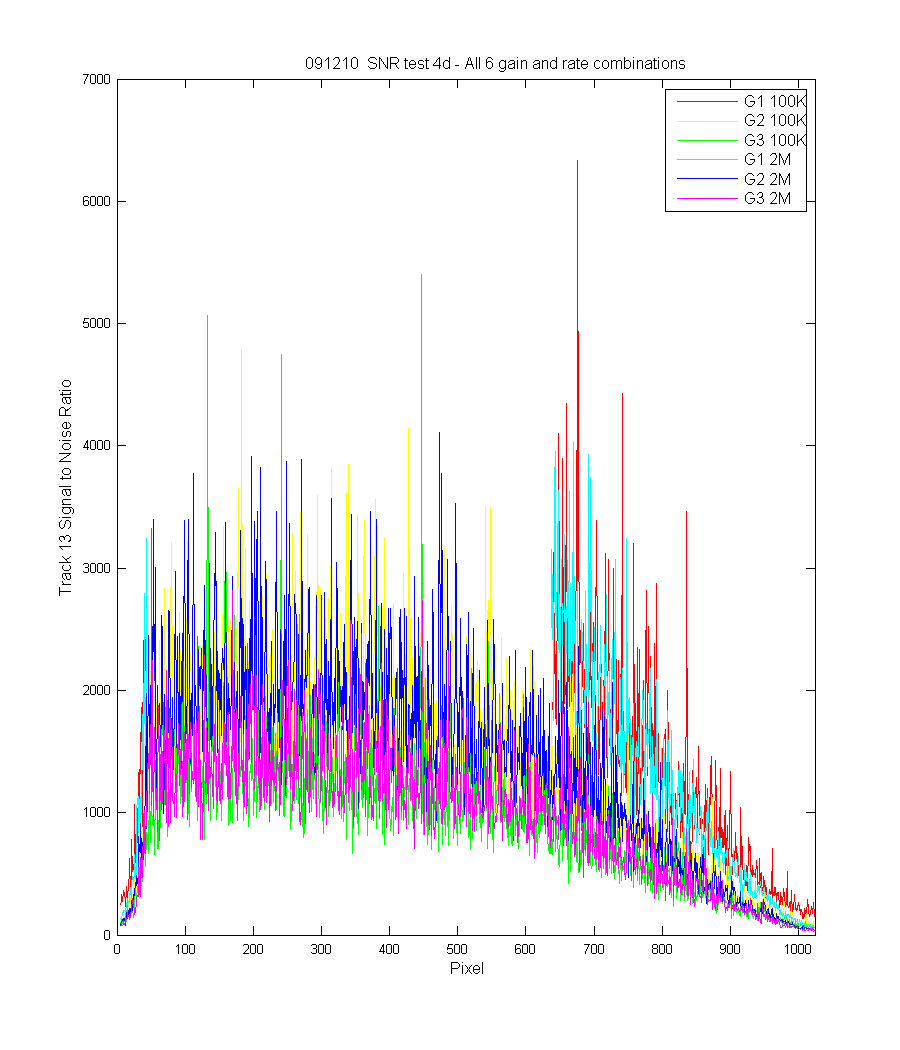
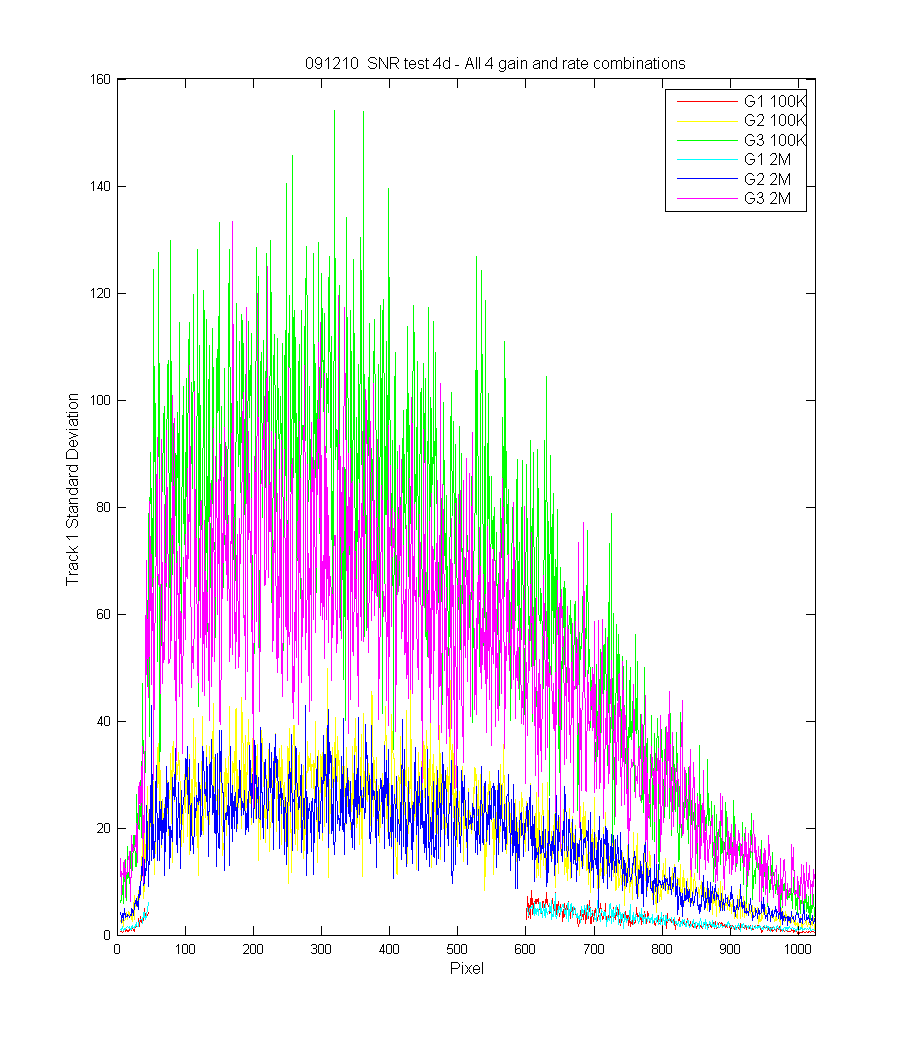
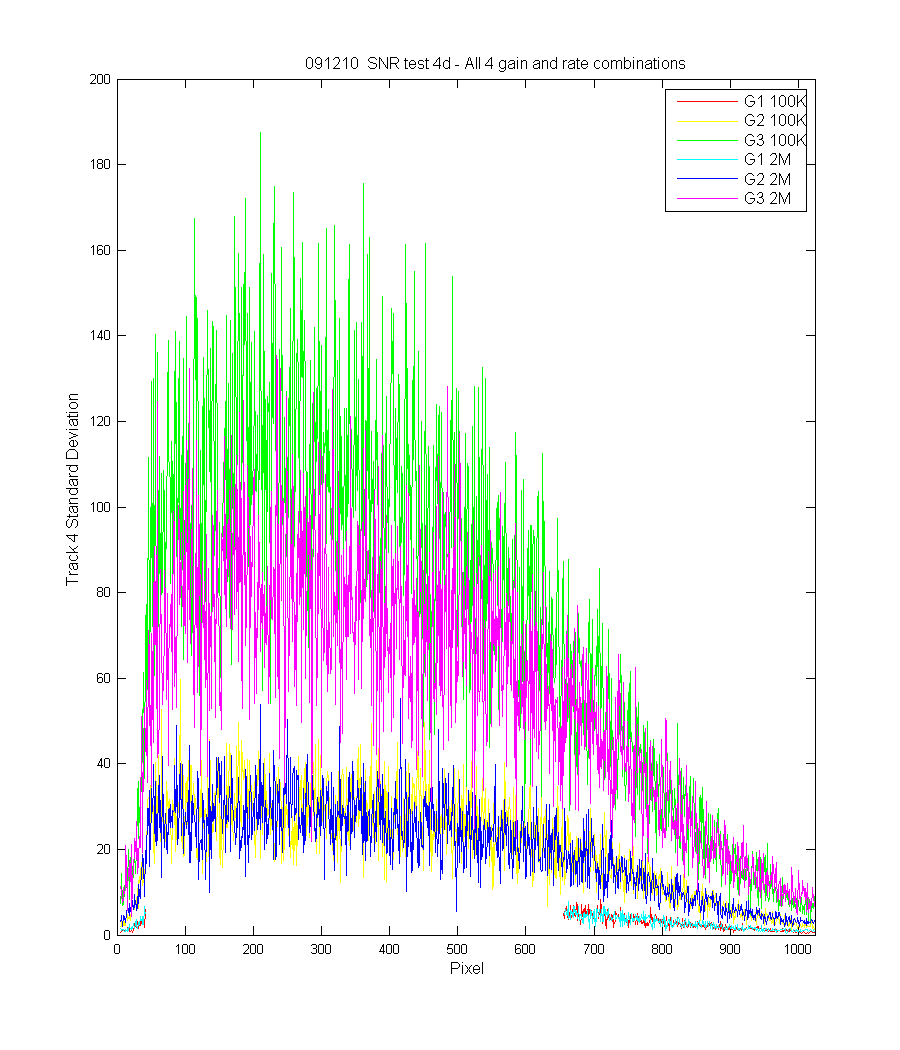
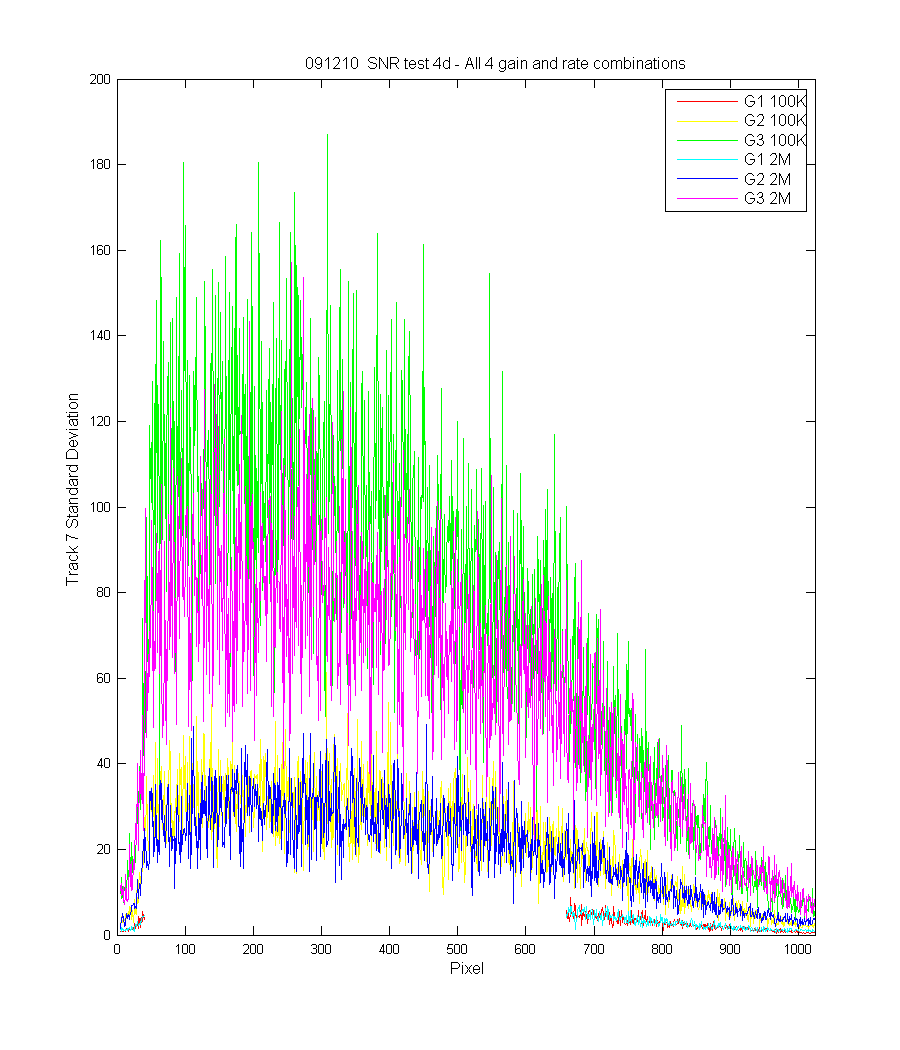
- i. SNR of spectral Light – dark for one lighted row of pixels for each setting combinations
- ii. Goal is to determine if the 2mhz speed is quiet enough to use for future work since it is much faster.
Bloom: A defect obtained with images taken using CCDs (see Charge-Coupled Device), in which bright images have long bars on either side. This is caused when pixels become saturated with charge, which then spills over into adjacent pixels in the column. (http://www.encyclopedia.com/doc/1O80-blooming.html)


pwd: C:\zflora\mldata\MOBY2\Intital_testing\091210
Date: 16-Dec-2009 11:01:20
Created from marktask_4d(1)