Data set will be redone with a stable source rather than the Fluorescent room light
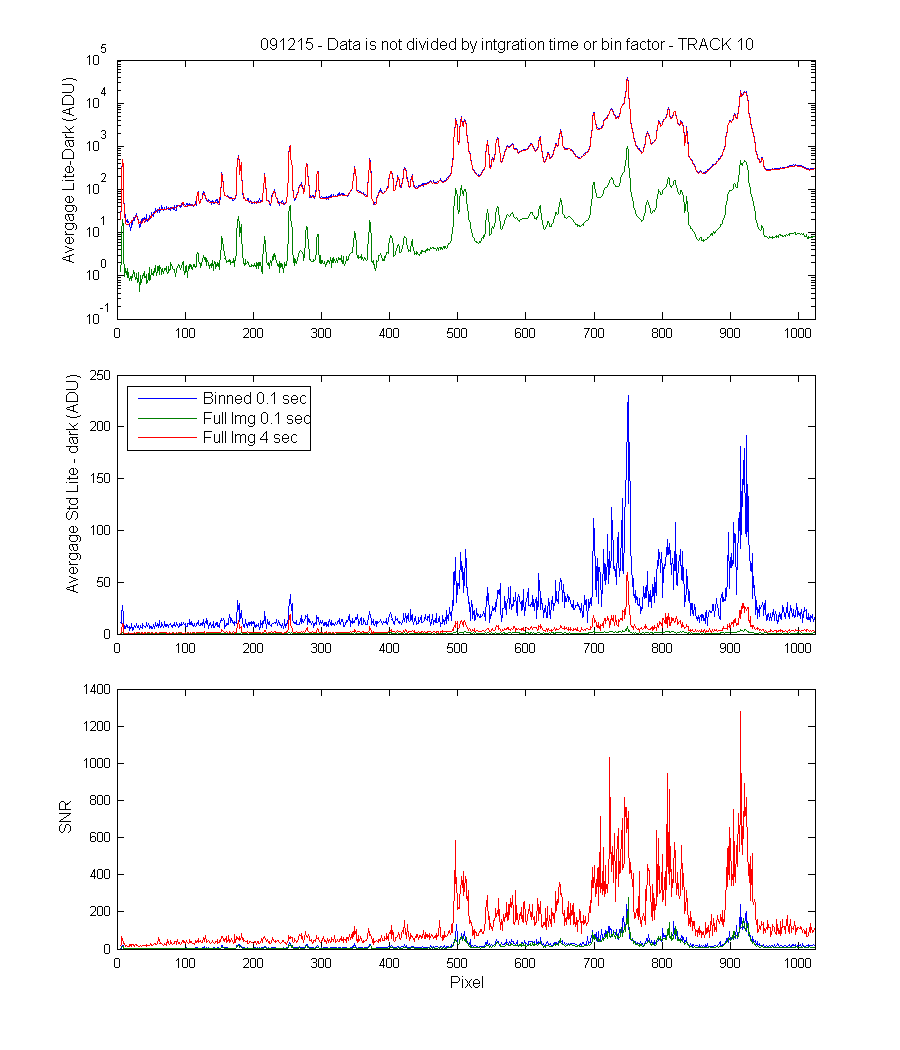
This set of images is to look at the differences between a full image and the on-chip binned image
Room Fluorescent light source
Darks are with shutter disabled closed
100khz, gain 3
all files are 11 images per file
Dark tracks are bin of 1
Light tracks are bin of 40
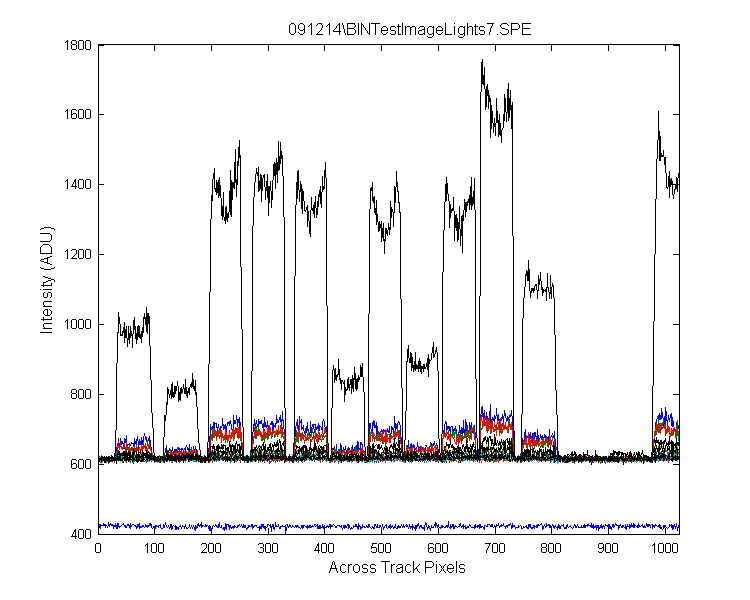
| BINTestLights7.SPE | Dark | 0.1 sec | odd tracks are the between track dark areas, even tracks are the lighted areas |
| BINTestdarks7.SPE | Light | 0.1 sec | odd tracks are the between track dark areas, even tracks are the lighted areas |
| BINTestImagedark7.SPE | Dark | 0.1 sec | full image |
| BINTestImageLights7.SPE | Light | 0.1 sec | full image |
| BINTestImageDk4Sec7.SPE | Dark | 4 sec | full image |
| BINTestImageLt4Sec7.SPE | Dark | 4 sec | full image |
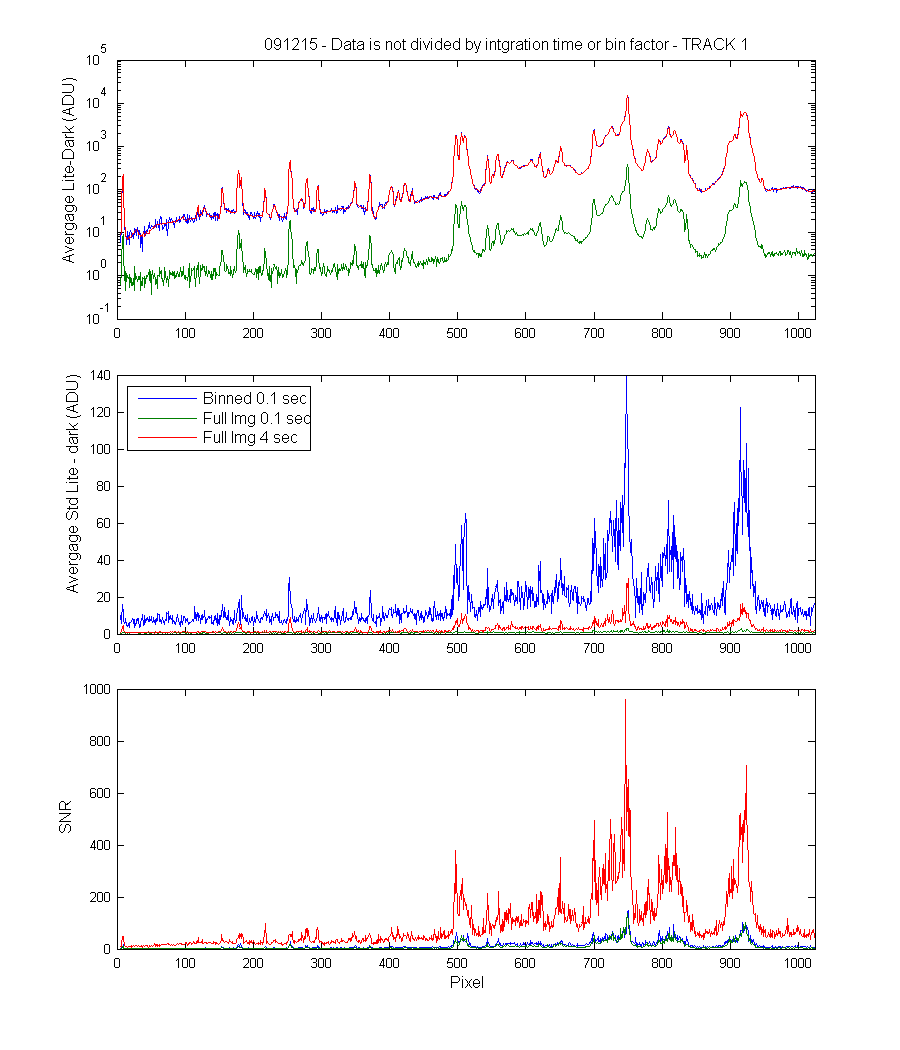
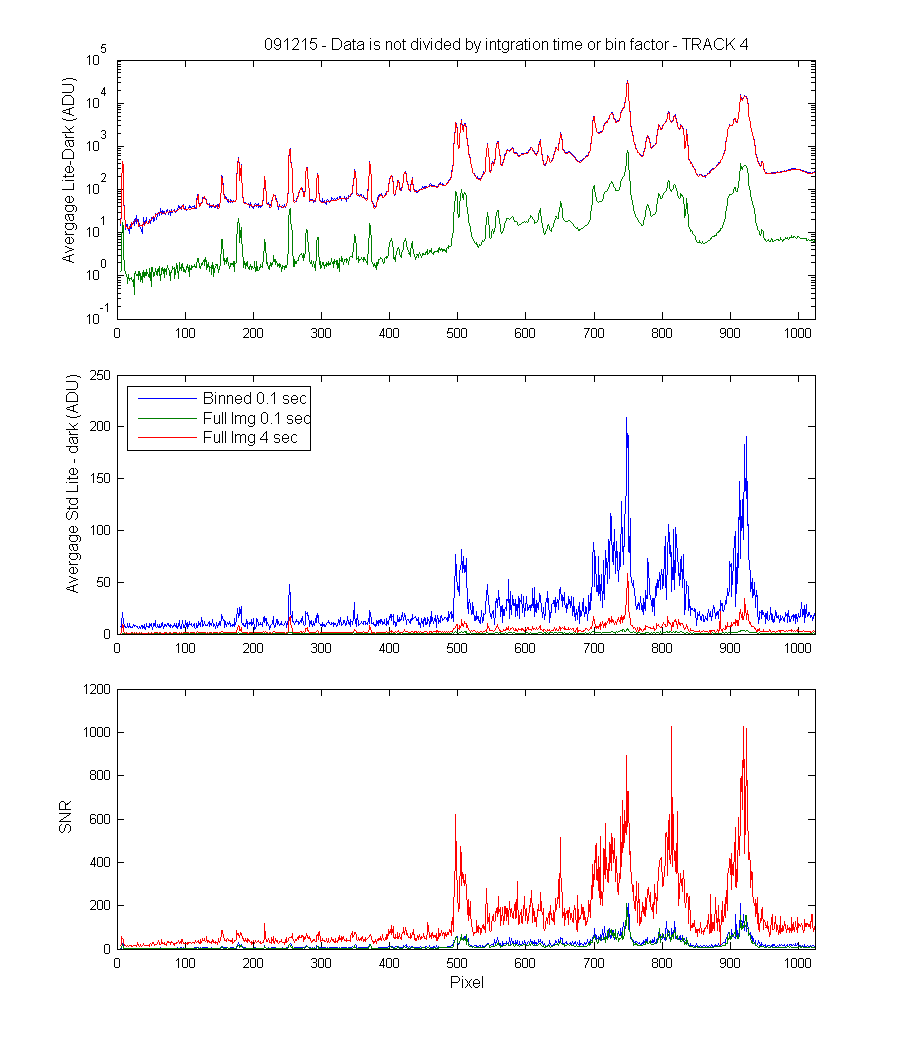
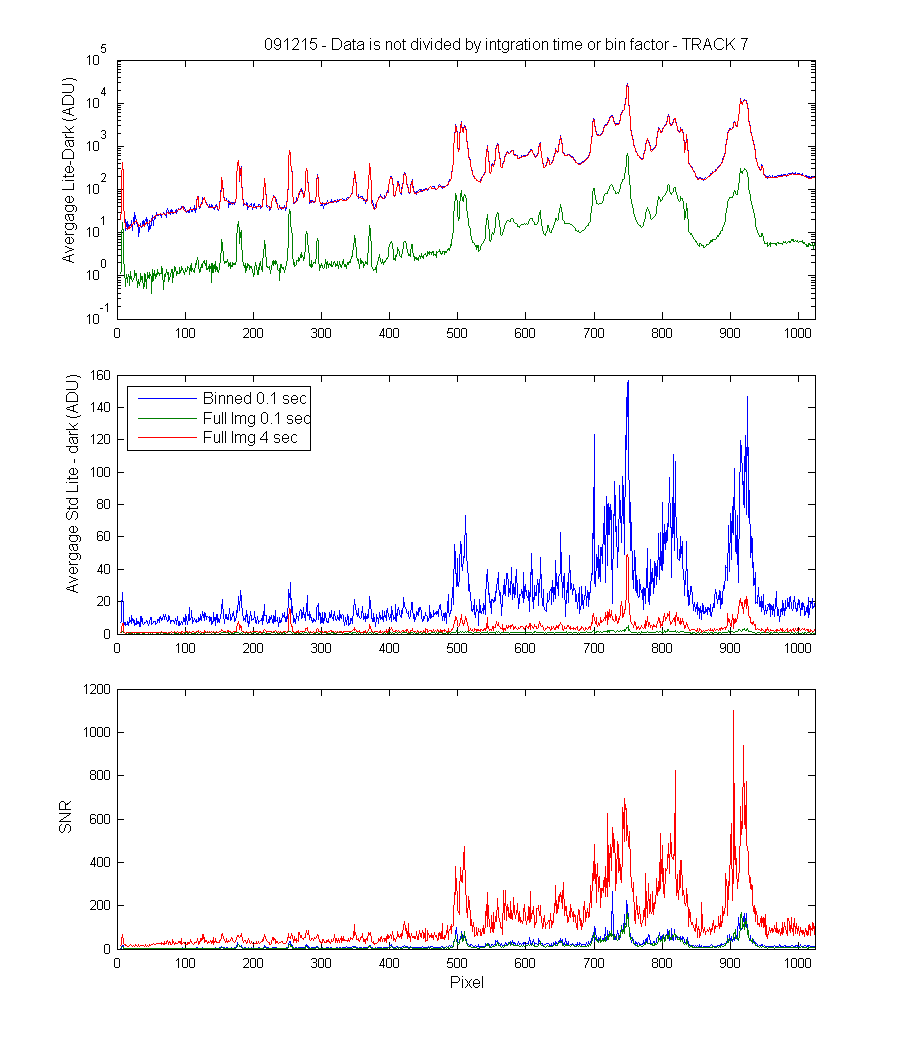
I would like to look for differences in wavelength resolution and SNR
Ideally the 0.1 sec bins and the 40 second image should show comparable signal levels (40 x 0.1 sec = 4 sec) but have different noise
Mark
Email 2 -----------------------------------
Hi Steph,
Mark
Email 3 -----------------------------------
Hi Steph,
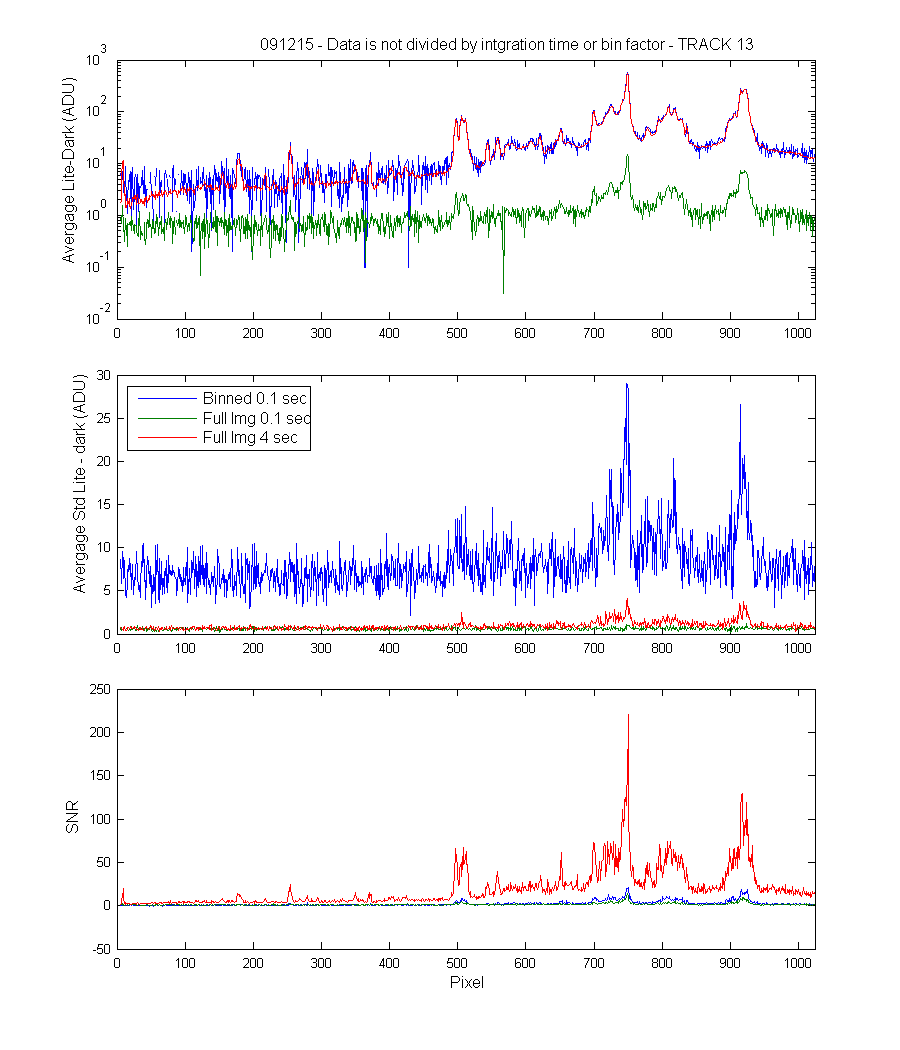
Track 13 had very little light and a number of other tracks were lower.