This set of images is to look at the differences between a full image and the on-chip binned image using the OL455
OL455 source
Darks are with shutter disabled closed
100khz, gain 3
all files are 11 images per file
Dark tracks are bin of 1
Light tracks are bin of 40
| BinTestOL455Bin1SecLt9 | Dark | 1 sec | odd tracks are the between track dark areas, even tracks are the lighted areas |
| BinTestOL455Bin1SecDk9 | Light | 1 sec | odd tracks are the between track dark areas, even tracks are the lighted areas |
| BinTestOL455Full1SecDk9 | Dark | 1 sec | full image |
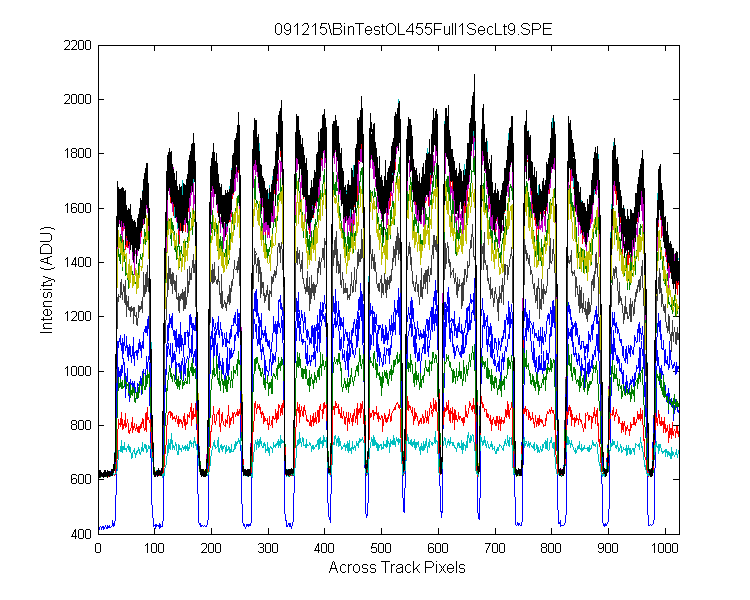
| BinTestOL455Full1SecLt9 | Light | 1 sec | full image |
| BinTestOL455Full40SecDK9 | Dark | 40 sec | full image |
| BinTestOL455Full40SecLt9 | Dark | 40 sec | full image |
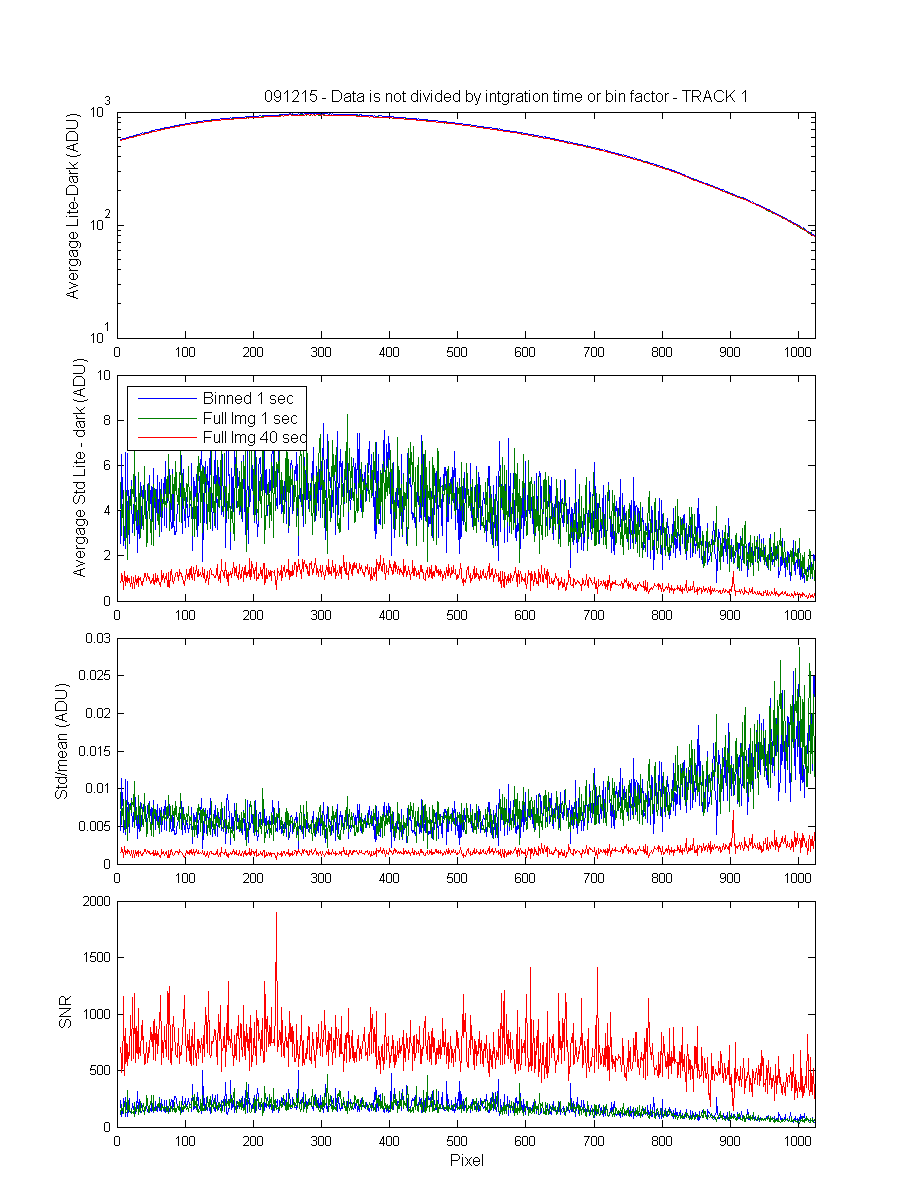
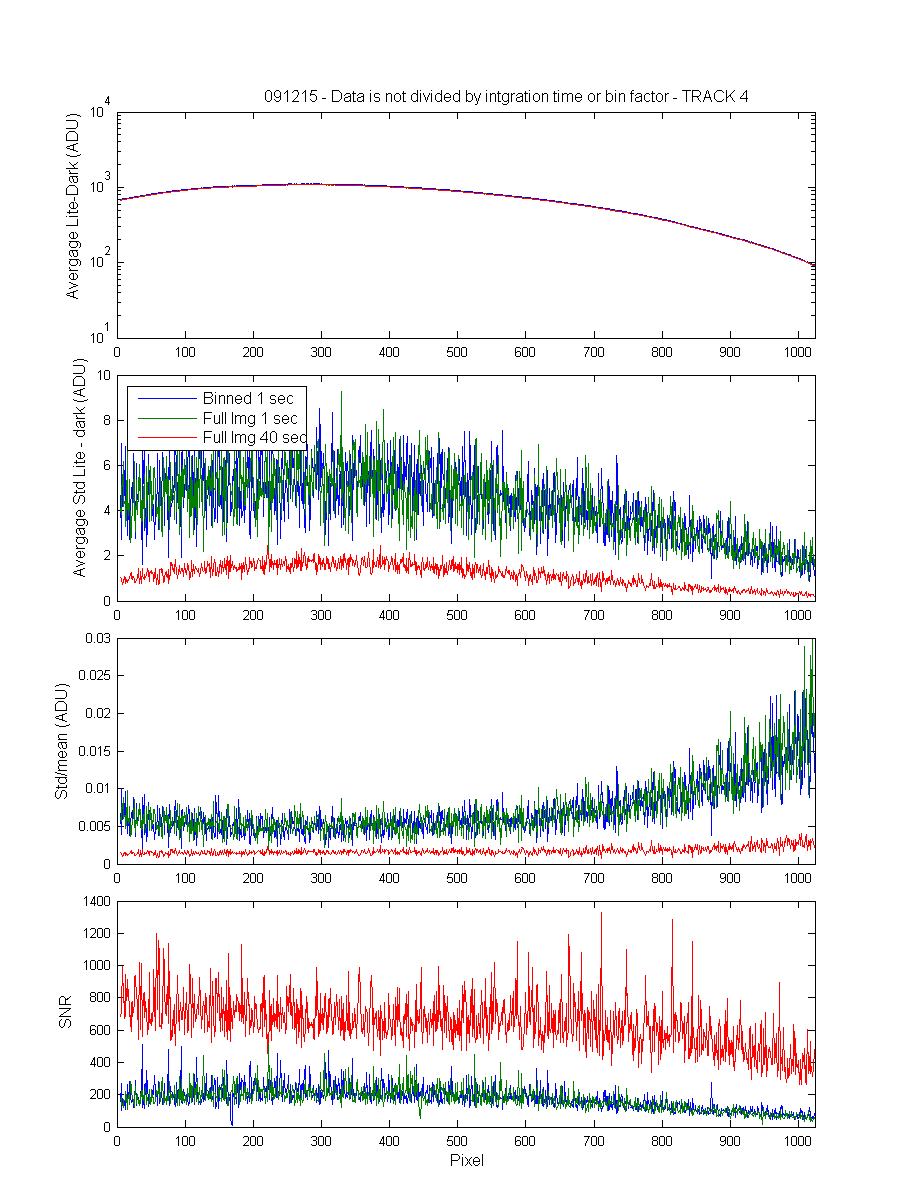
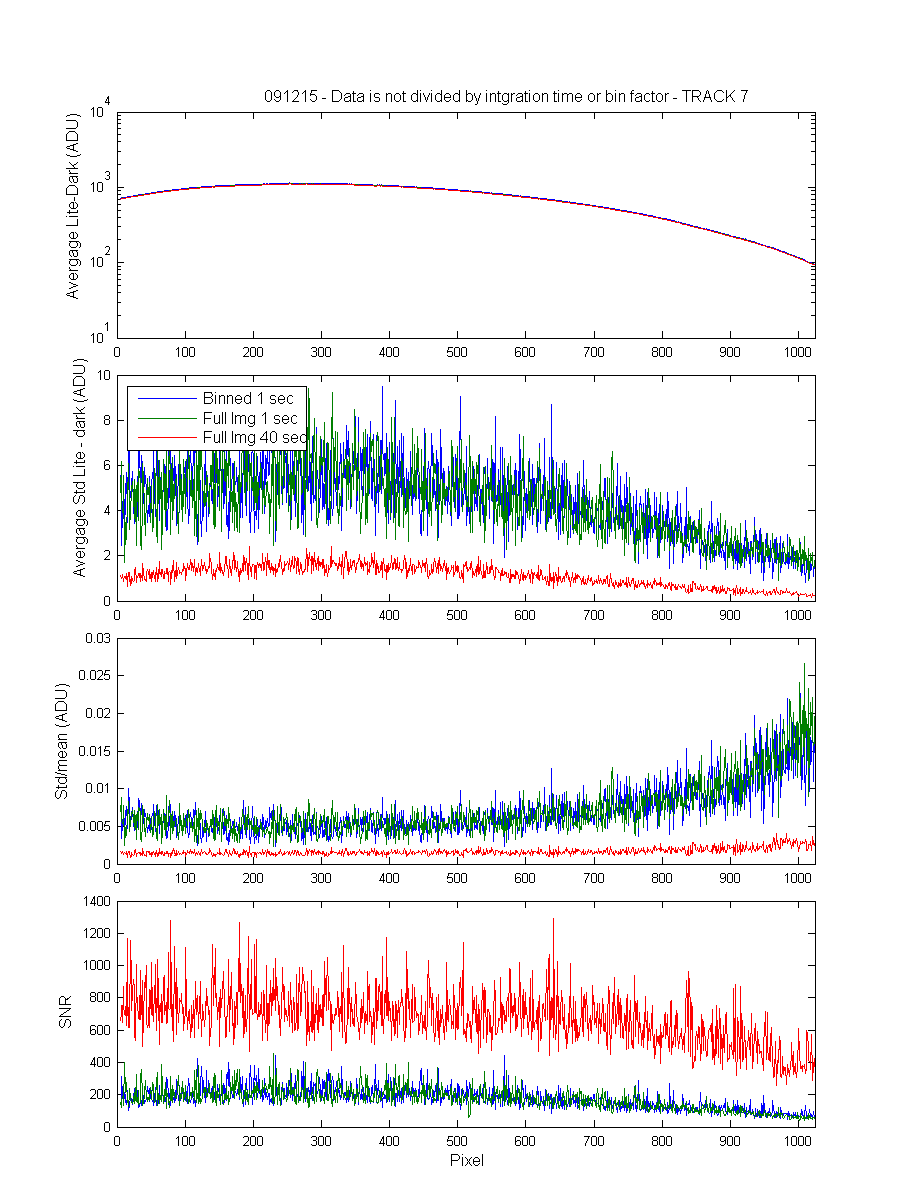
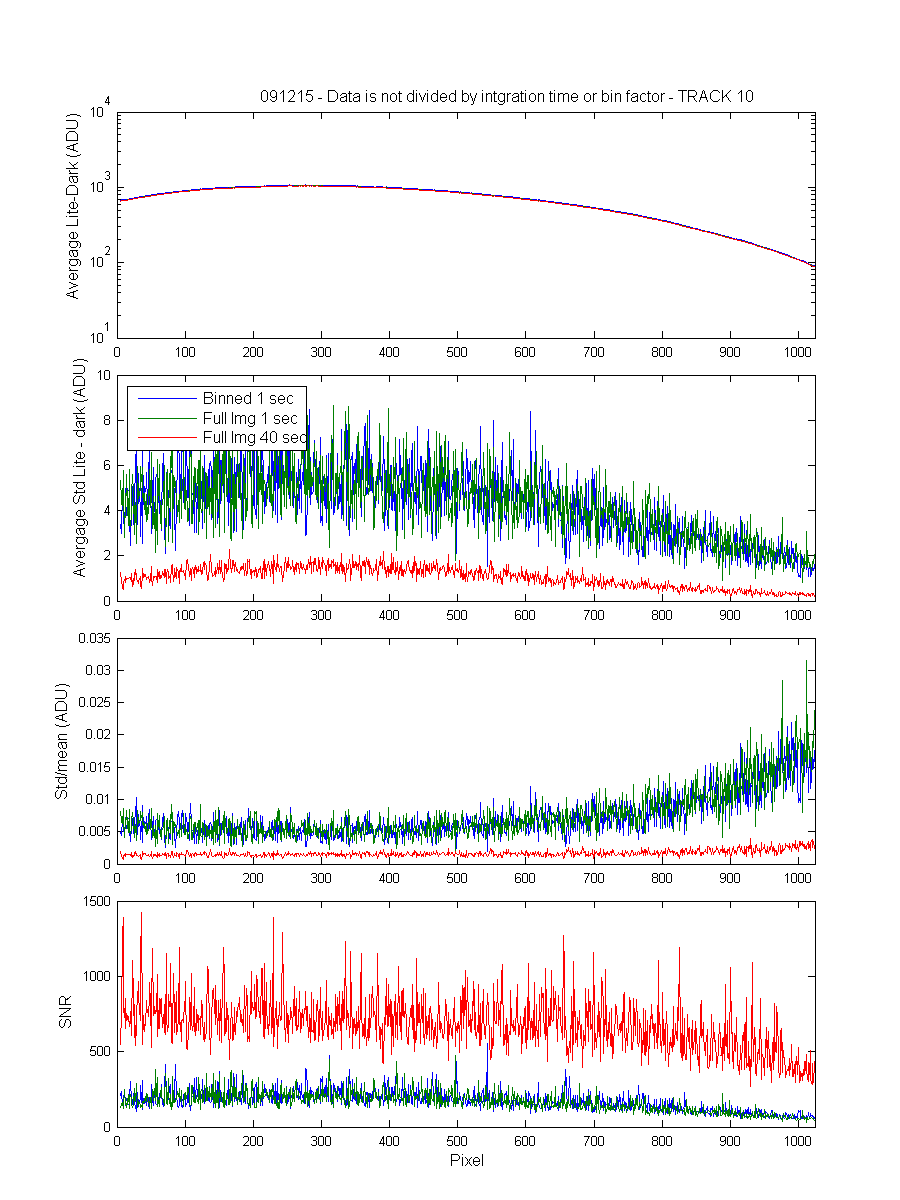
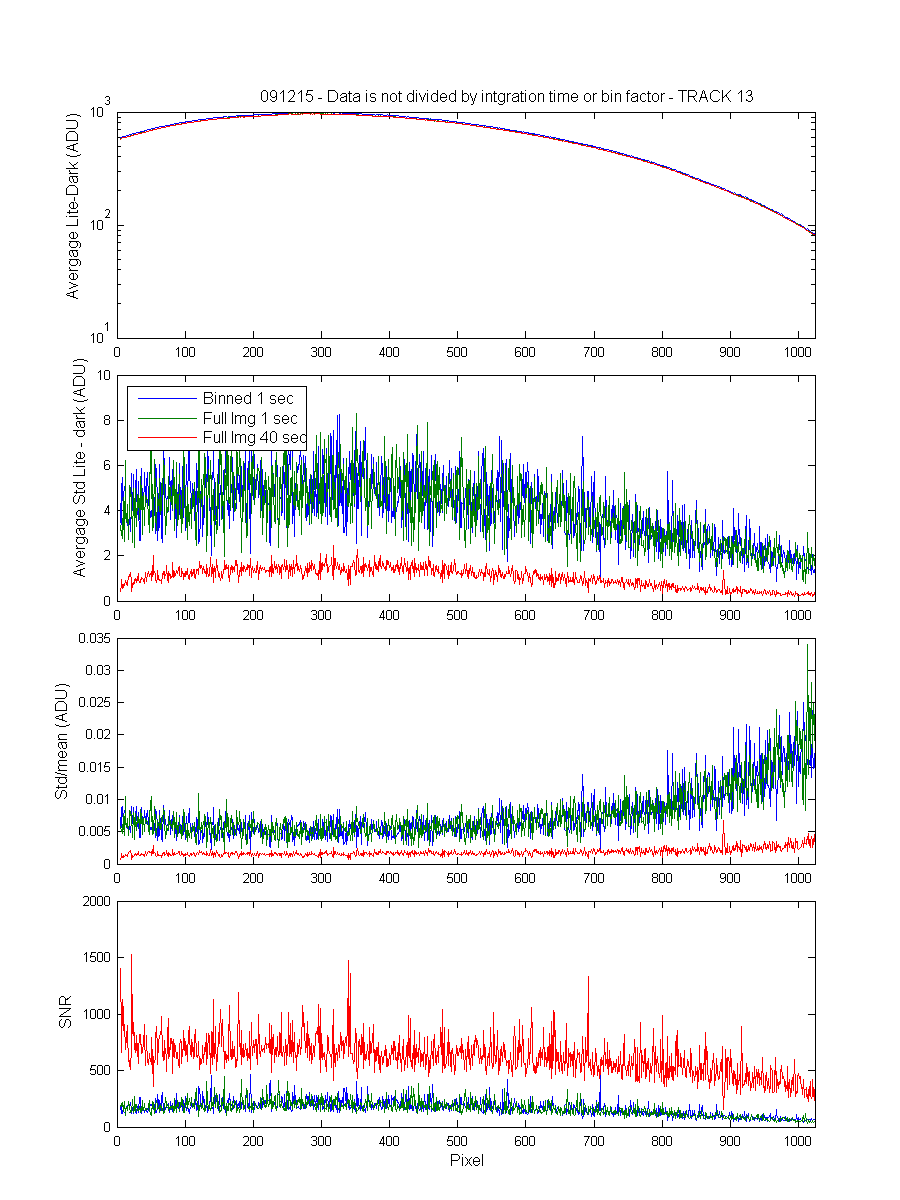
I would like to look for differences in wavelength resolution and SNR
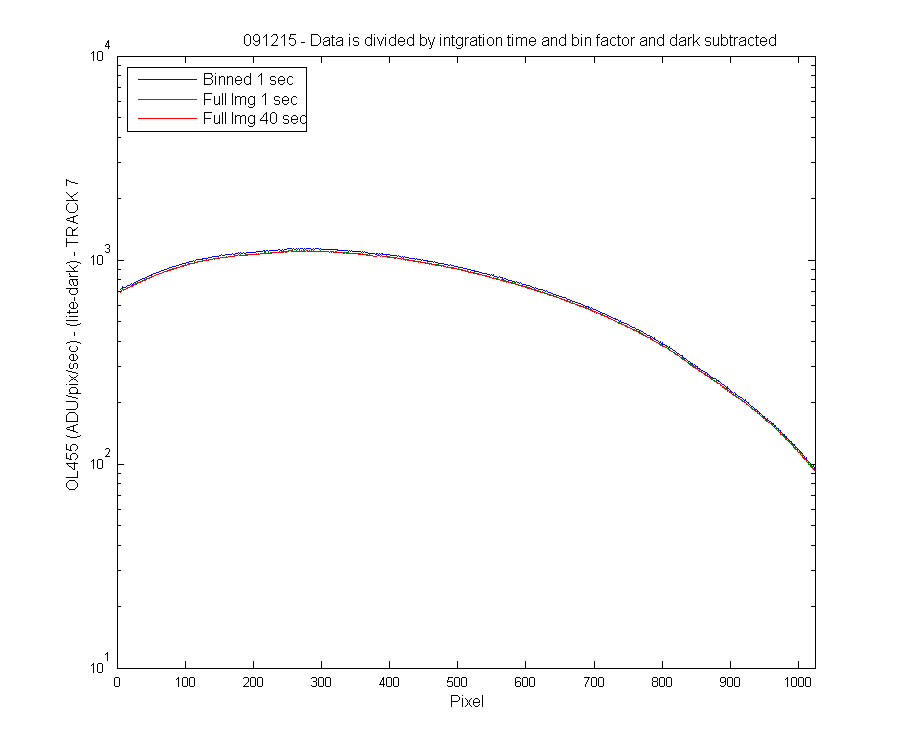
Ideally the 1 sec bins and the 40 second image should show comparable signal levels (40 x 1 sec = 40 sec) but have different noise
Mark
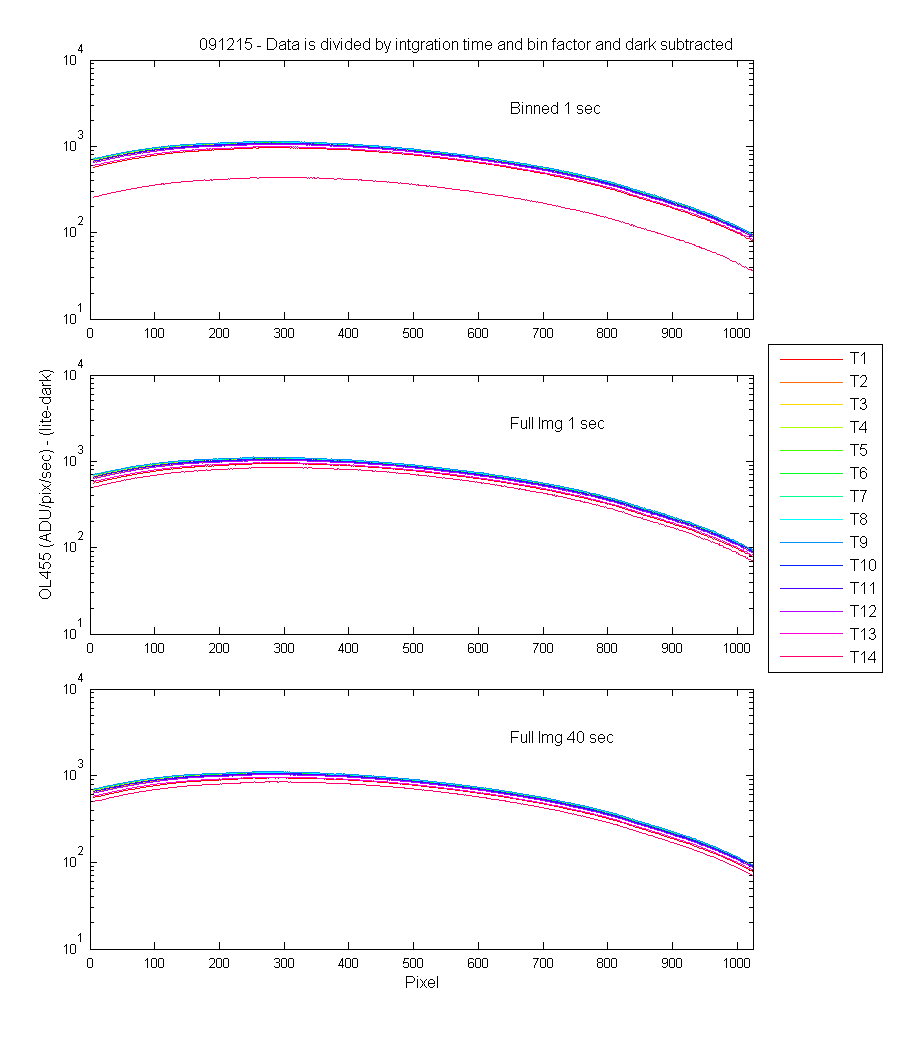
The ALL of the graphs data are divided by intgration time and bin factor. The SNR is calculated on the data in ADU/pix/sec. The first frame is thrown out for all data shown
All tracks wioth light