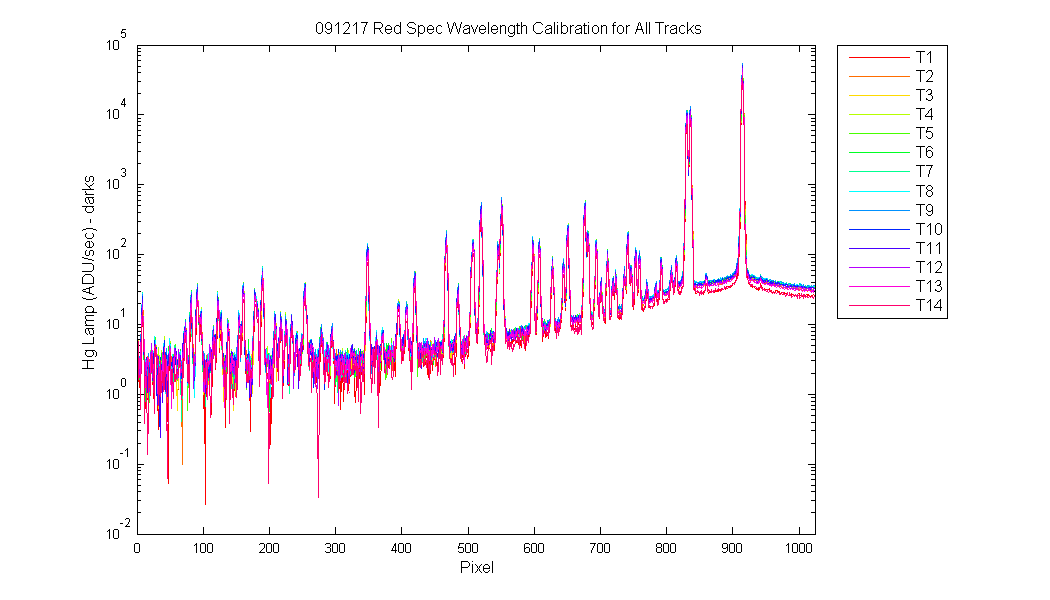
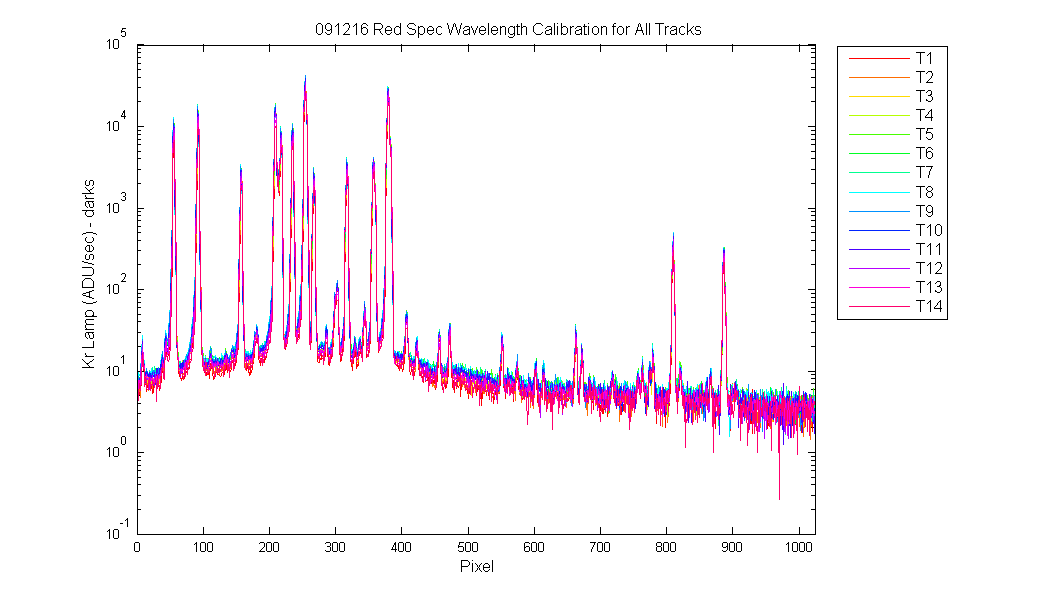
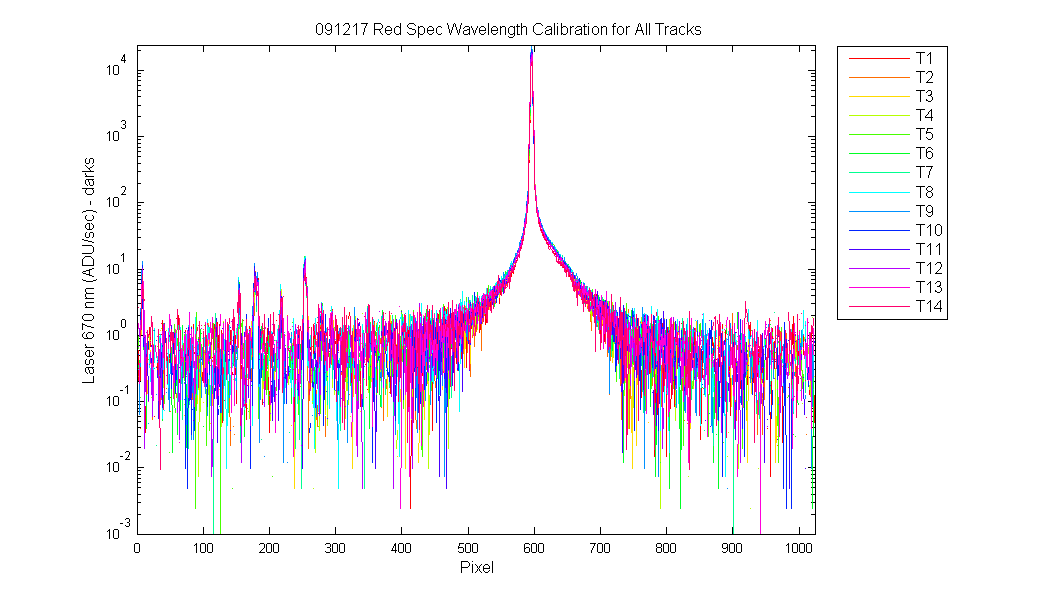
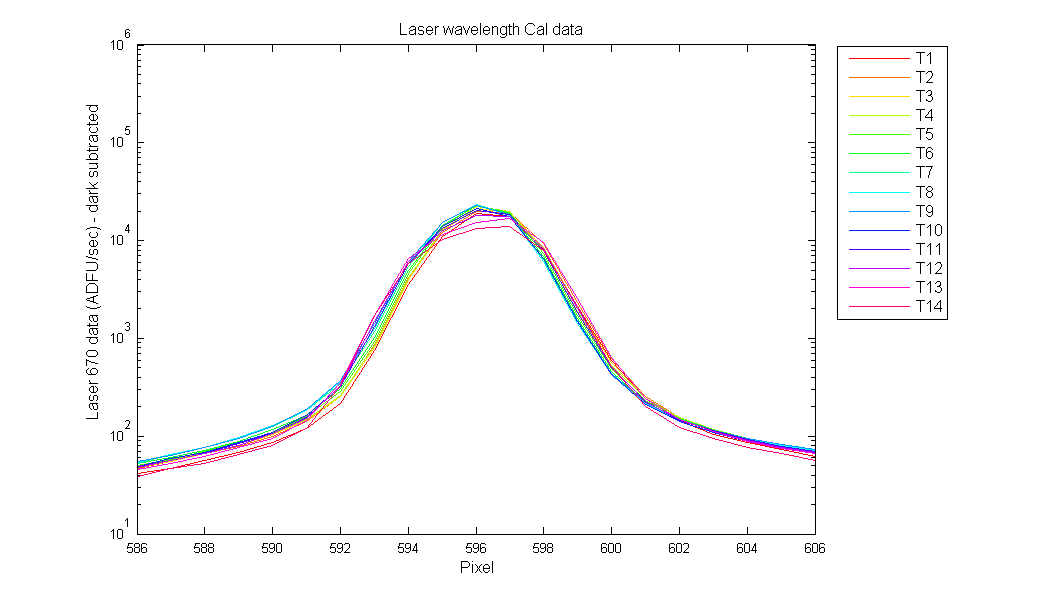
This is the first wavelength calibration of th red spec using the Hg Pen and Kr Lamps and 2 lasers. I did not use the 670 nm laser data because the wavelength was to variable. All the tracks DO NOT have the same pixels for kr,Hg lamp wavelength. I do not do Mikes gaussian fit to each peak, so this is a very rough wavecal.
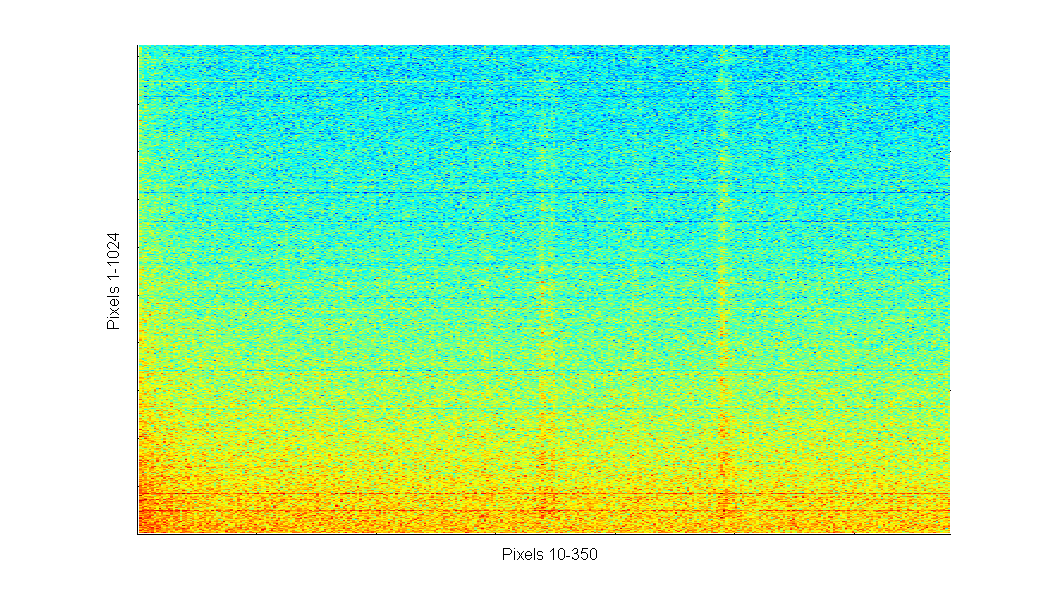
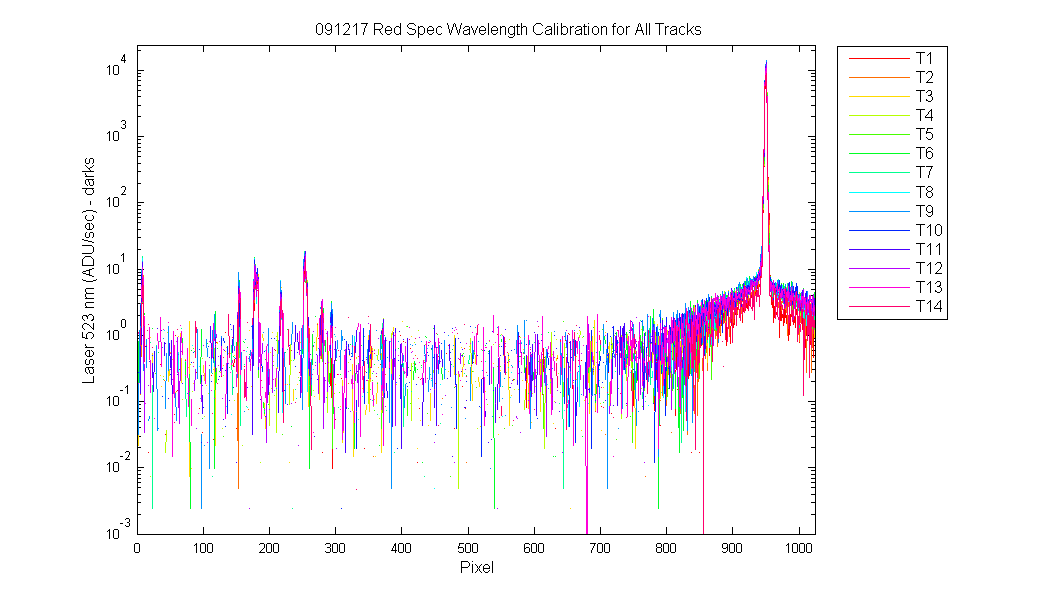
Mark said " We see artifacts in the Red system when looking at the laser data I took (both the Red and Green). They are small but they (three lines) are noticeable in the red end of the spectrum when I blow up the scale using WinView." I found the lines he mentioned on the RWavecal_L650_1Sec_LI8.SPE image. Later is was discovered these lines were from the computer screen, whoch was not curtained off from the spec. The first image shows the 2 of the lines Mark and Carol were seeing.
| Track | Regress coeff 1 | Regress coeff 2 | Regress coeff 3 | Min Wave | Max Wave | Wave Res |
|---|---|---|---|---|---|---|
| 1 | 1.089817e-005 | -0.4149 | 916.0655 | 502.6403 | 915.6506 | 0.40372 |
| 2 | 1.036493e-005 | -0.41434 | 915.935 | 502.5216 | 915.5207 | 0.40371 |
| 3 | 1.082101e-005 | -0.41421 | 915.7982 | 502.9951 | 915.384 | 0.40312 |
| 4 | 8.840141e-006 | -0.41287 | 915.5608 | 502.0551 | 915.148 | 0.40381 |
| 5 | 9.424372e-006 | -0.41335 | 915.616 | 502.2269 | 915.2027 | 0.40369 |
| 6 | 1.282460e-005 | -0.4158 | 915.9018 | 503.5668 | 915.486 | 0.40266 |
| 7 | 1.339903e-005 | -0.41633 | 915.9782 | 503.708 | 915.5619 | 0.40259 |
| 8 | 1.217226e-005 | -0.41555 | 915.8935 | 503.1314 | 915.4779 | 0.40308 |
| 9 | 1.134211e-005 | -0.41496 | 915.8318 | 502.8077 | 915.4168 | 0.40333 |
| 10 | 9.881166e-006 | -0.41381 | 915.6679 | 502.2904 | 915.2541 | 0.40368 |
| 11 | 9.402163e-006 | -0.41319 | 915.682 | 502.437 | 915.2689 | 0.40355 |
| 12 | 1.090255e-005 | -0.41485 | 916.1789 | 502.8033 | 915.7641 | 0.40368 |
| 13 | 1.186374e-005 | -0.41563 | 916.3157 | 503.149 | 915.9001 | 0.40347 |
| 14 | 1.217461e-005 | -0.41577 | 916.343 | 503.3622 | 915.9273 | 0.40329 |
| Wavelength | 532 | 892.9 | 877.7 | 850.9 | 819 | 806 | 785.5 | 774.7 | 748.7 | 722.4 | 690.5 | 645.6 | 642.1 | 577 | 579.1 |
|---|---|---|---|---|---|---|---|---|---|---|---|---|---|---|---|
| Track 1 | 948 | 56 | 93 | 158 | 235 | 267 | 317 | 344 | 407 | 473 | 552 | 663 | 672 | 836 | 832 |
| Track 2 | 949 | 56 | 92 | 158 | 235 | 267 | 317 | 344 | 408 | 473 | 552 | 663 | 672 | 838 | 828 |
| Track 3 | 950 | 55 | 92 | 158 | 235 | 267 | 317 | 344 | 408 | 473 | 552 | 663 | 672 | 838 | 830 |
| Track 4 | 948 | 55 | 92 | 157 | 235 | 267 | 317 | 344 | 407 | 473 | 552 | 663 | 672 | 837 | 828 |
| Track 5 | 948 | 55 | 92 | 157 | 235 | 267 | 317 | 344 | 407 | 473 | 551 | 663 | 672 | 834 | 832 |
| Track 6 | 951 | 55 | 92 | 157 | 235 | 267 | 317 | 344 | 407 | 472 | 551 | 663 | 672 | 837 | 832 |
| Track 7 | 952 | 55 | 92 | 157 | 235 | 267 | 317 | 344 | 407 | 472 | 551 | 663 | 672 | 838 | 830 |
| Track 8 | 951 | 55 | 92 | 157 | 235 | 267 | 317 | 344 | 407 | 472 | 551 | 663 | 672 | 836 | 830 |
| Track 9 | 951 | 55 | 92 | 157 | 235 | 267 | 317 | 344 | 407 | 472 | 552 | 663 | 672 | 836 | 828 |
| Track 10 | 948 | 55 | 92 | 157 | 235 | 267 | 317 | 344 | 407 | 472 | 551 | 663 | 672 | 835 | 831 |
| Track 11 | 948 | 55 | 92 | 158 | 235 | 267 | 318 | 344 | 407 | 473 | 552 | 663 | 672 | 836 | 832 |
| Track 12 | 949 | 56 | 93 | 158 | 236 | 268 | 318 | 344 | 407 | 473 | 552 | 663 | 673 | 836 | 832 |
| Track 13 | 951 | 56 | 93 | 158 | 236 | 268 | 318 | 345 | 407 | 473 | 552 | 663 | 673 | 835 | 832 |
| Track 14 | 951 | 56 | 93 | 158 | 236 | 268 | 318 | 345 | 408 | 473 | 552 | 663 | 672 | 837 | 832 |
Lines on image from the computer screen.
All four data sets, kr, Hg and 532 and 670 Laser.
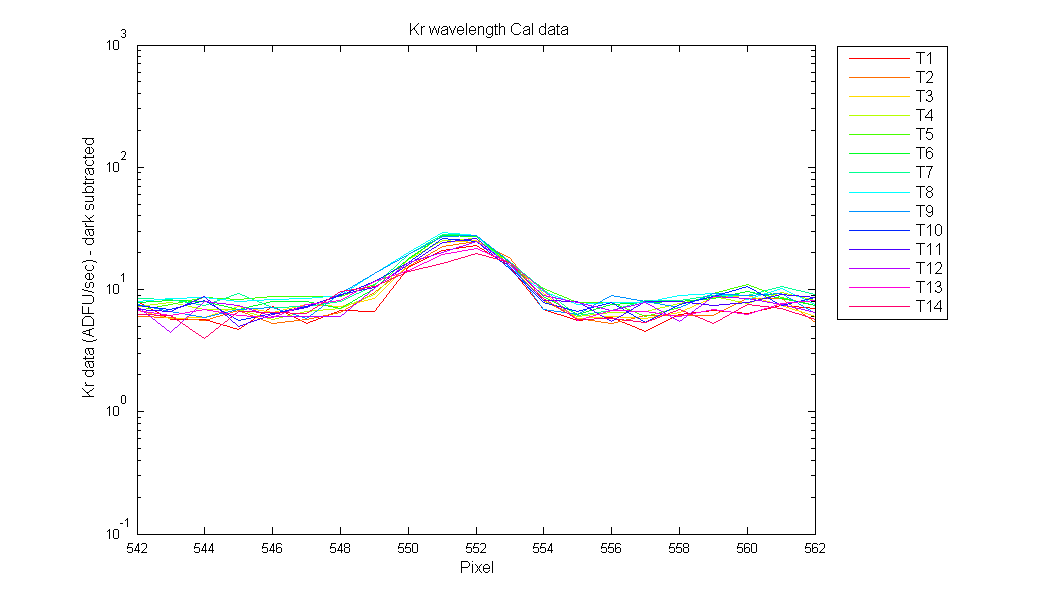
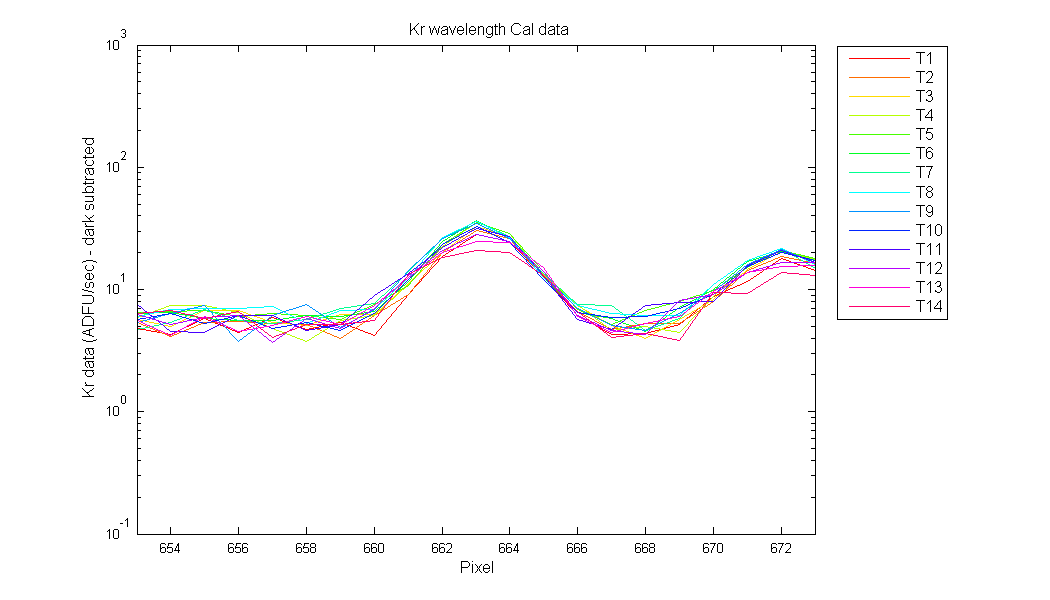
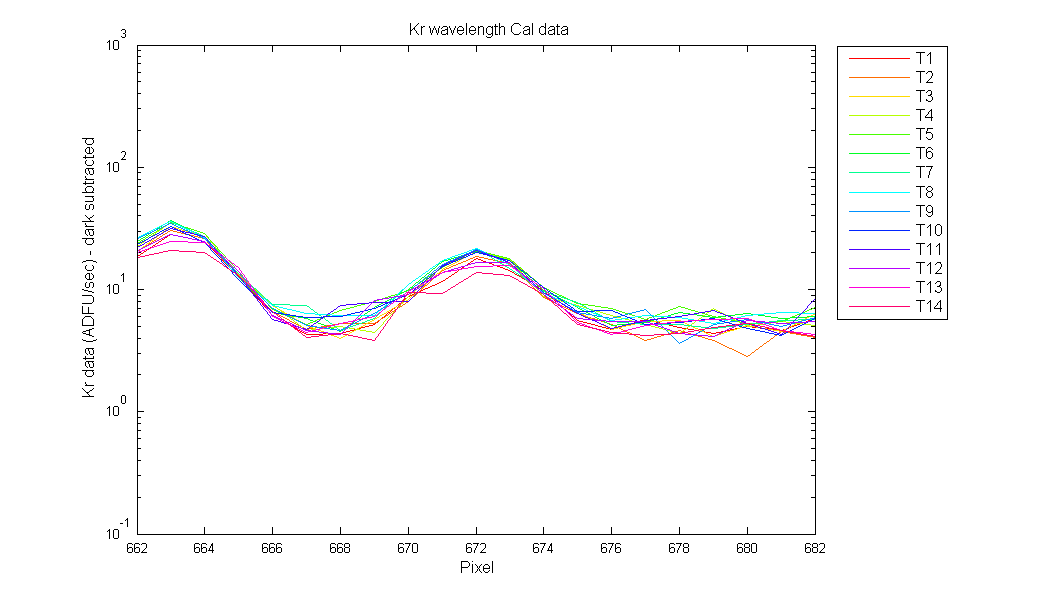
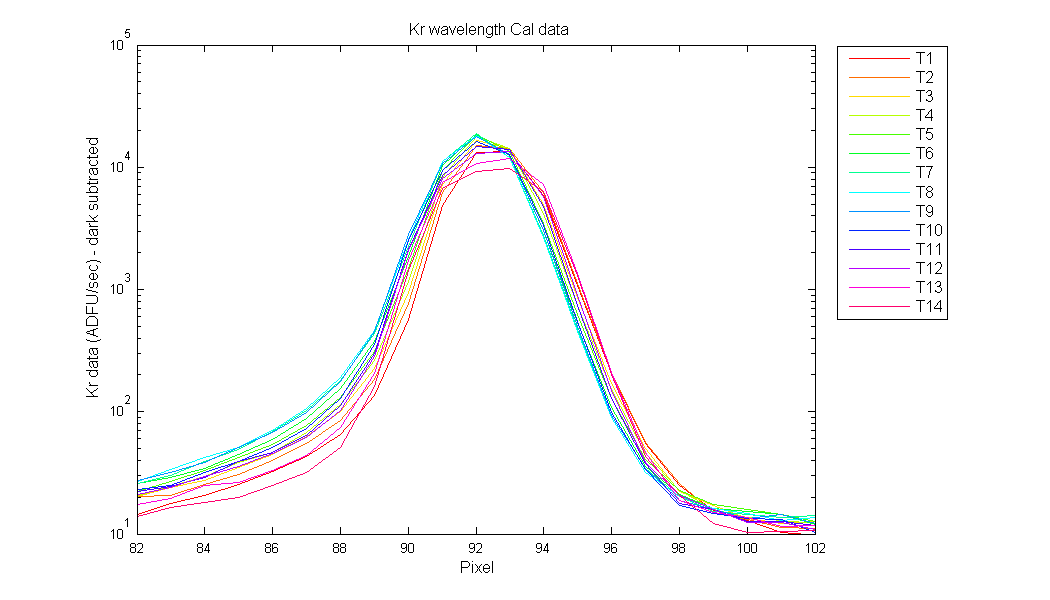
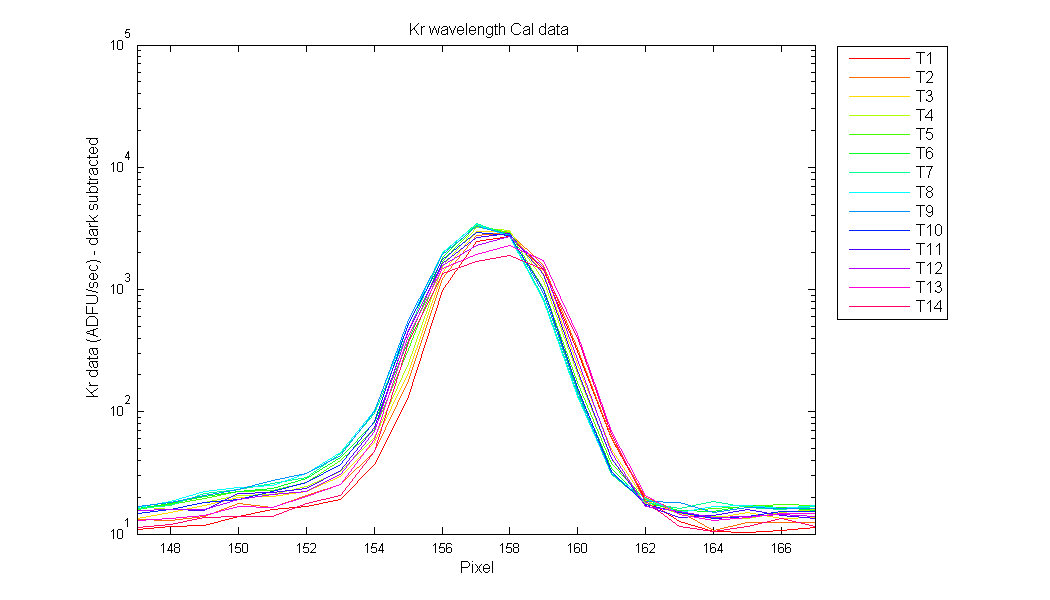
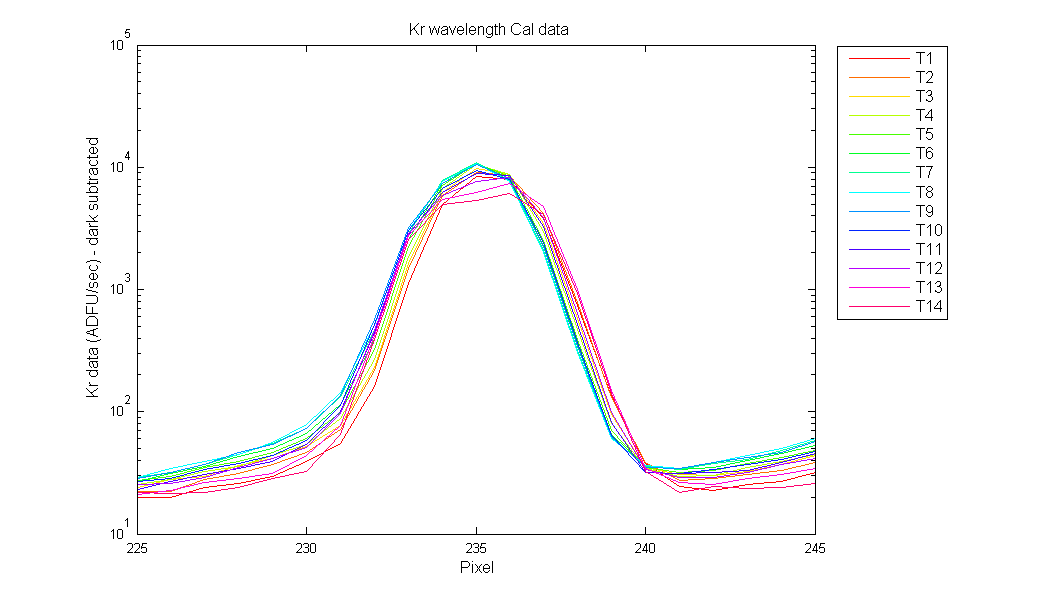
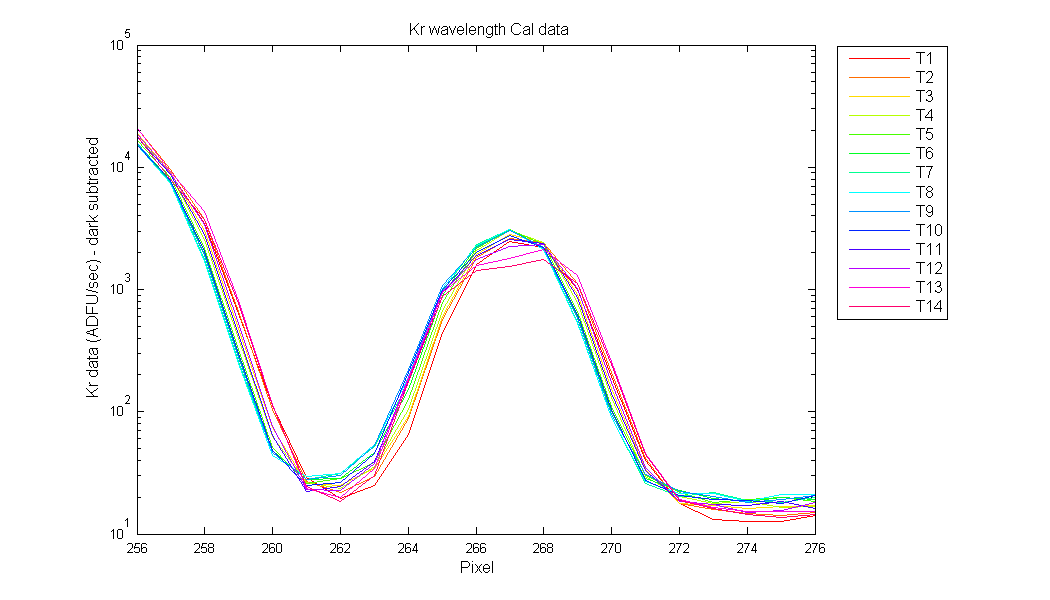
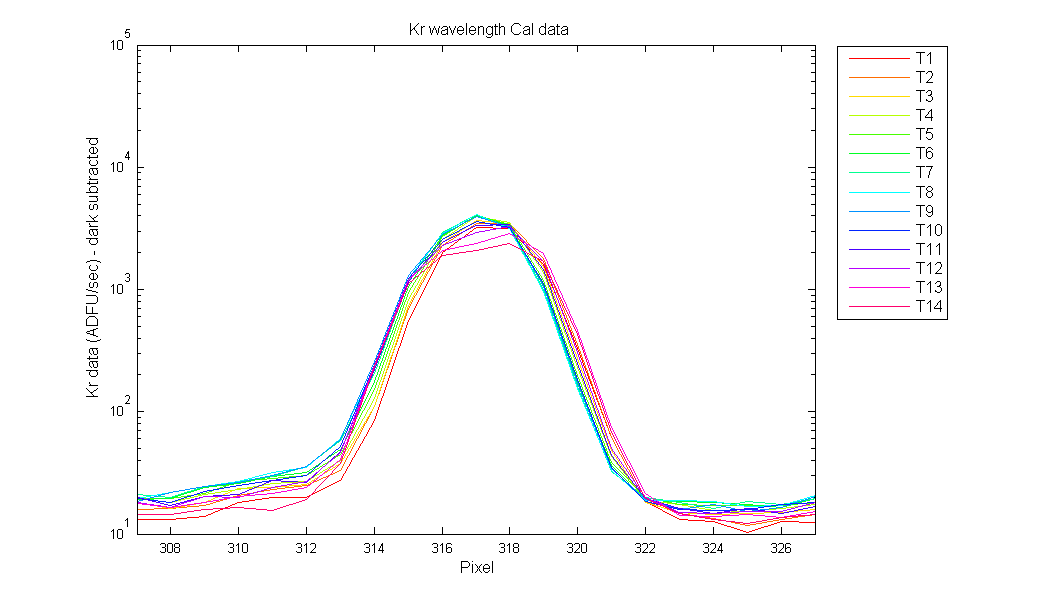
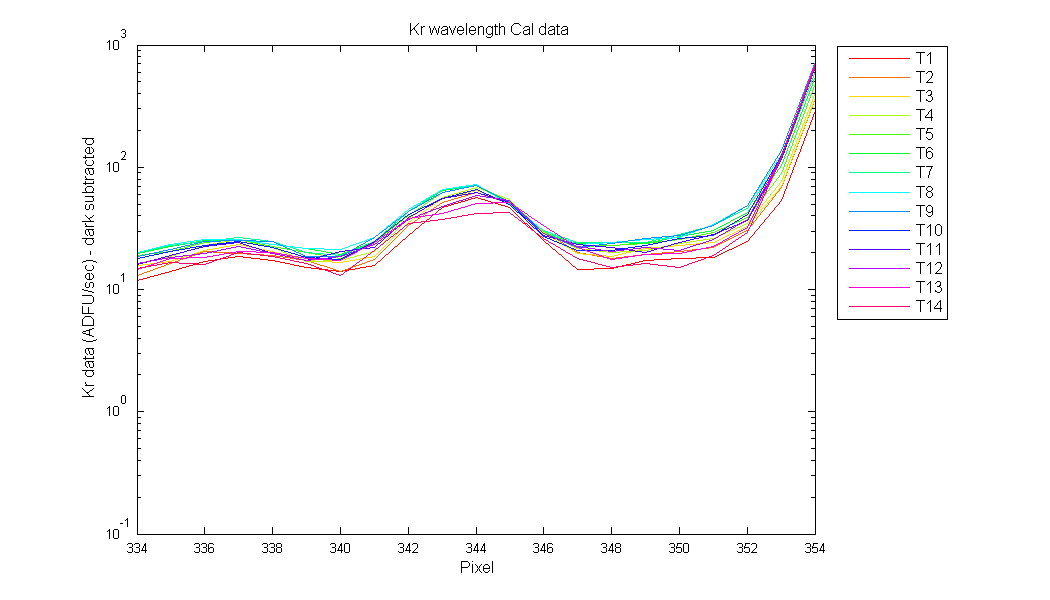
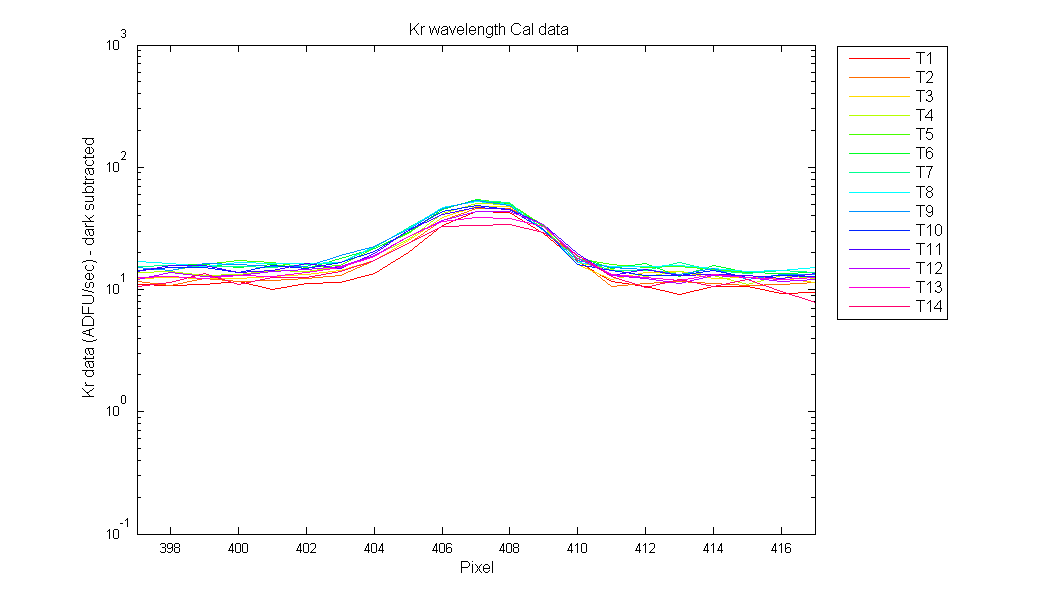
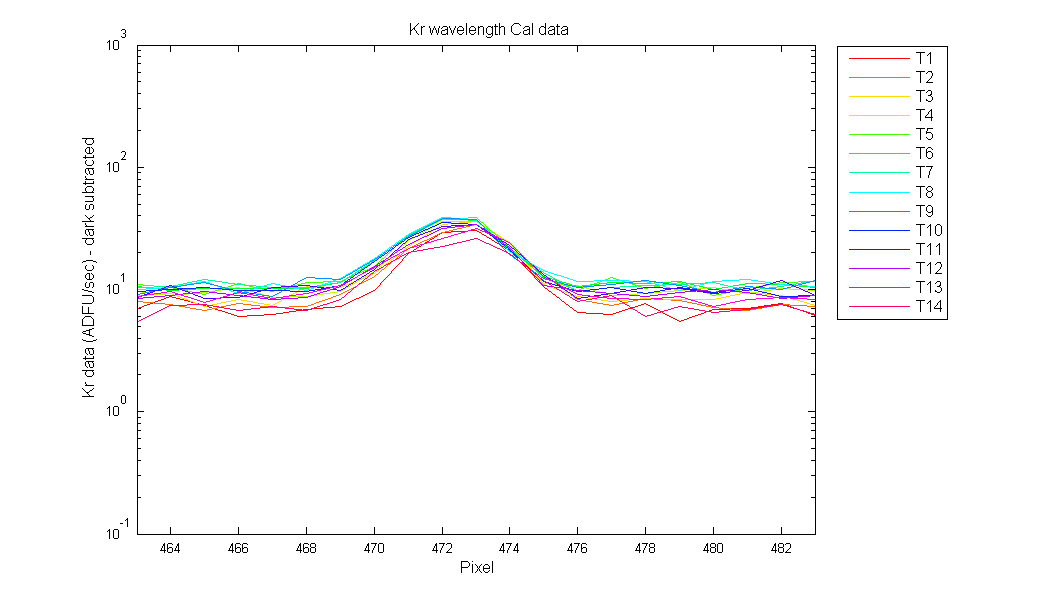
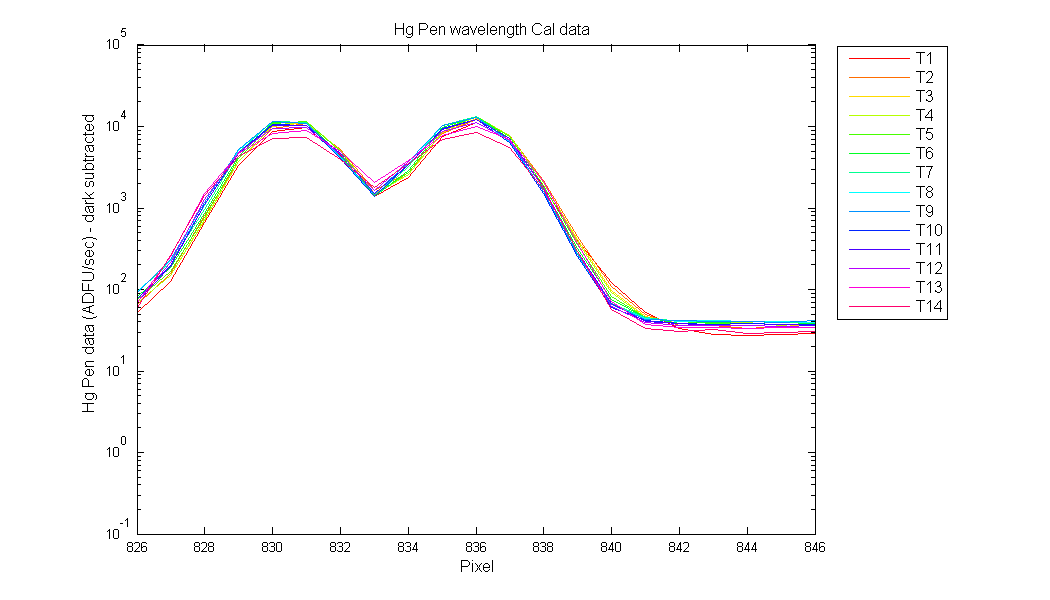
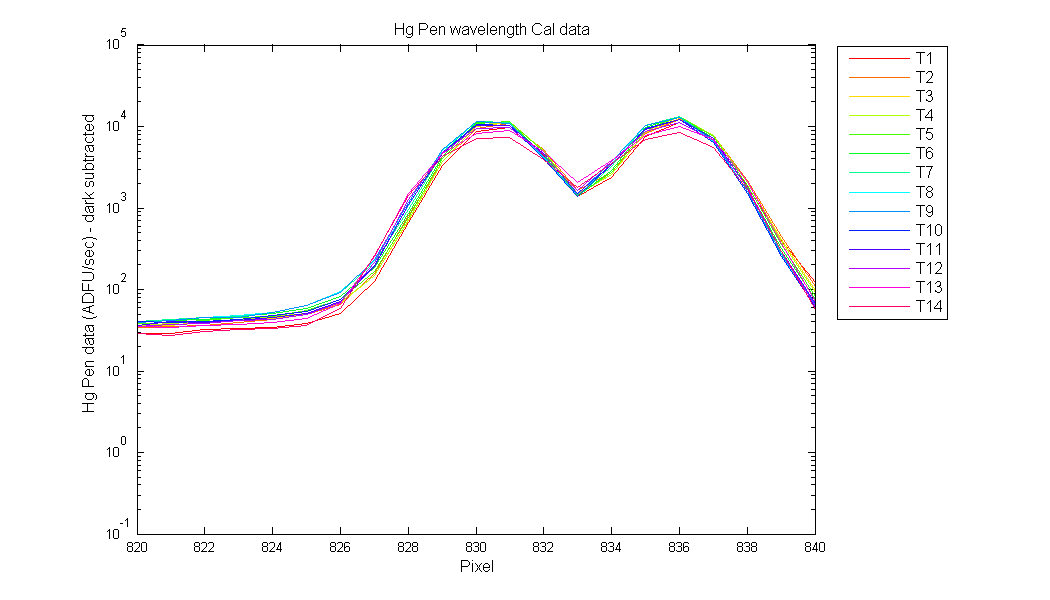
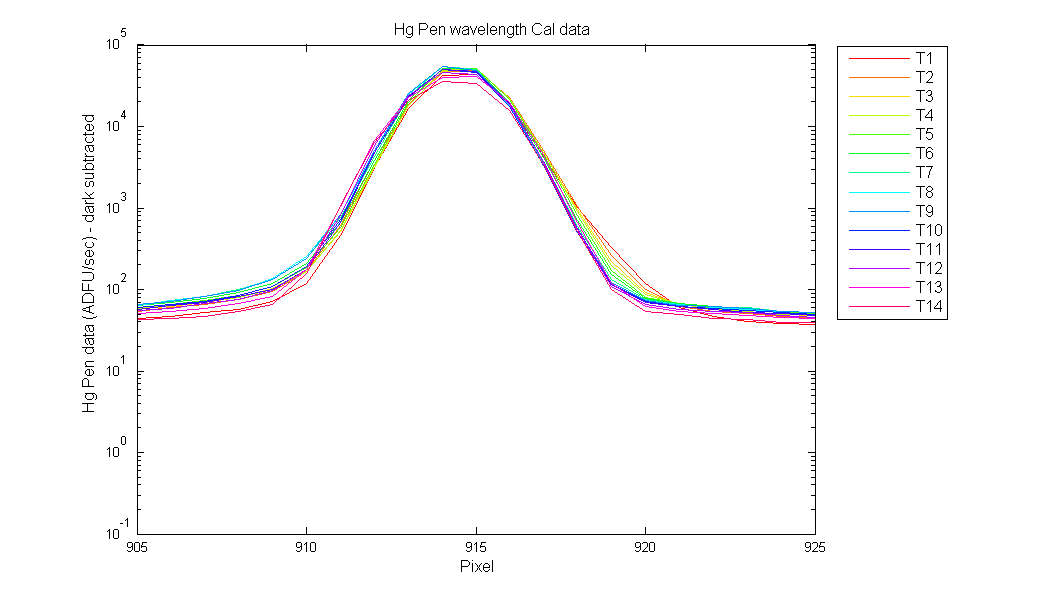
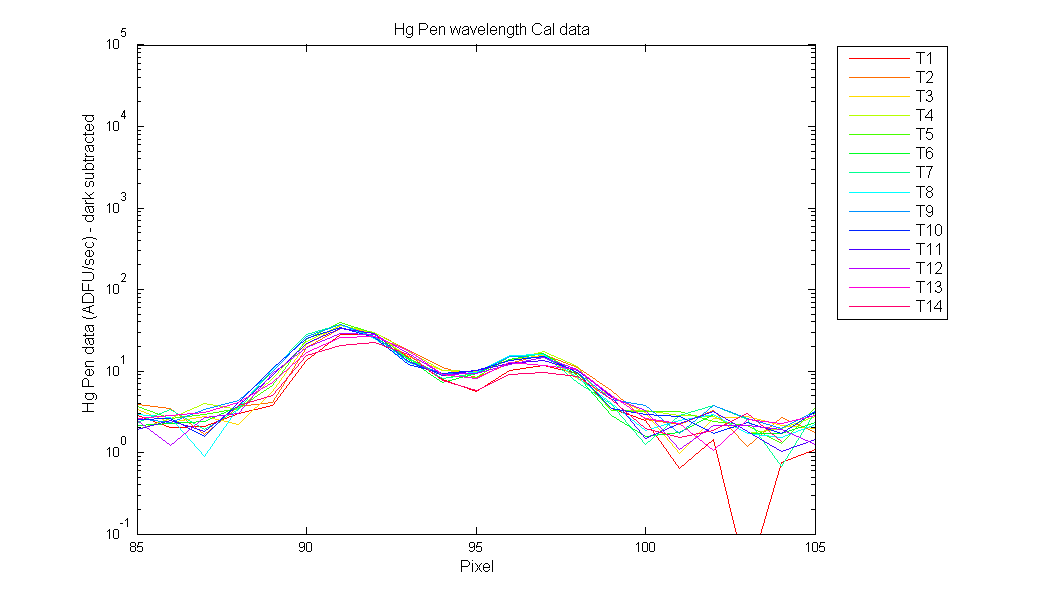
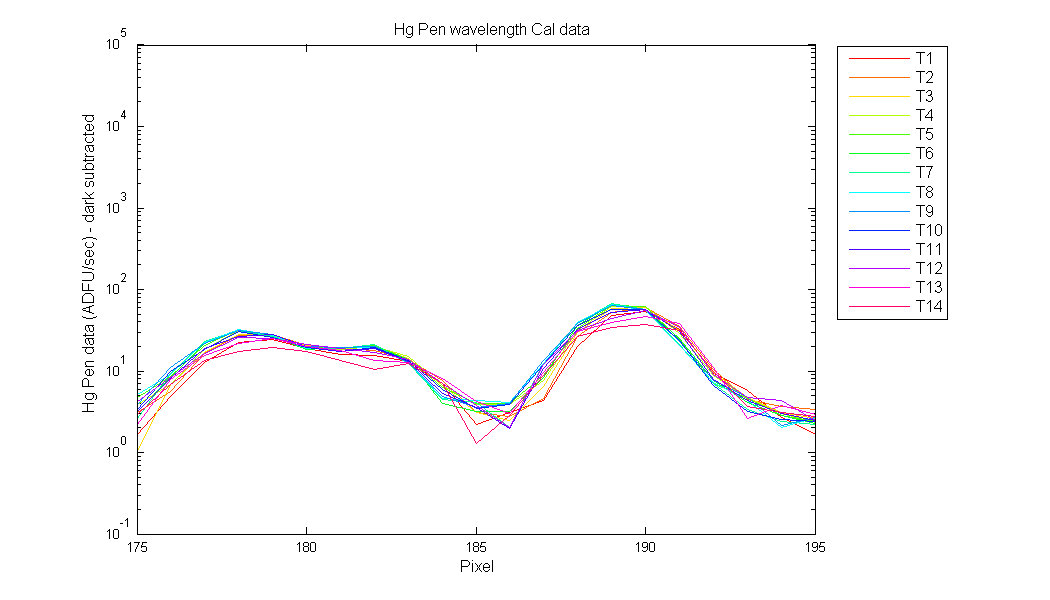
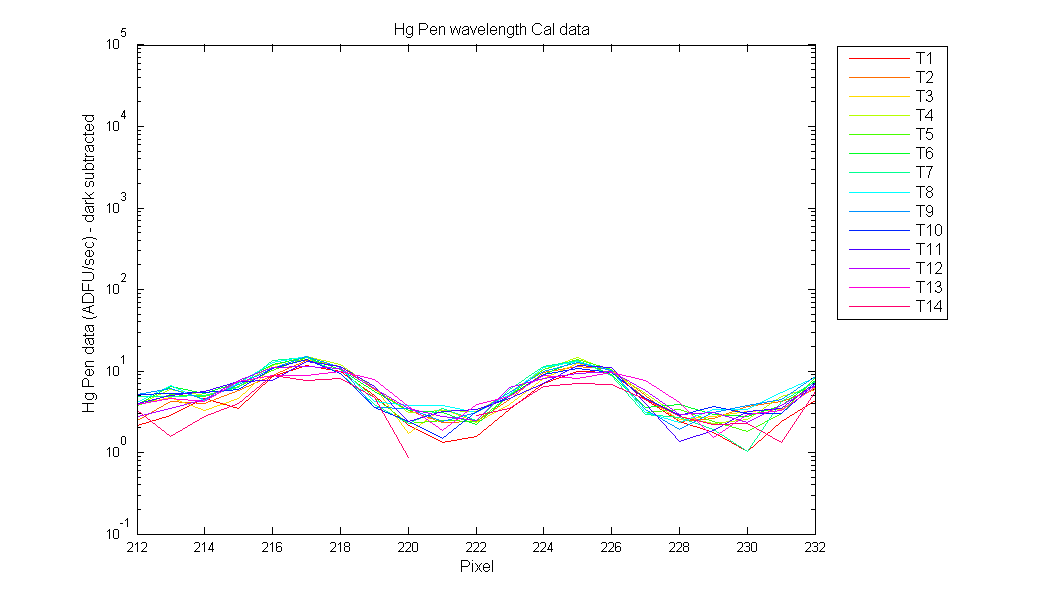
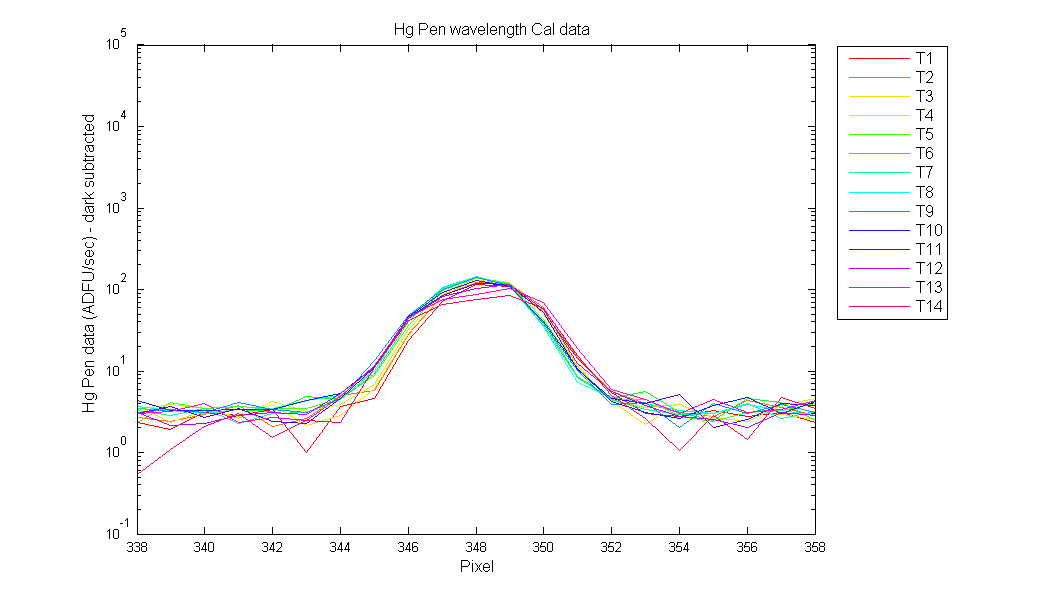
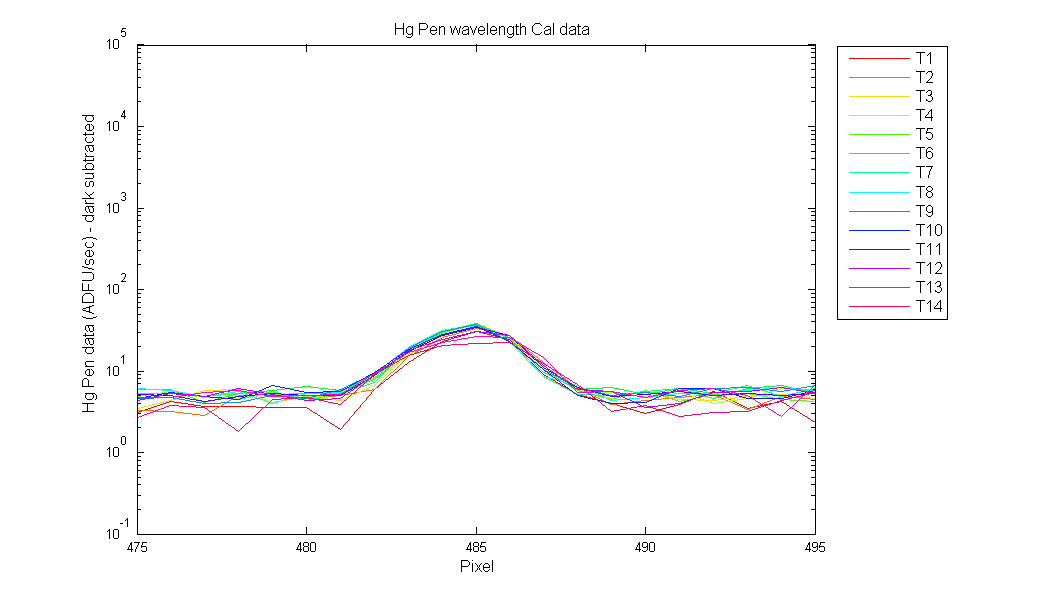
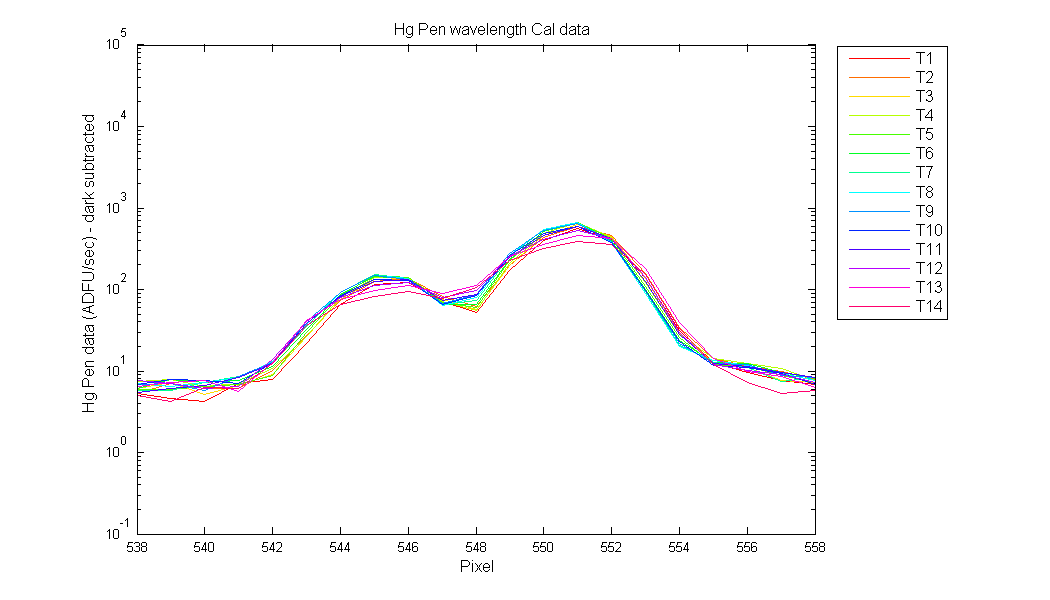
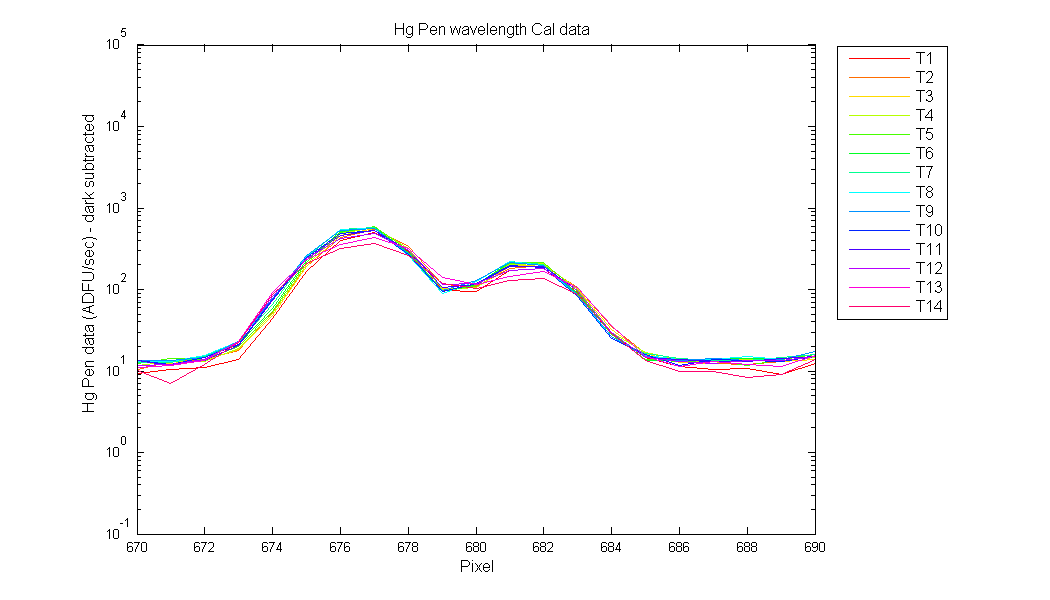
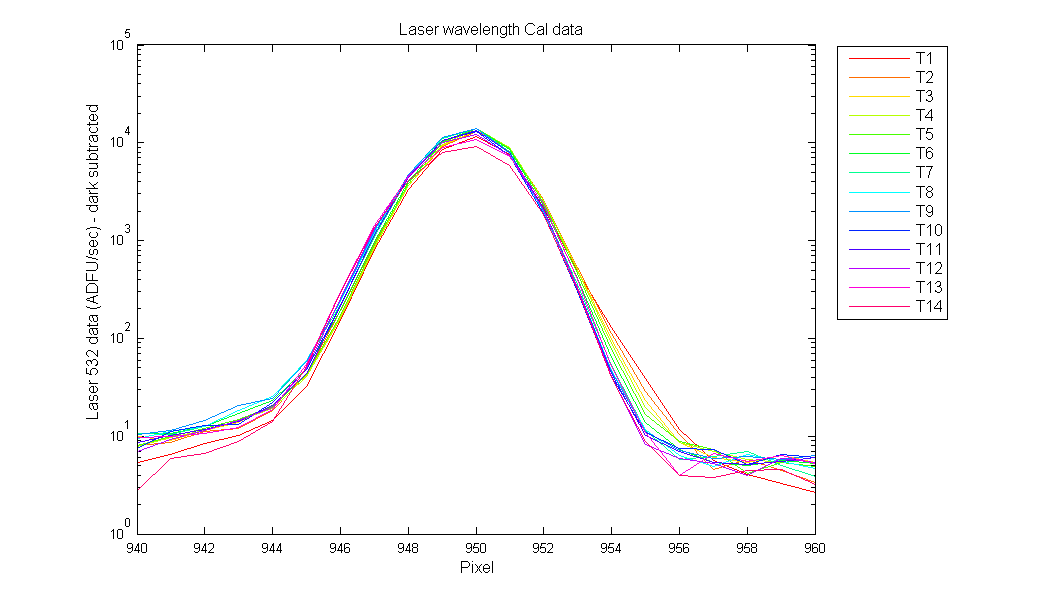
Zoomed in view of each peak

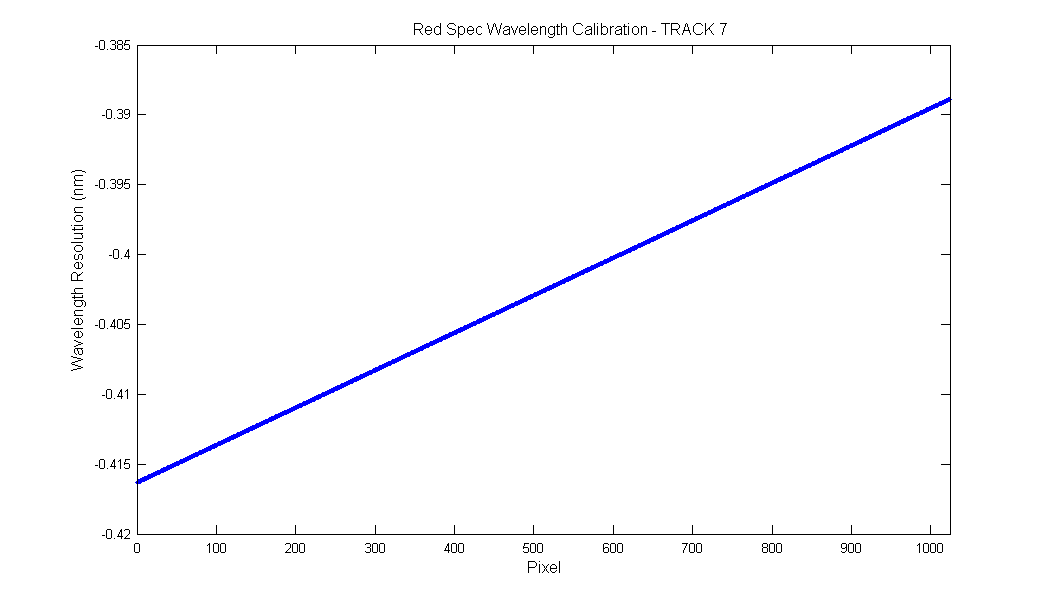
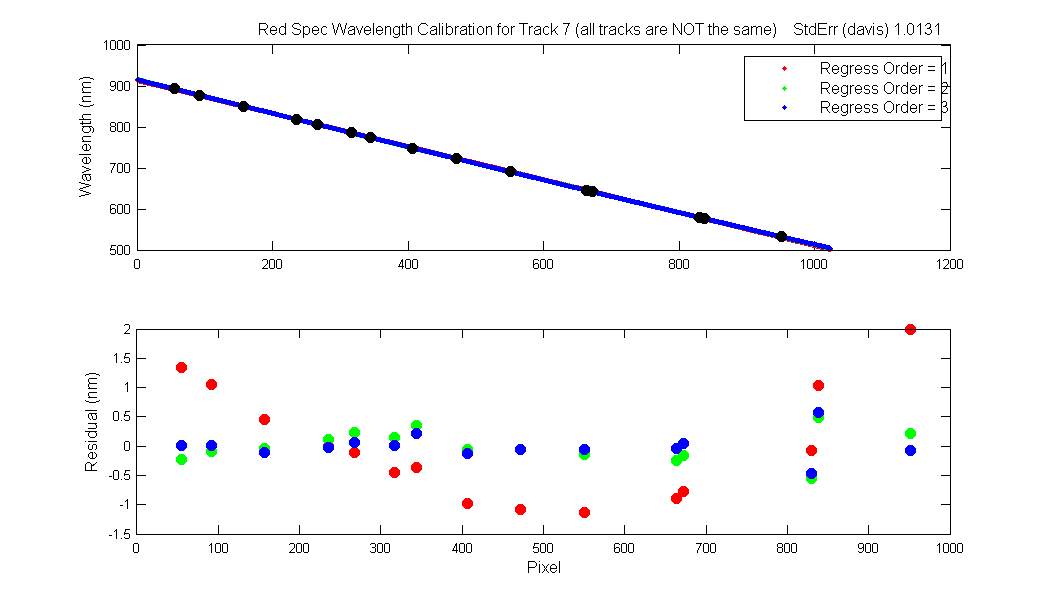
Wavelength regression
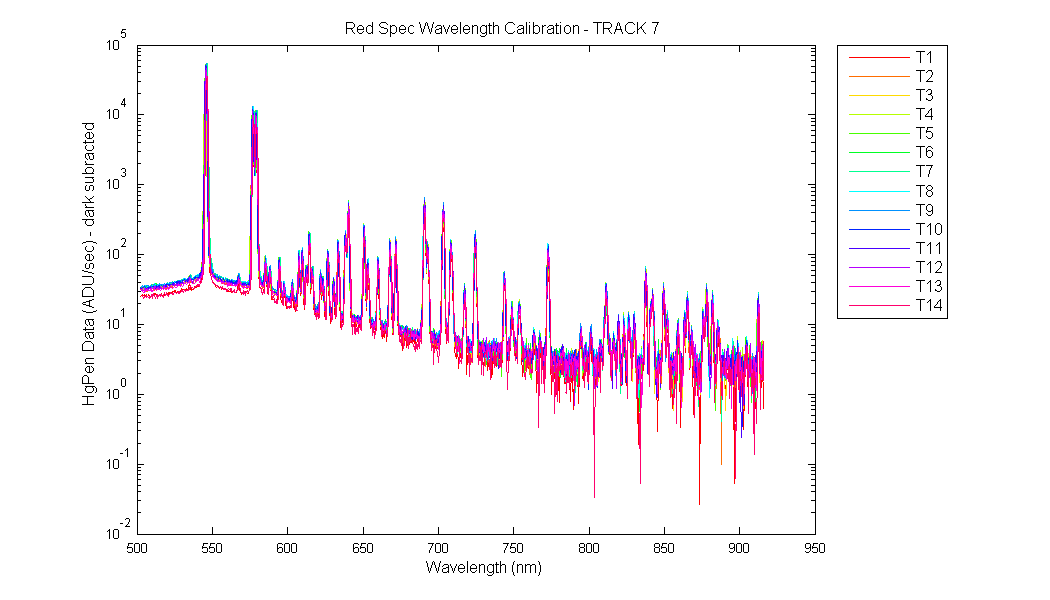
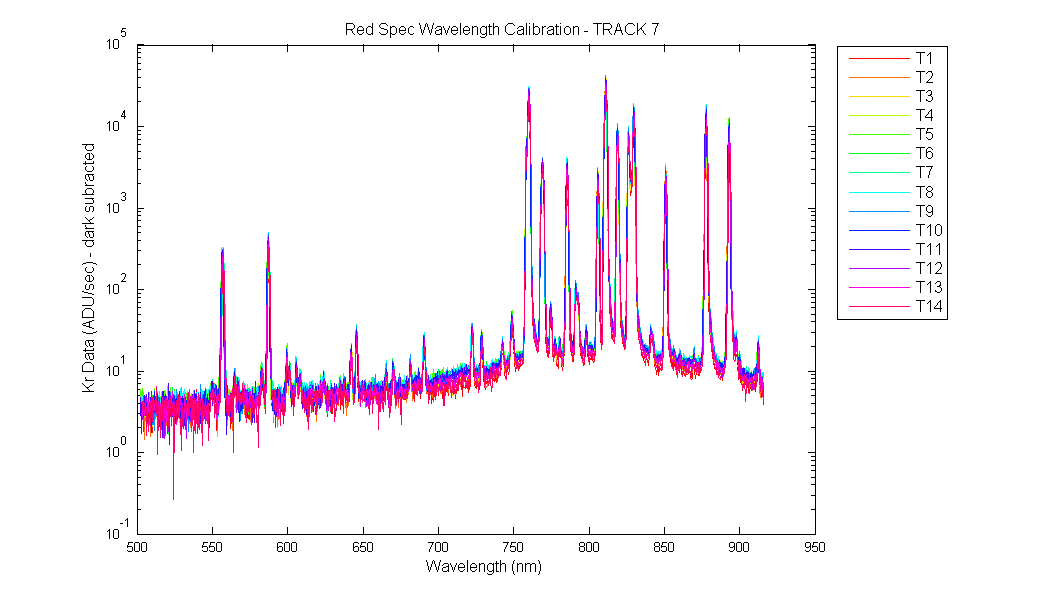
Kr and HgPen data verse Wavelength
Resolution Graph