Track 6 and 7 system response data
These graphs show system responses calculated using the OL420 and some filters.
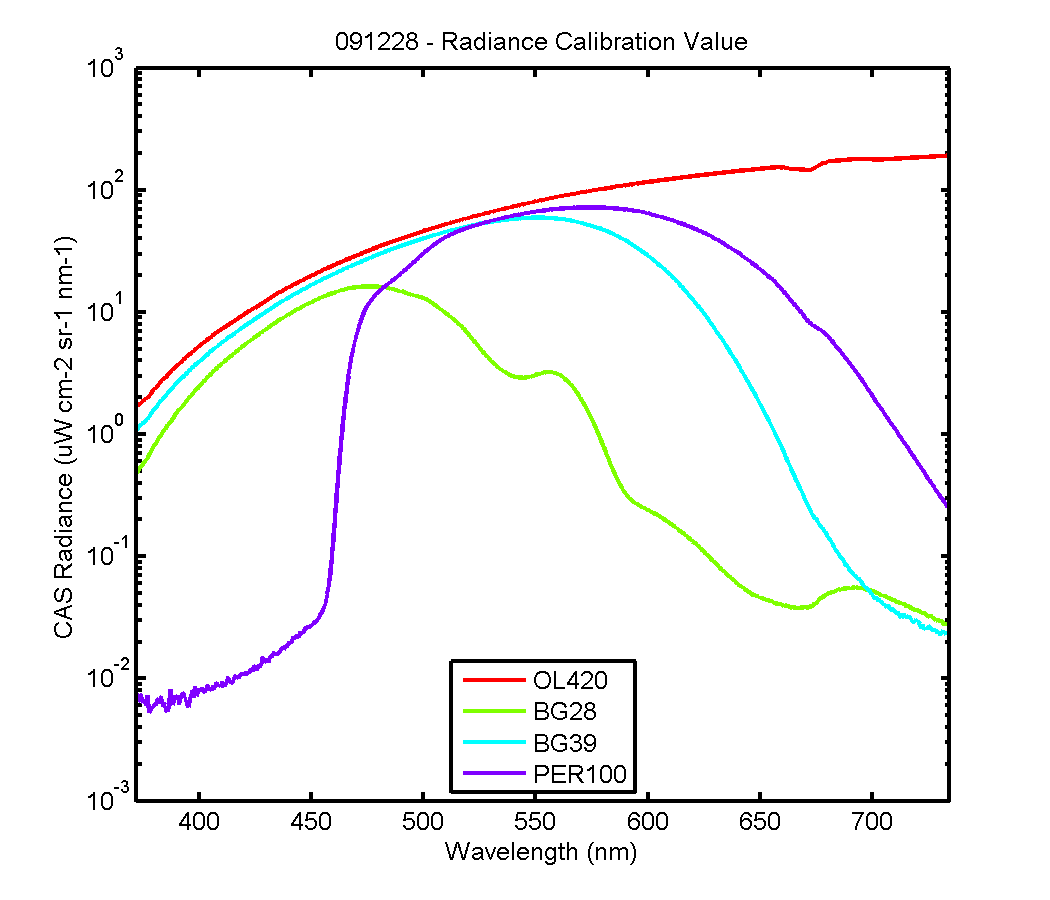
The first graph is the CAS radiances for each Source and filter (ie the lamp/source calibration).
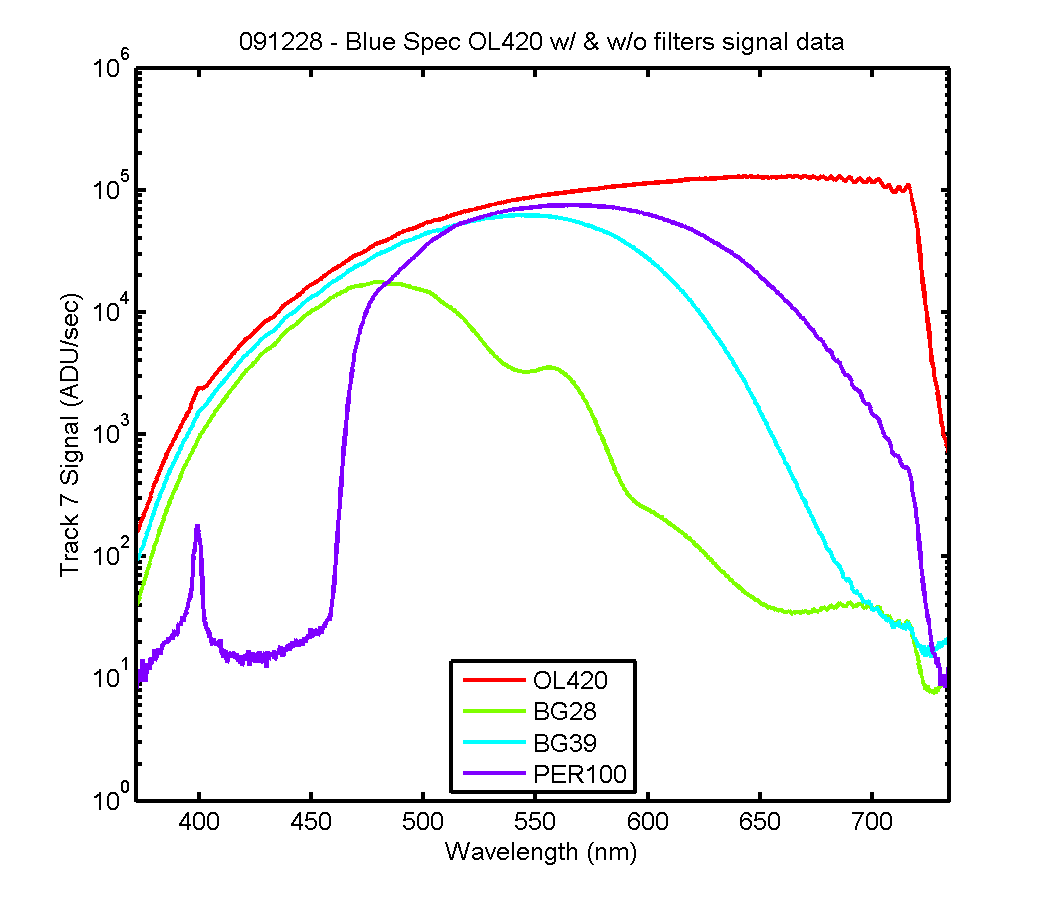
The second graph is the signal measured by the blue spec for that Source/filter.
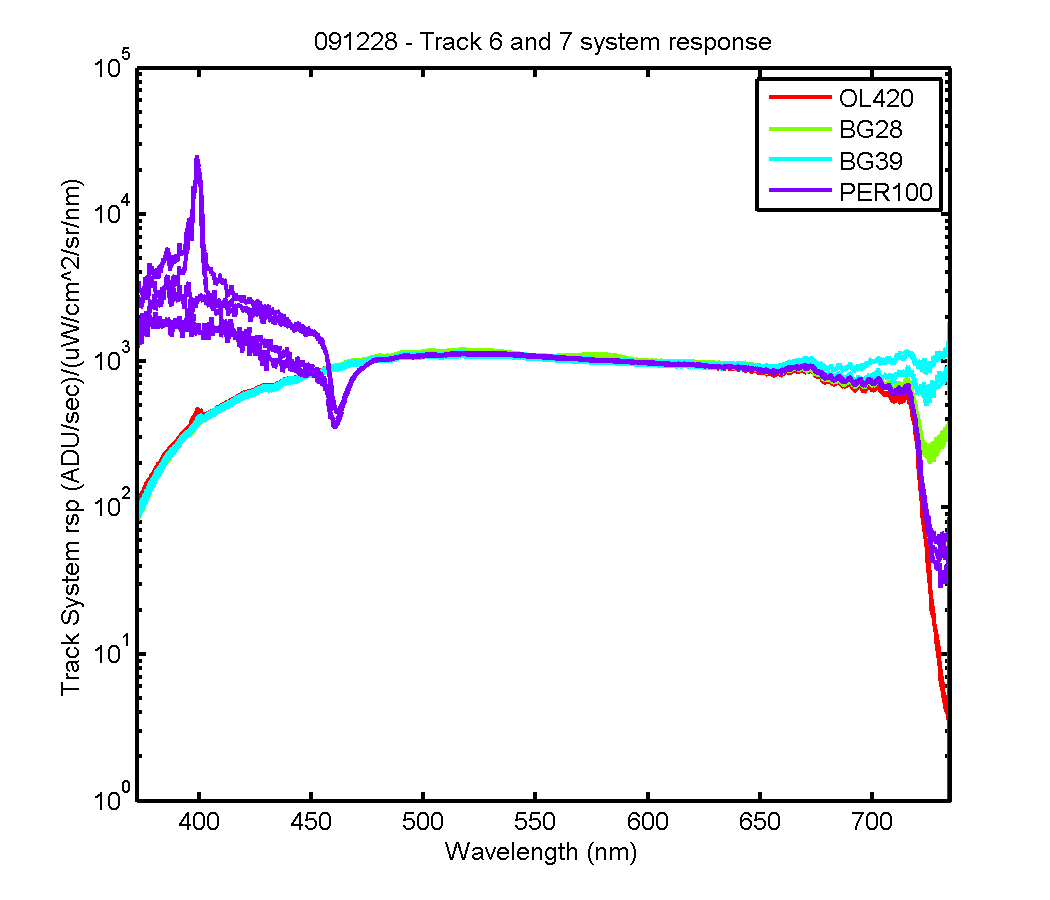
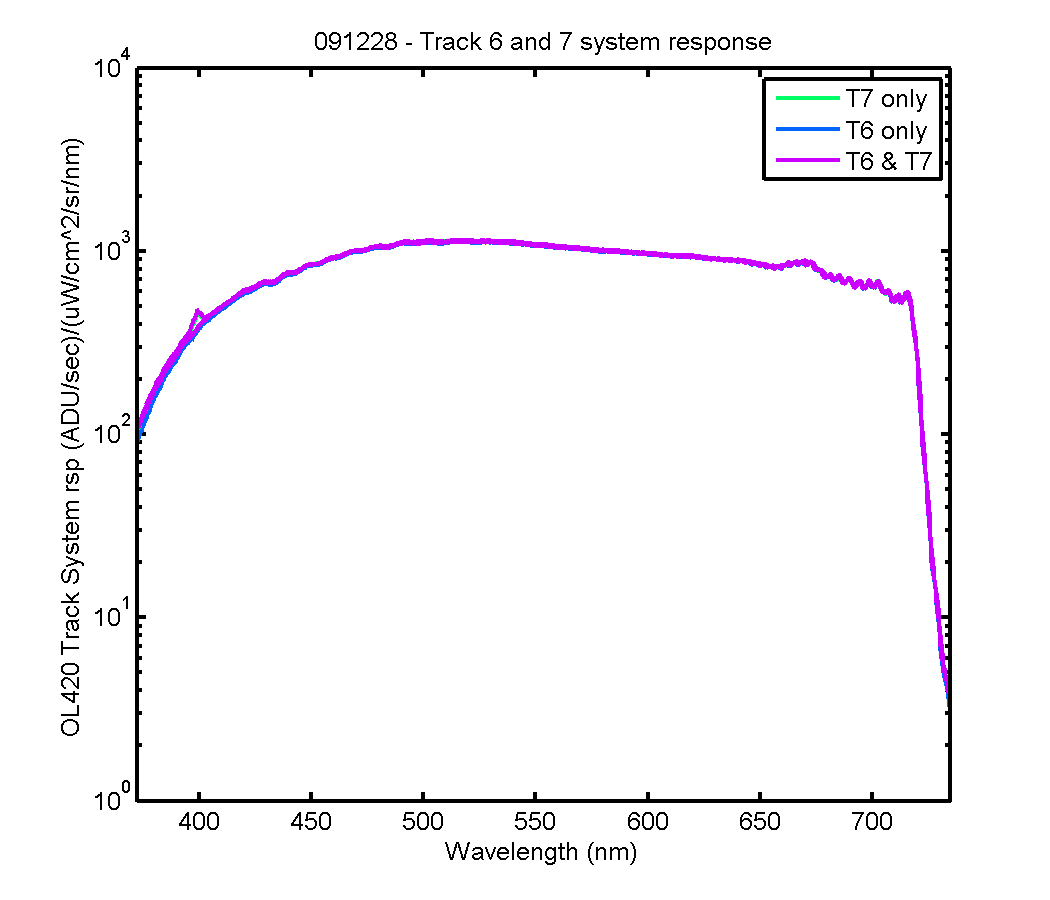
The third graph is the system response for each Source/filter. In theory they should be the
same for all source/filter were there is enough light. The only difference should be stray light (I think).
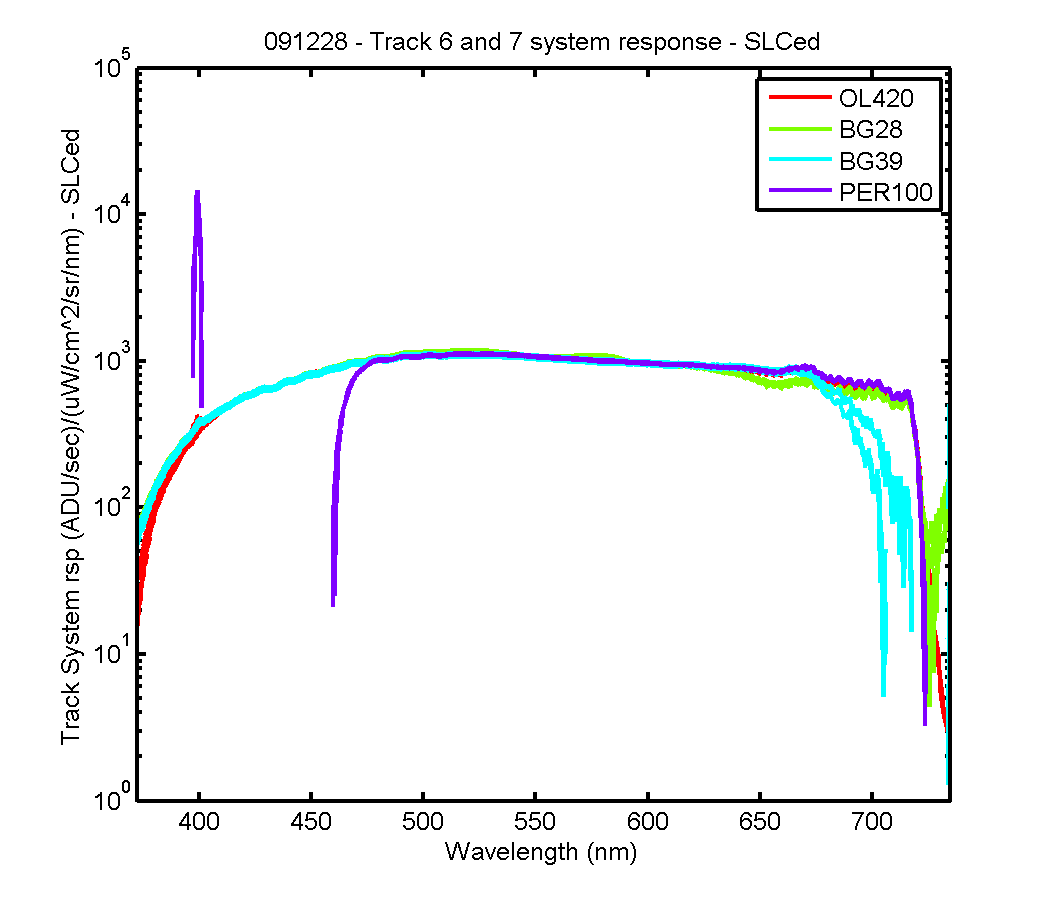
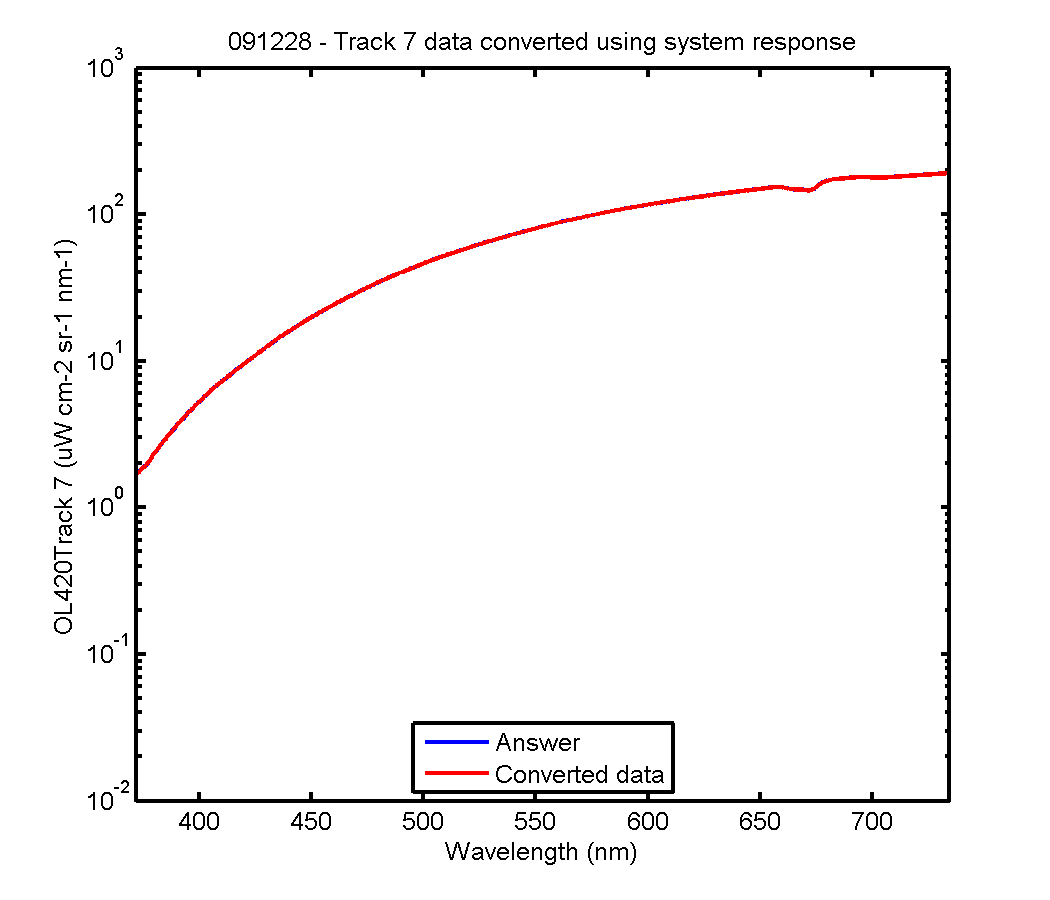
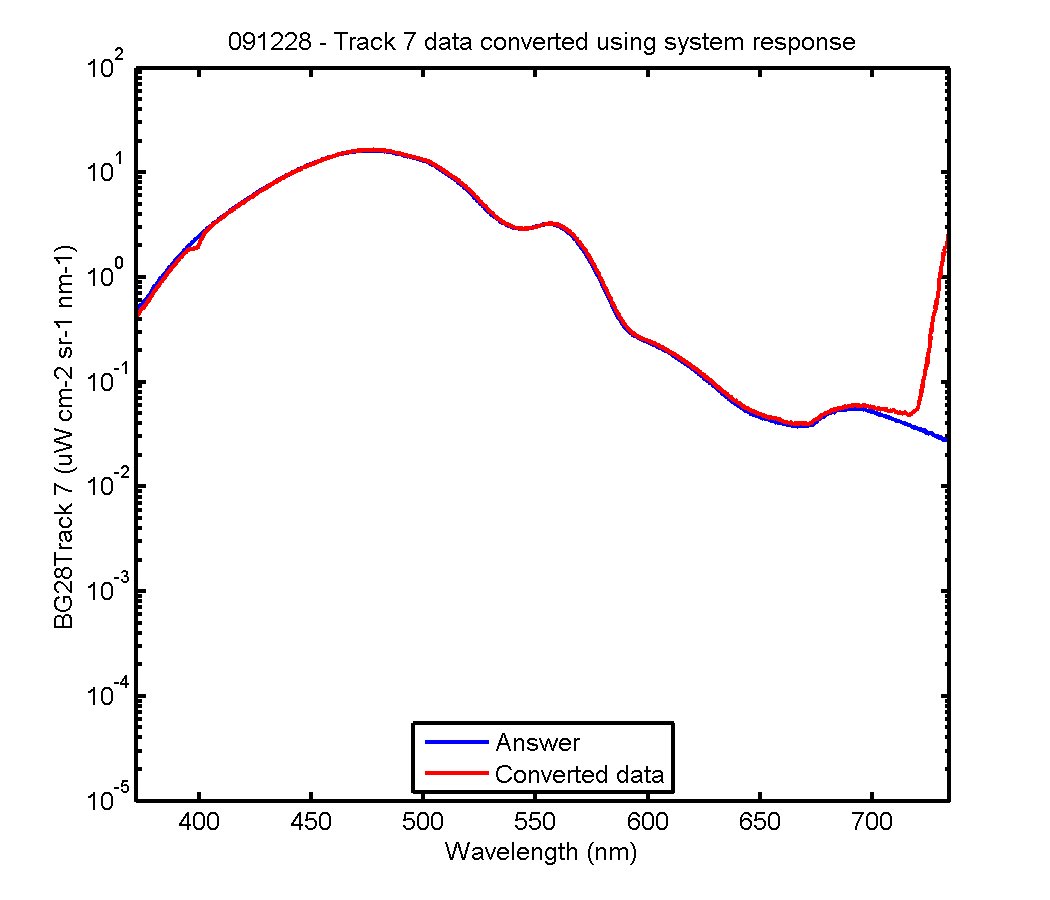
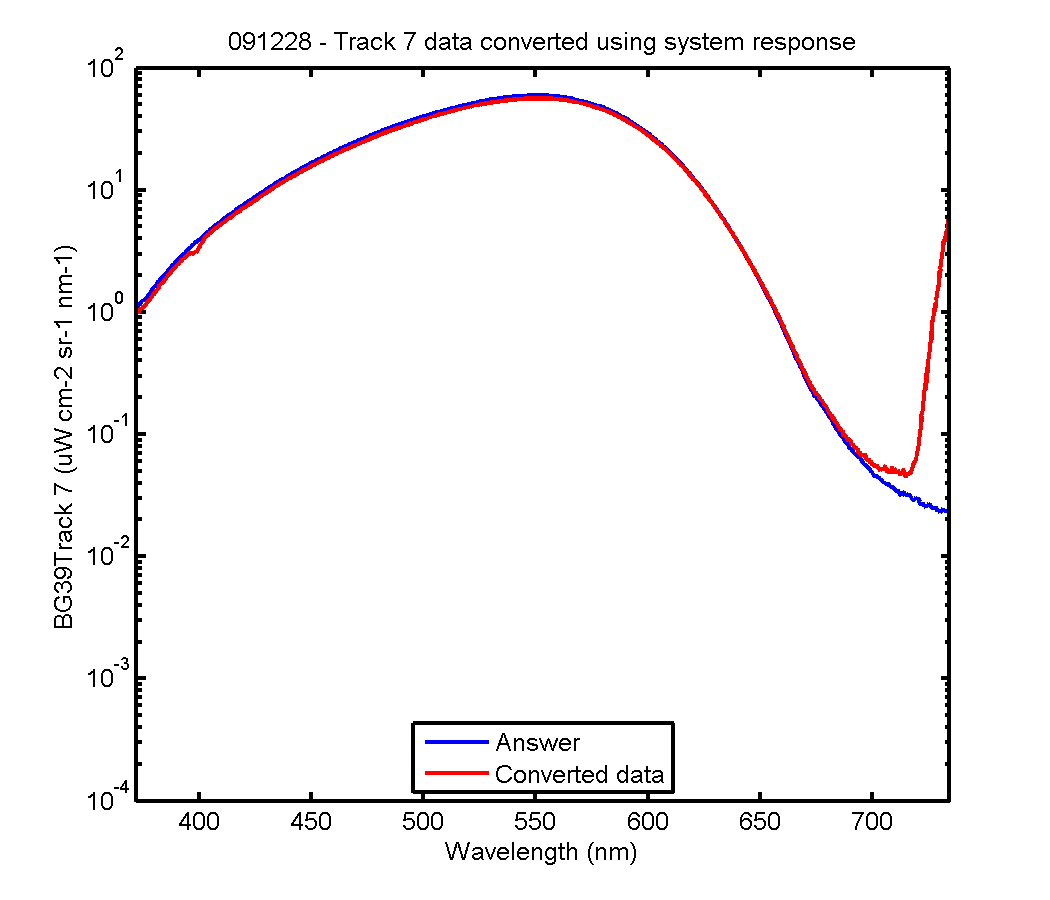
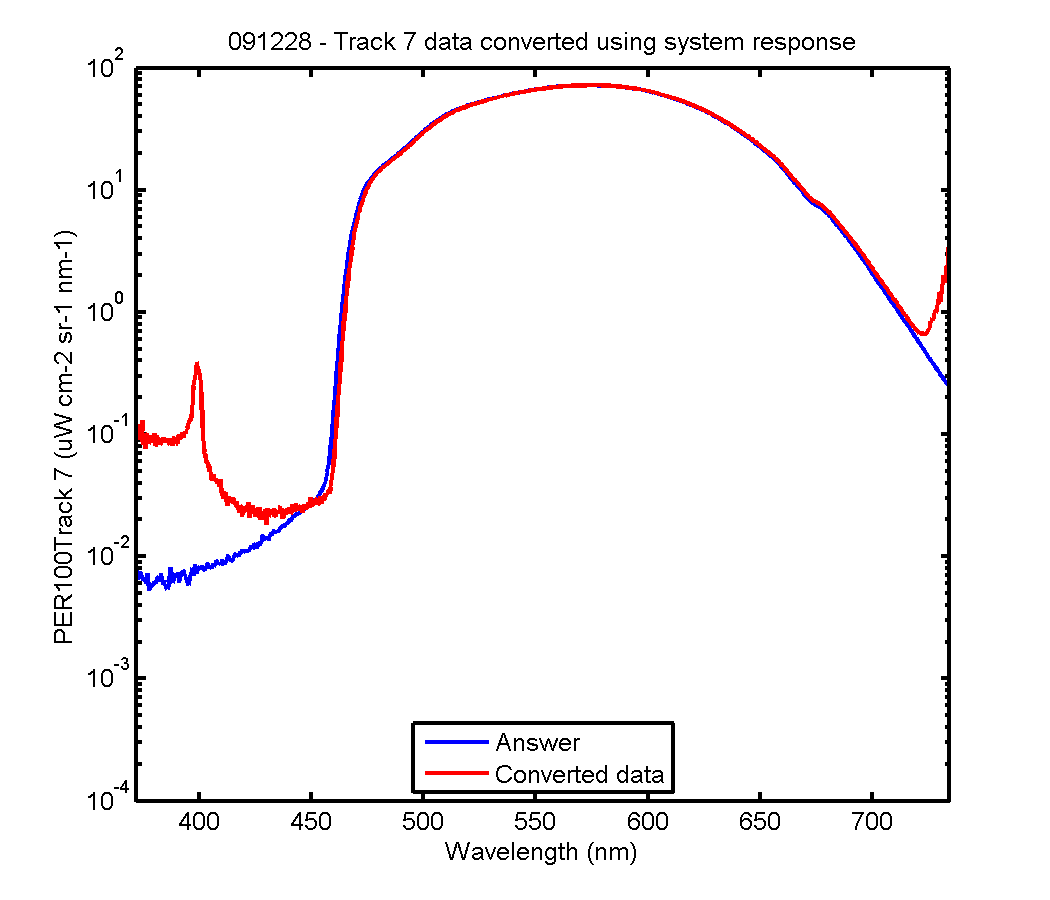
The graphs which follow (fourth - end) I took the system response from the OL420 (track 7) and applied
it to each of the track 7 source/filter signal data. In a perfect spectrograph world you should
get the calibrated radiance values back. Because of stray light this is not the case.
The difference between the answer and the converted data should be stray light (I think).
Notice the large differences between the answer and converted data for the three filters past 700 nm.
CAS Source Radiance File
System response data
pwd: C:\zflora\mldata\MOBY2\Intital_testing\091228
Date: 27-Jan-2010 07:30:21
Created from pltmkrsp_(1)