Track 6 and 7 system response data - CAS data shifted
In some discusions with Carol is looked like the CAS data was offset by about 1.5 nm, too
see if this affected the system responses I redid the data from Exp 18.2 but added 1.5 nm the CAS wavelengths.
In the grtaphs below shofted denotes the system response used had the CAS wavelength shifted by 1.5 nm before the
system response was calculated. The Resonon wavelengths were not shofted.
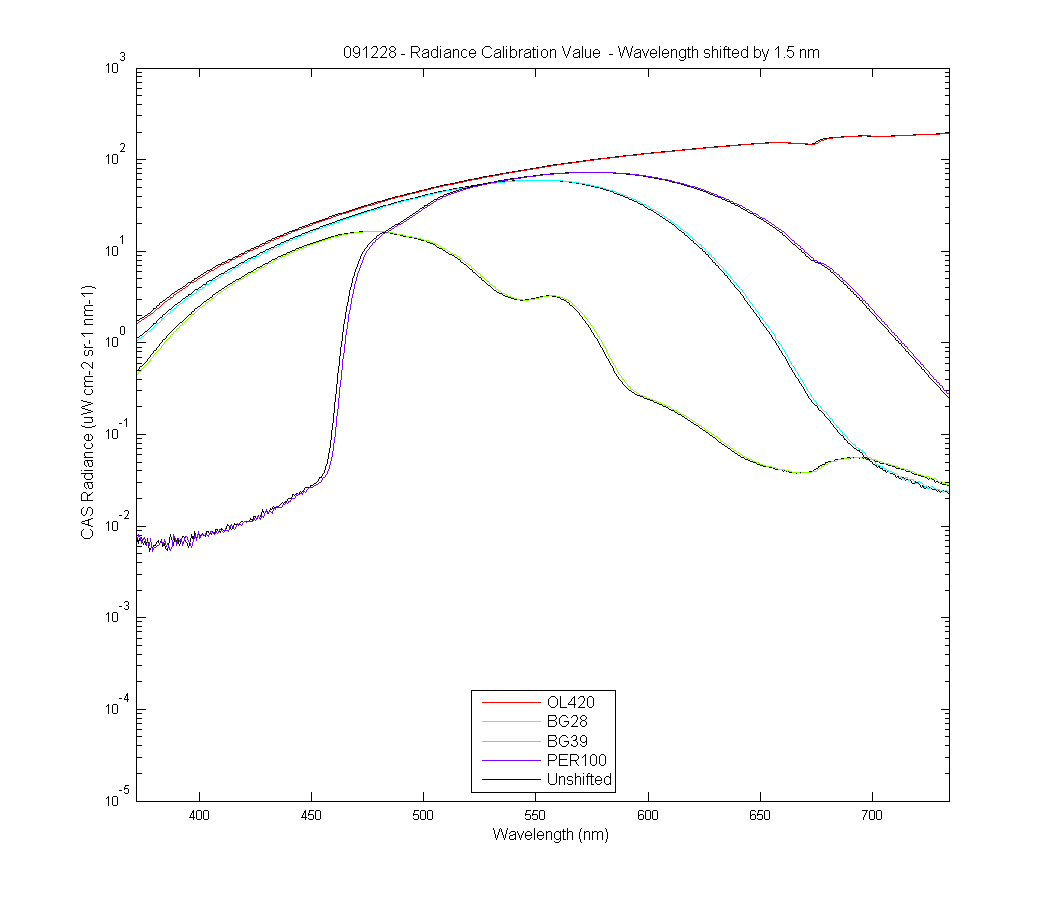
The first graph is the CAS radiances for each Source and filter (ie the lamp/source calibration).
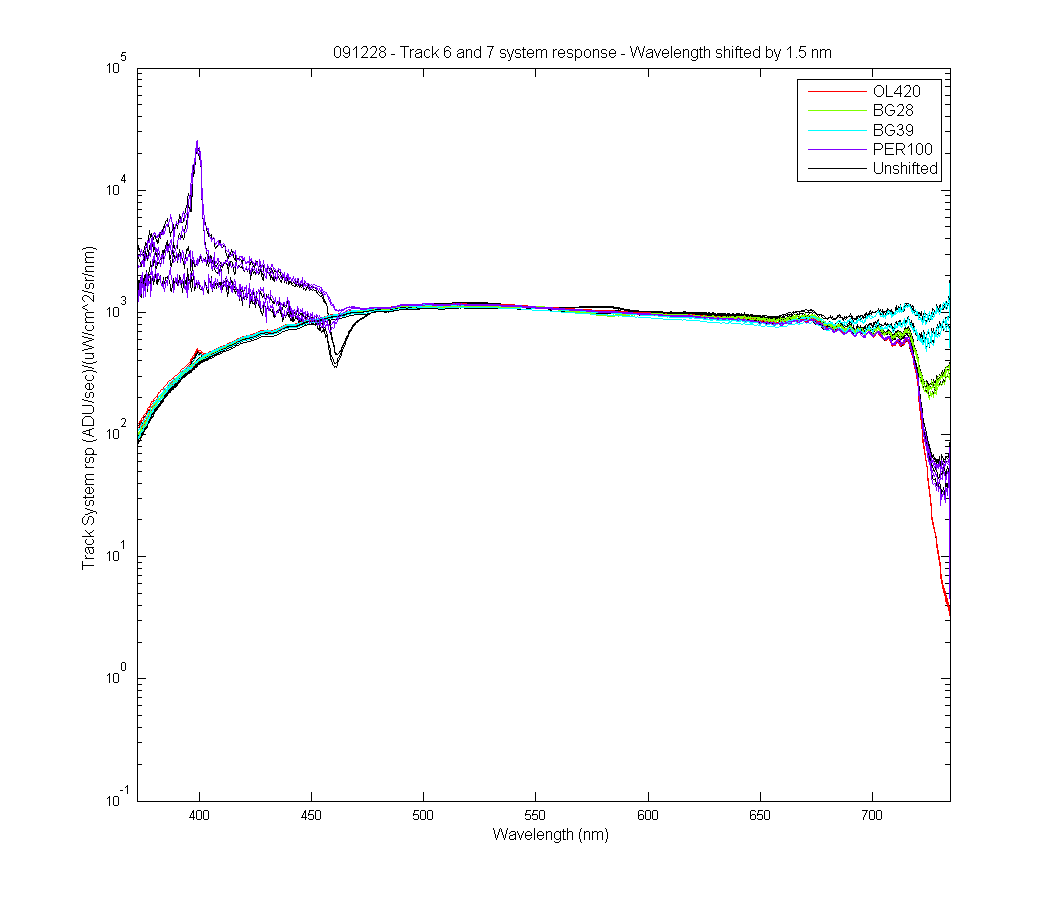
The second graph is the signal measured by the blue spec for that Source/filter.
The third graph is the system response for each Source/filter. In theory they should be the
same for all source/filter were there is enough light. The only difference should be stray light (I think).
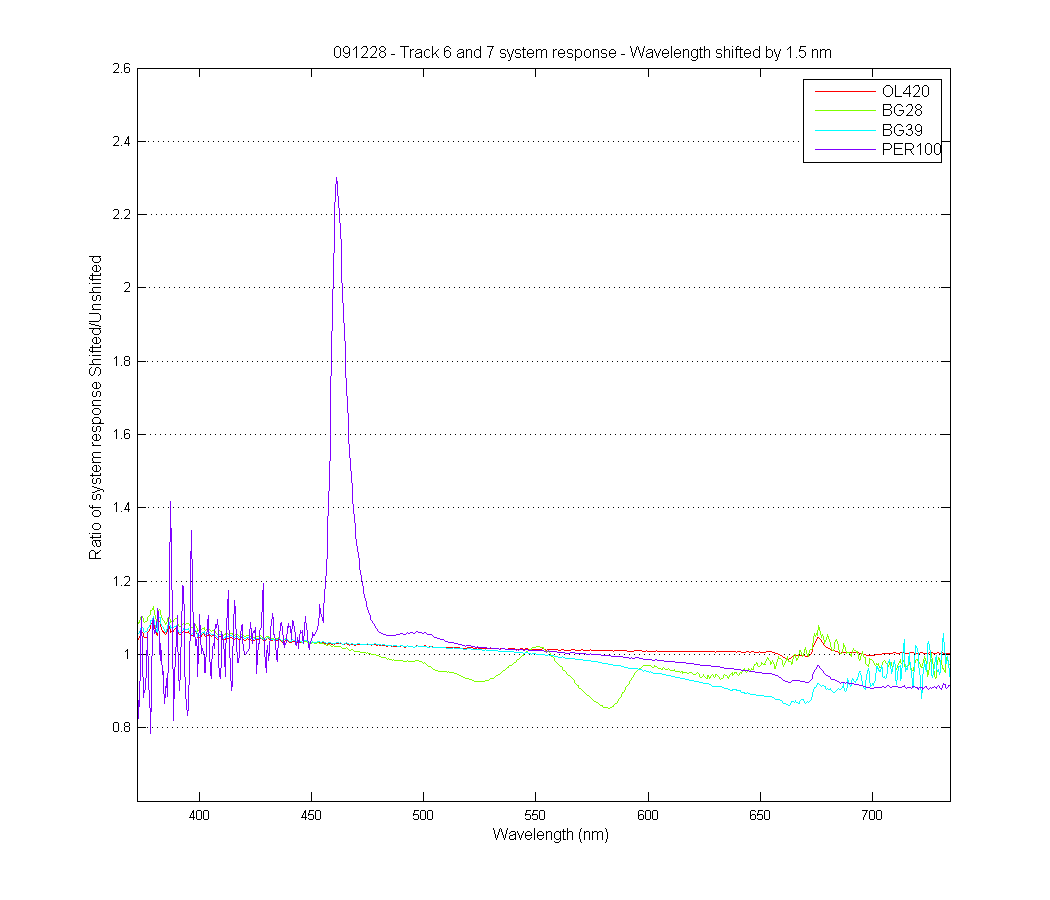
The forth graph is the ratio of the shifted and unshifted system response for each Source/filter. I
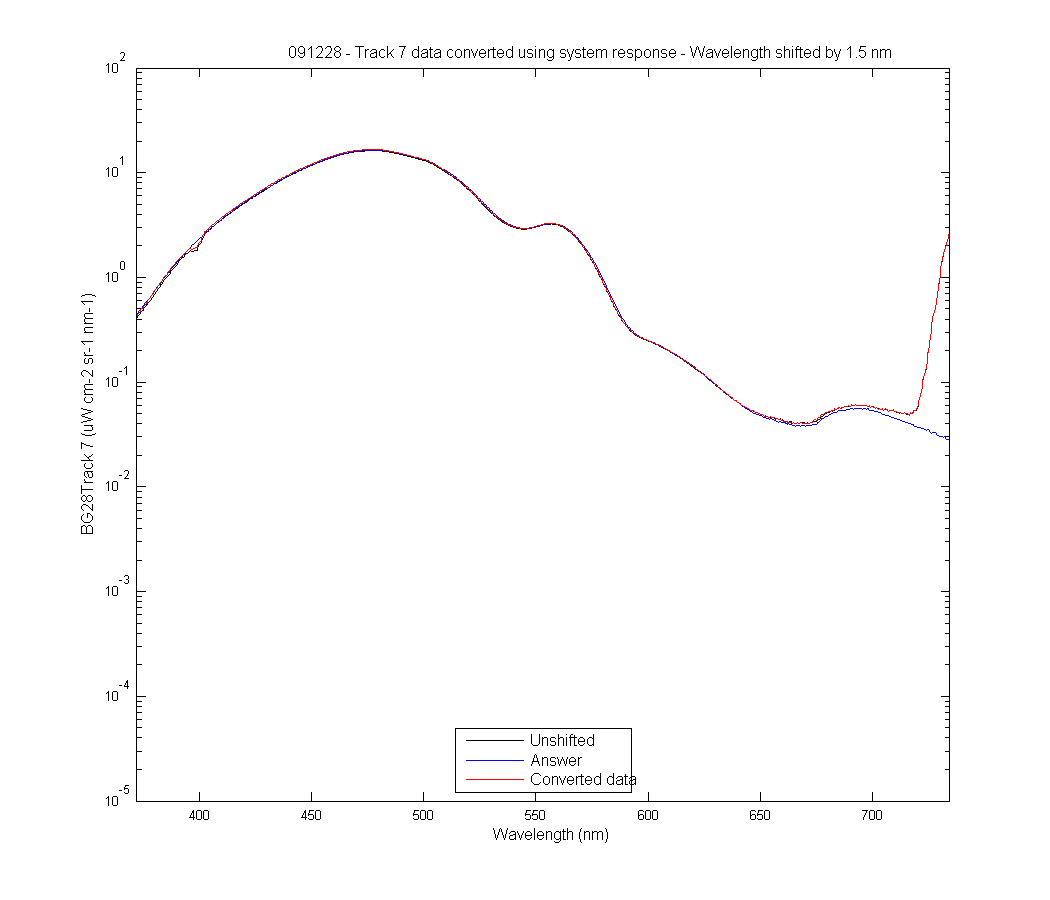
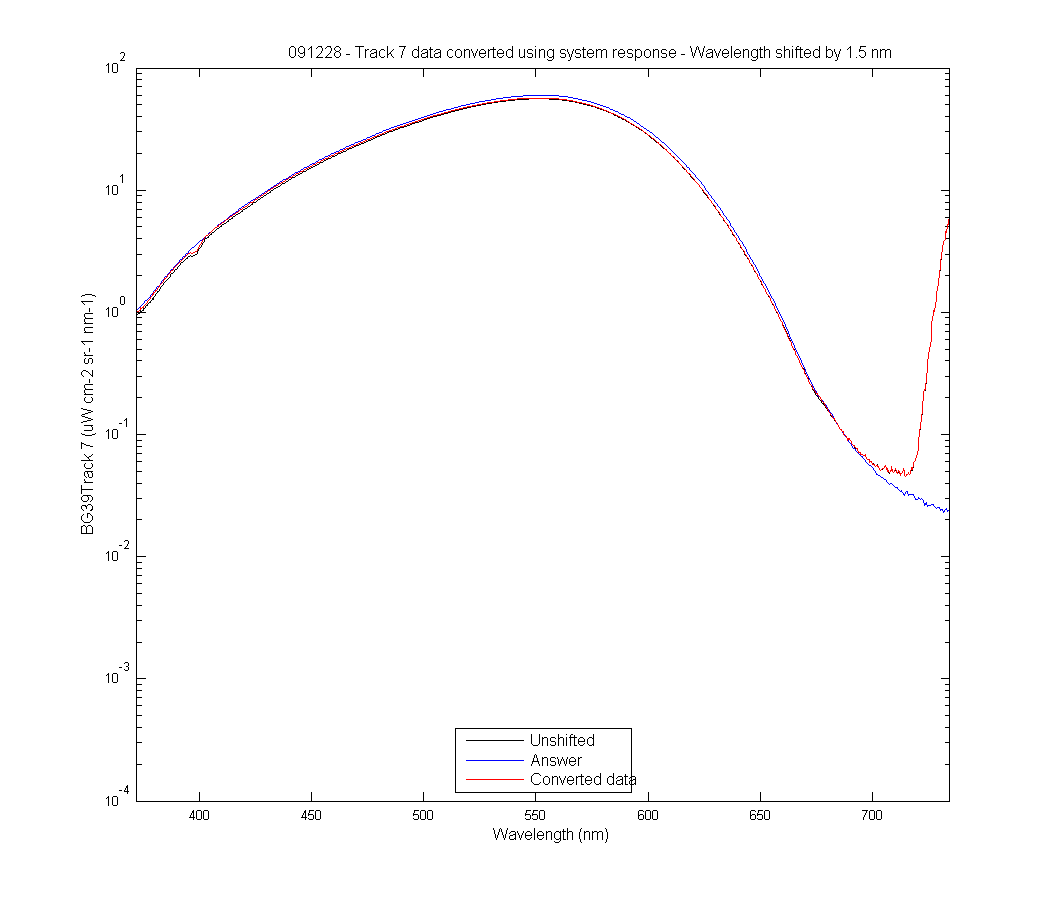
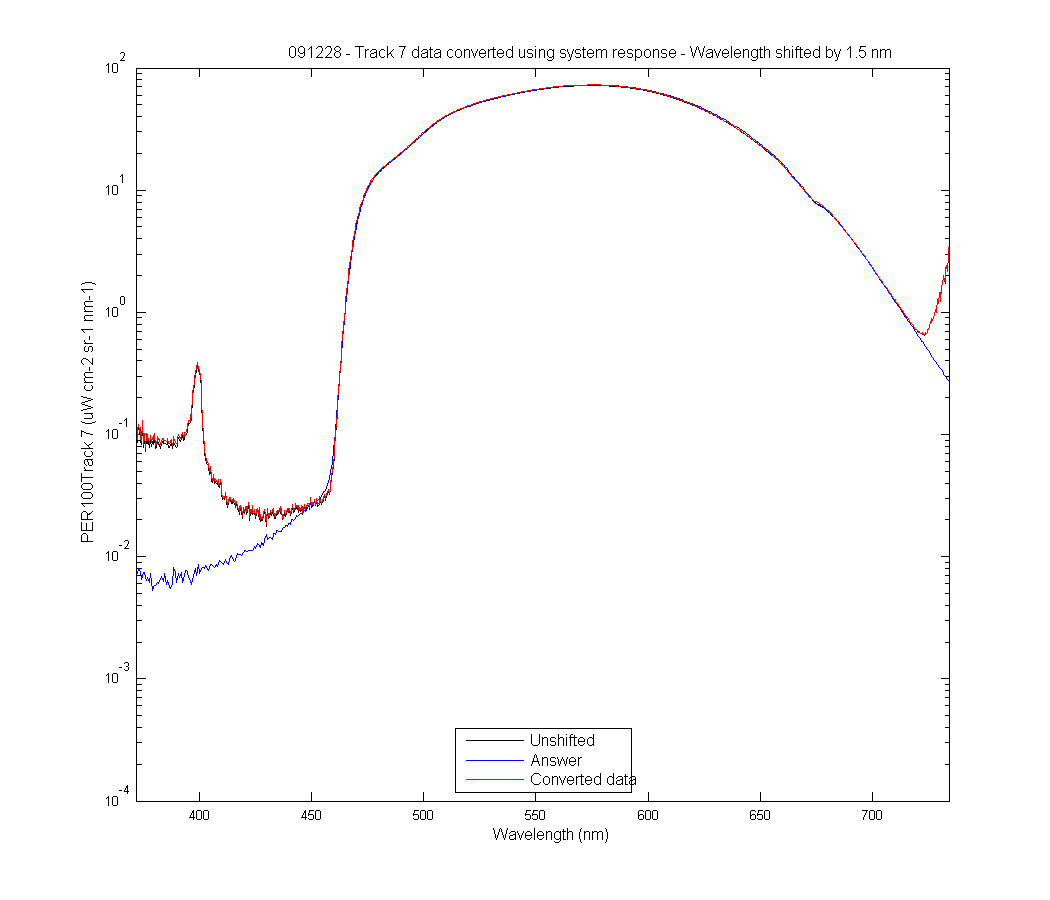
The graphs which follow (fifth - end) I took the system response from the OL420 (track 7) and applied
it to each of the track 7 source/filter signal data. In a perfect spectrograph world you should
get the calibrated radiance values back. Because of stray light this is not the case.
The difference between the answer and the converted data should be stray light (I think).
Notice the large differences between the answer and converted data for the three filters past 700 nm.
CAS Source Radiance File
System response data
pwd: C:\zflora\mldata\MOBY2\Intital_testing\091228
Date: 25-Jan-2010 15:13:40
Created from pltmkrsp_adjcas_(1)