SLCed validation data
pwd: C:\zflora\mldata\MOBY2\Intital_testing\091228
Date: 21-Feb-2010 17:21:23
Created from pltmkslcrsp_(1)
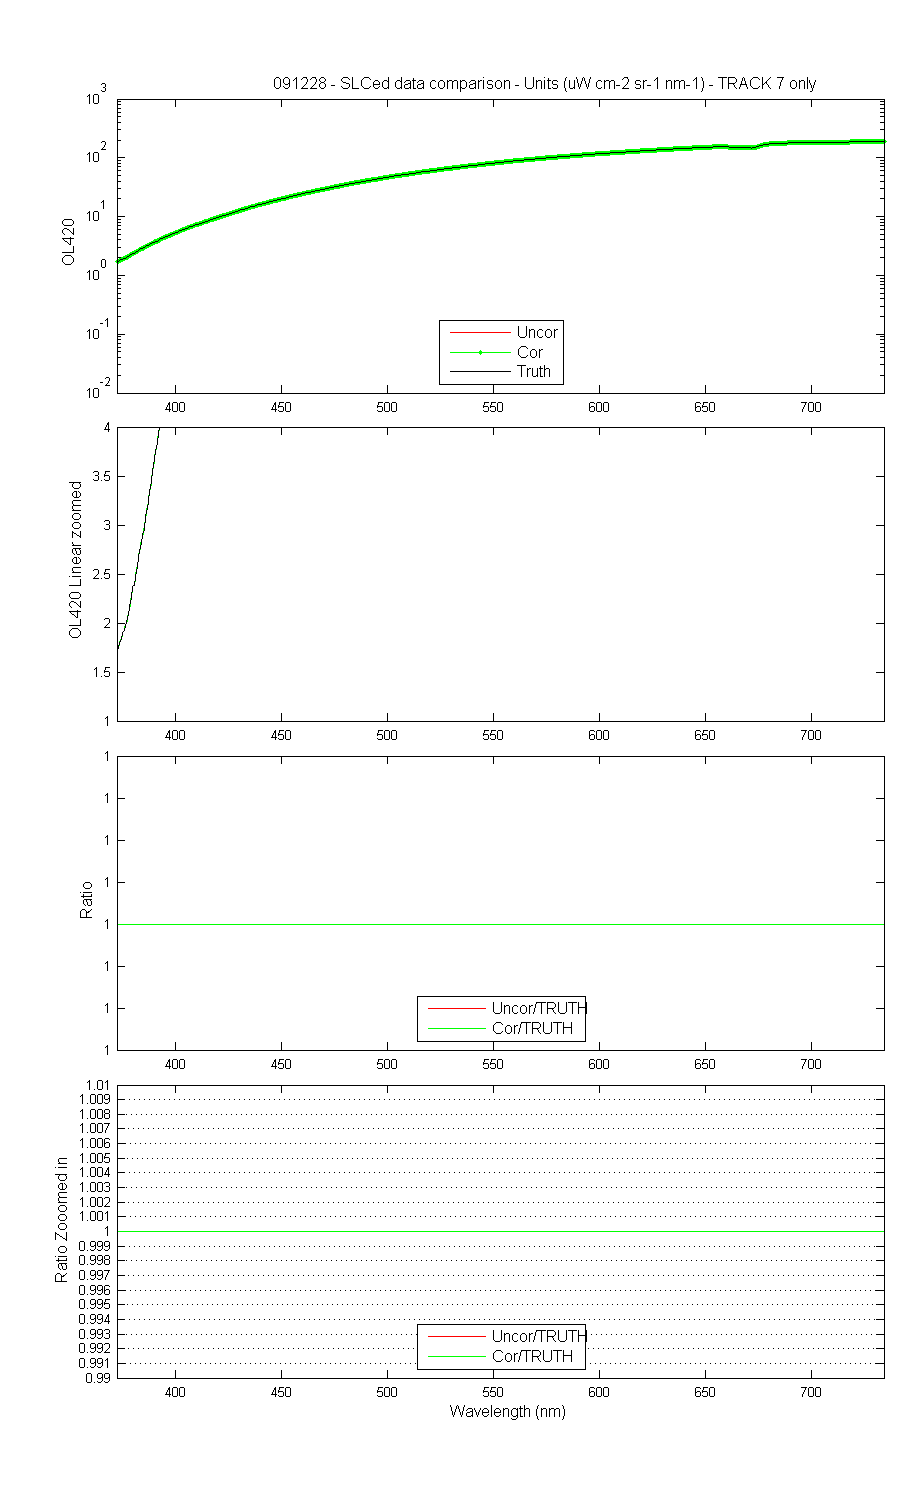
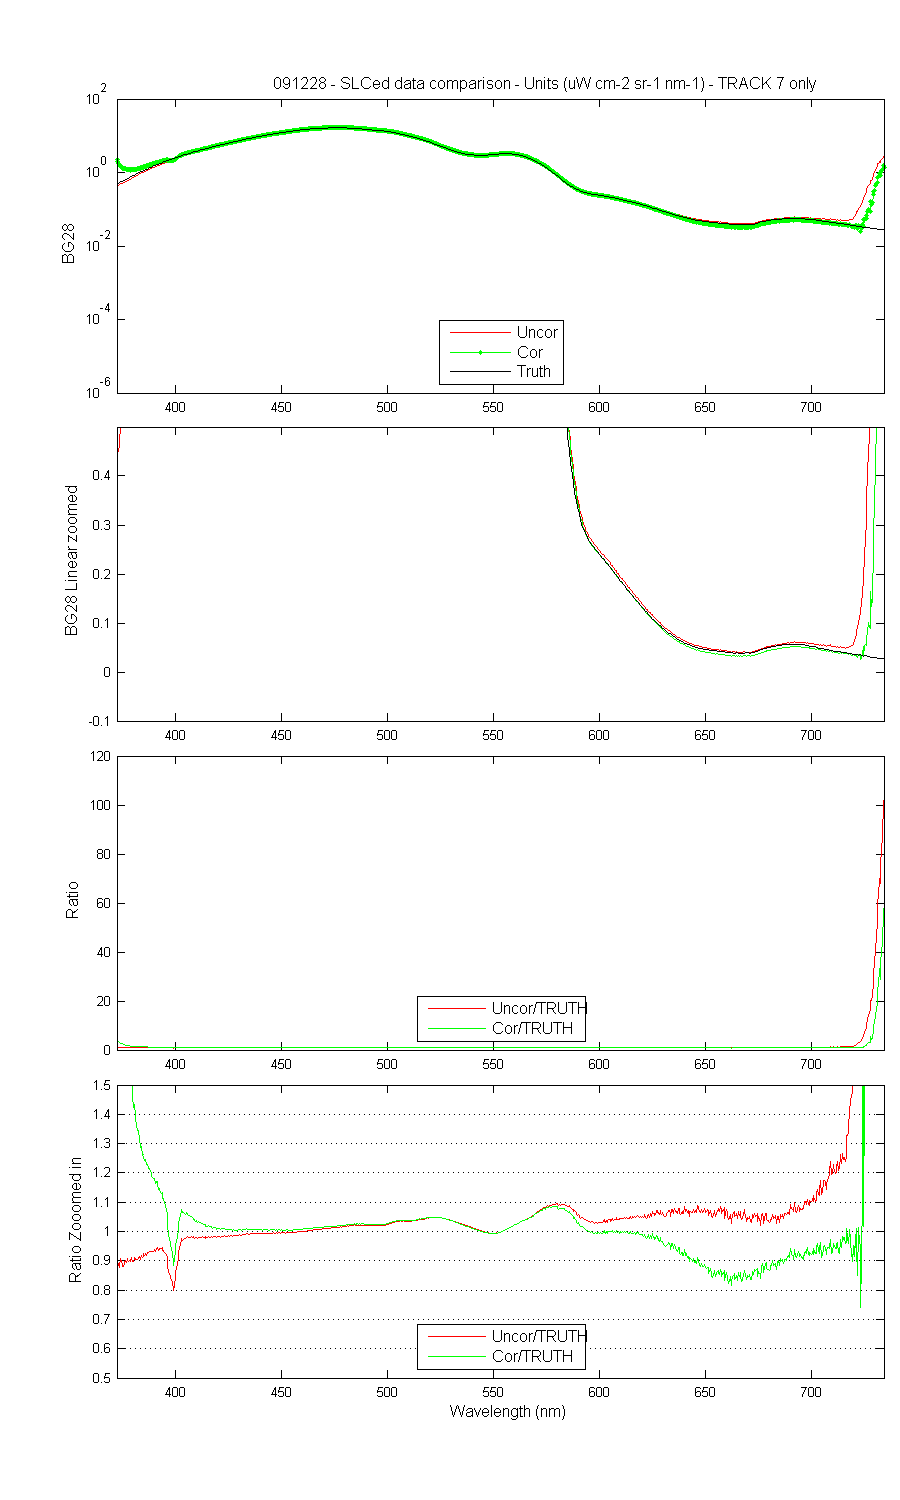
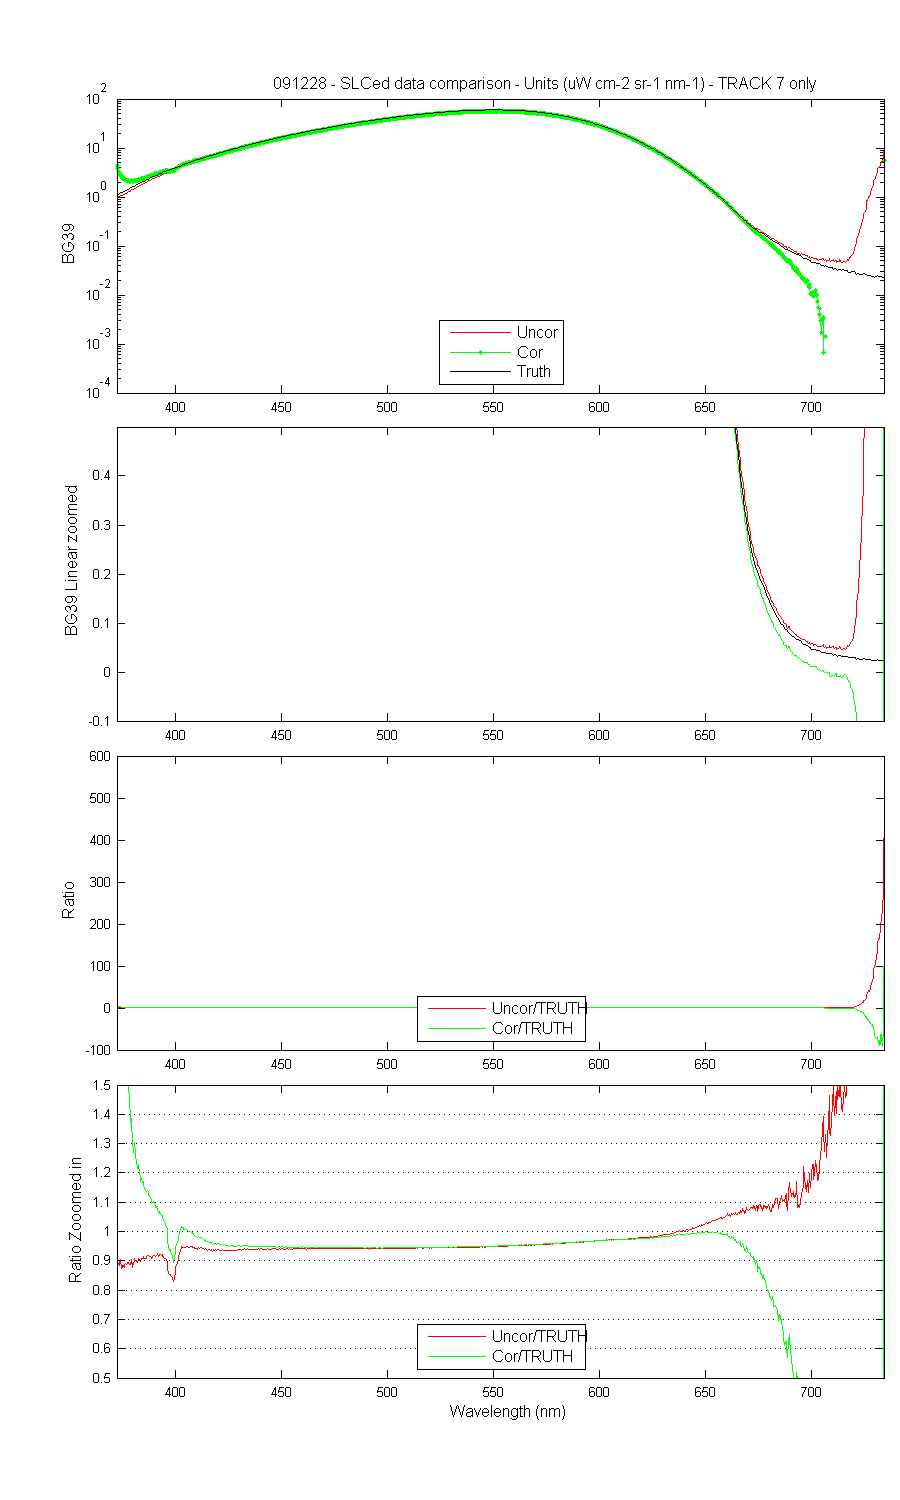
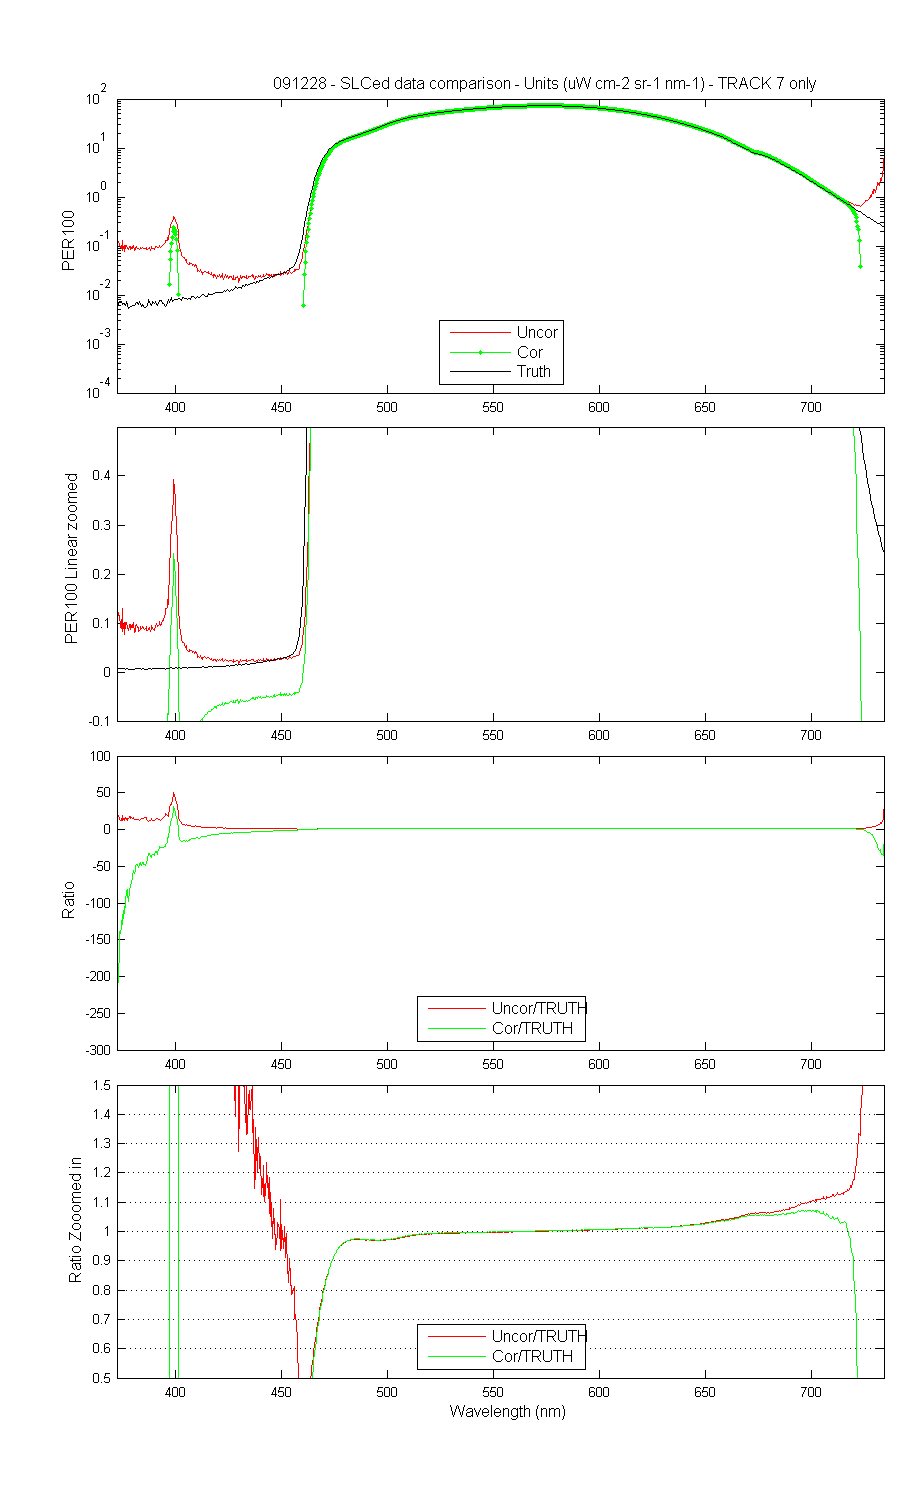
These graphs compare the SLCed OL420 and filter data with the uncorrected and NIST radiance cal data (Truth). All the data was in ADU/sec and the first frame was removed. Only track 7 data was used.
See Experitment 7.2 and notes on 21 Feb for changes to the matrix.
Each graph contains 4 subplots for each source/filter.
SLCed validation data