Track 6 and 7 validataion data
These graphs are the validations sourse for the system response data collected on Dec 28.
The SPR created for Track7 will be used to SLC this data.
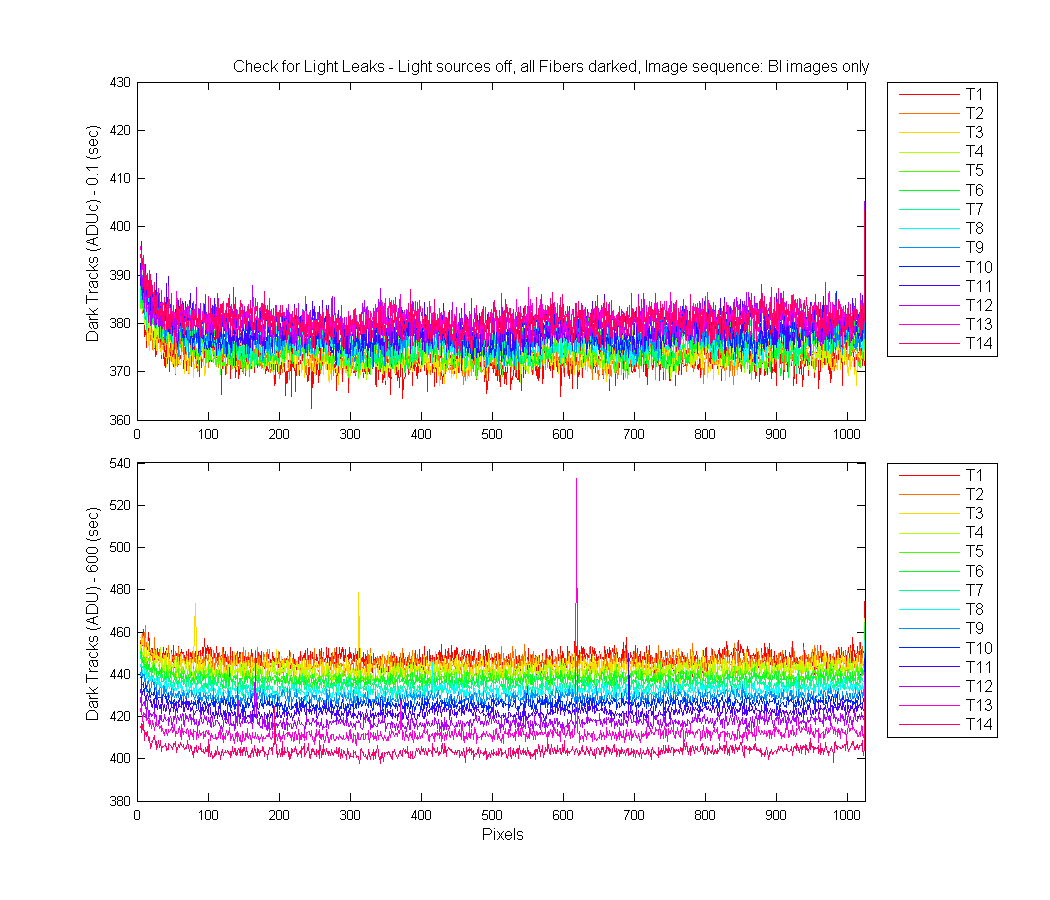
The first data set is just to confirm not light leaks, Note the speed is now the faster 2M (Hz) so we see
sin waves in the dark scans. Interesting.
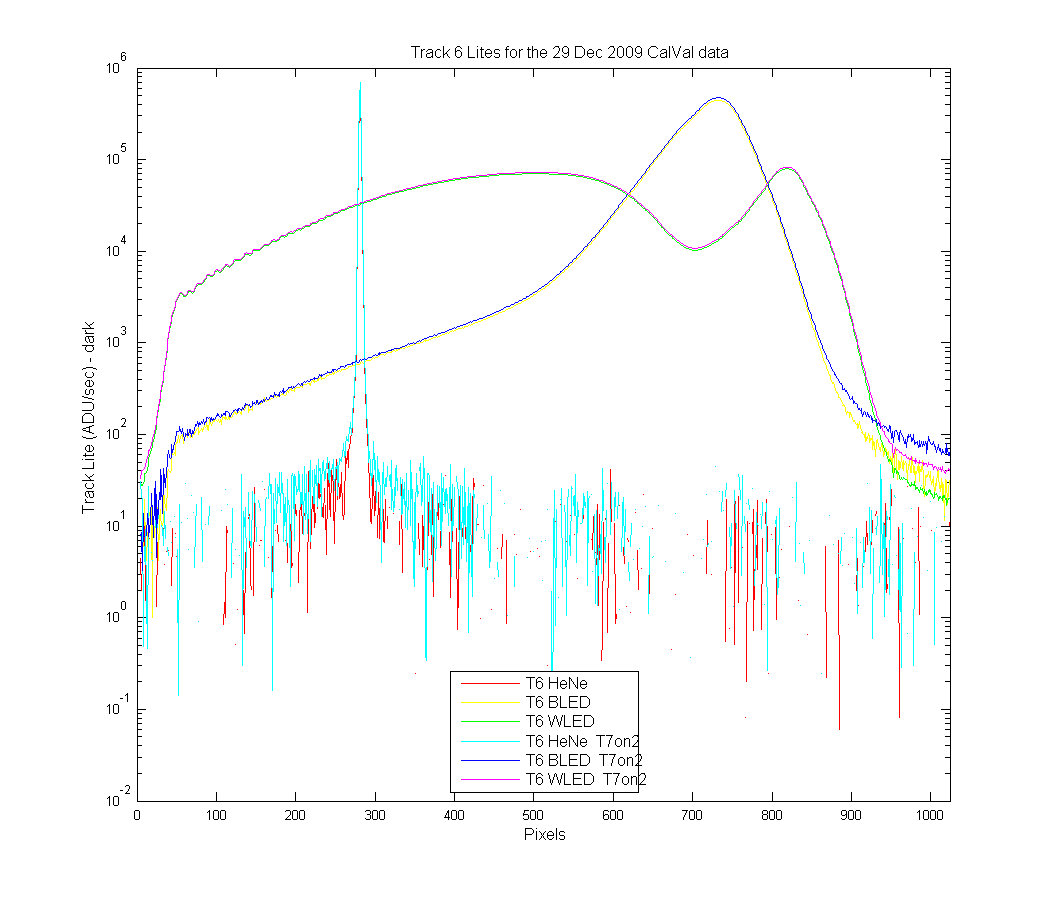
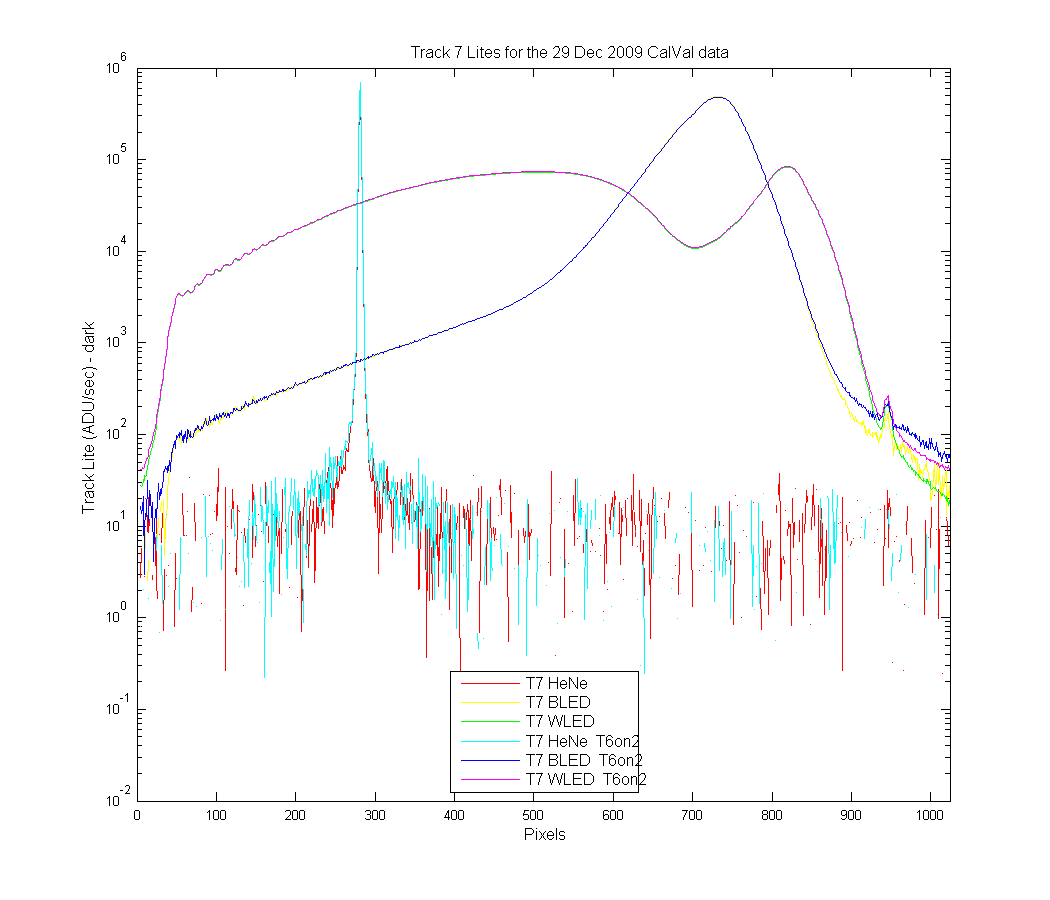
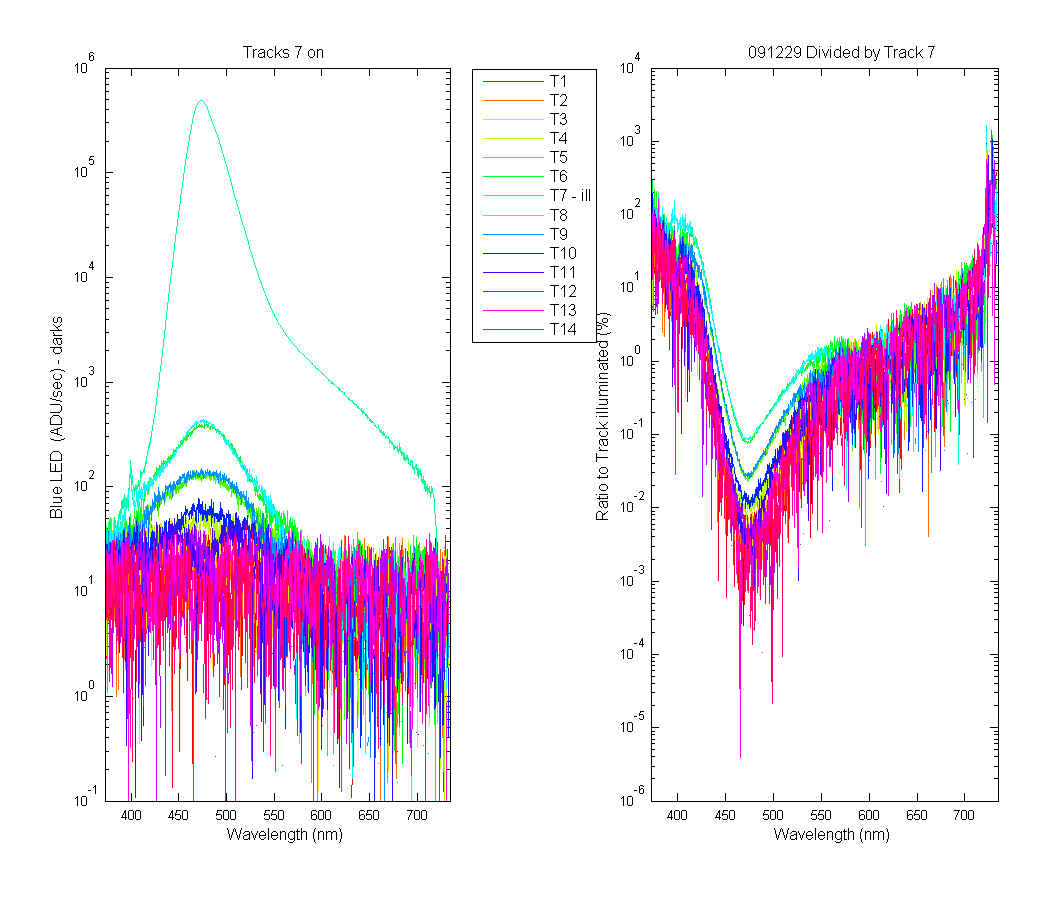
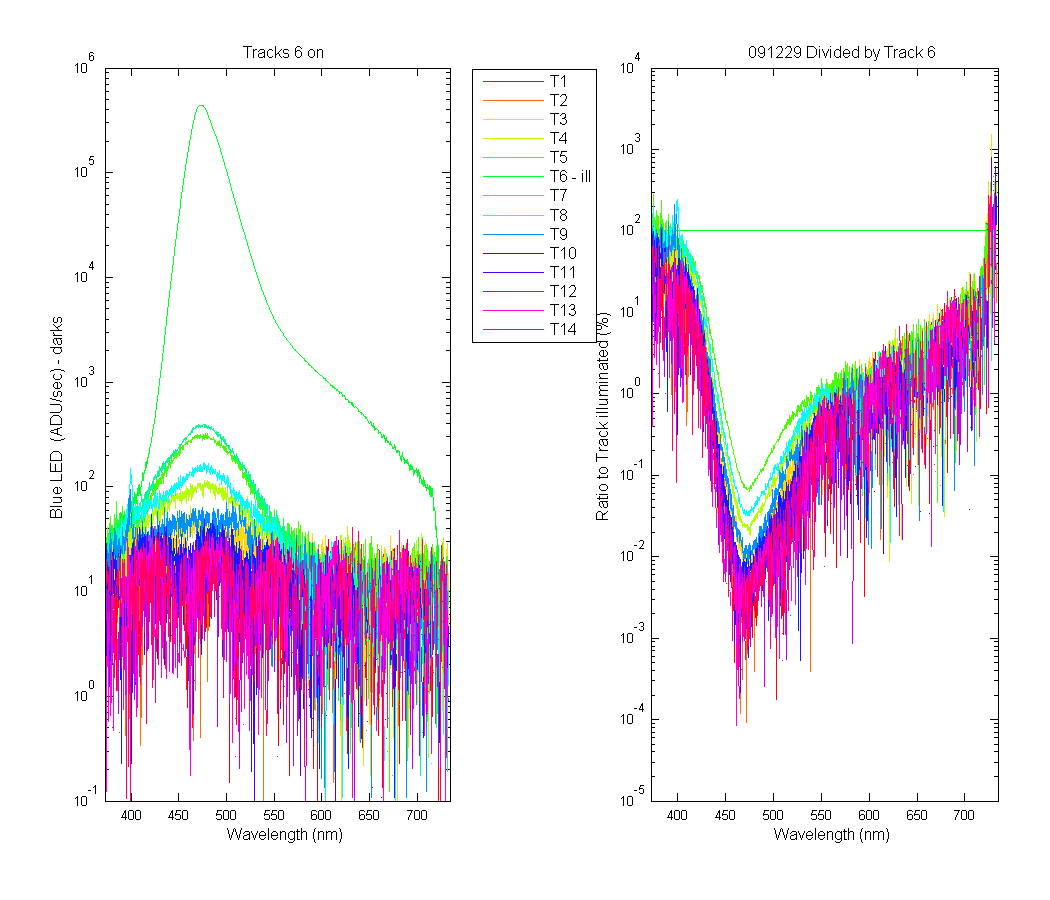
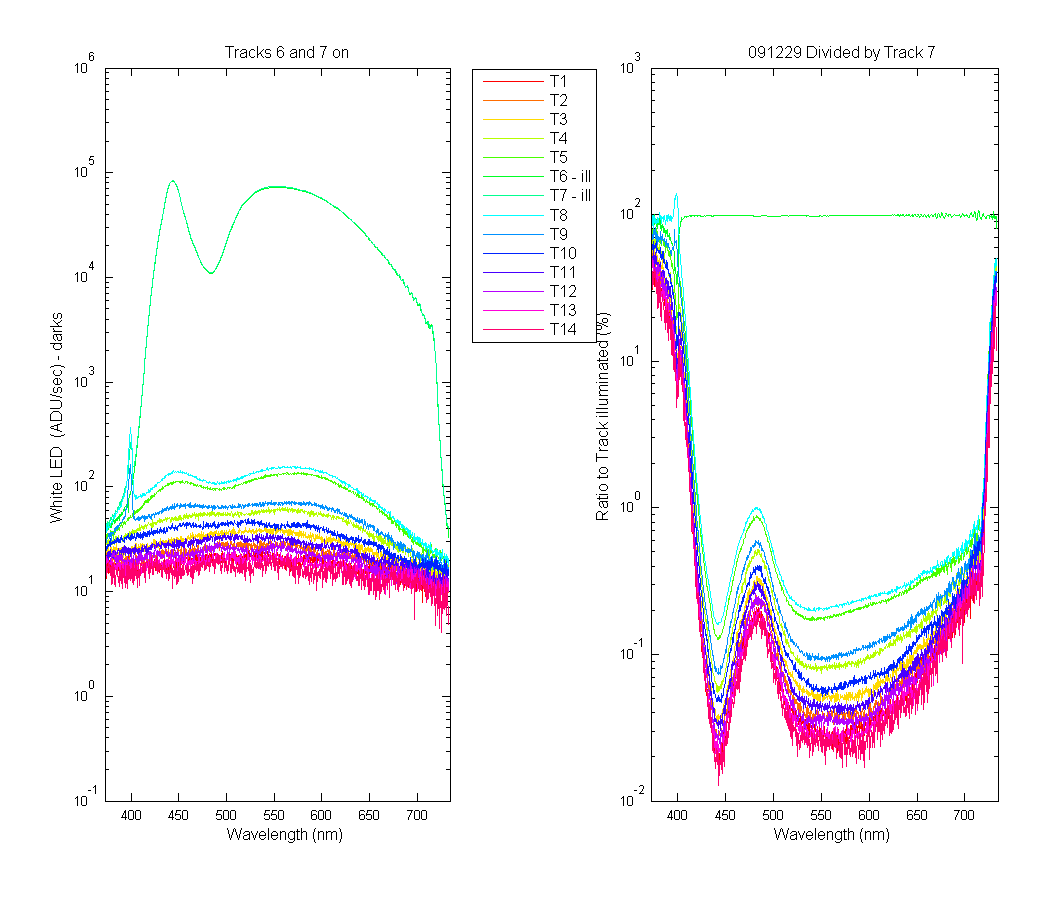
The second set of graphs show the Track 6 and 7 data (first frame deleted, dark subtracted and divided by integration time)
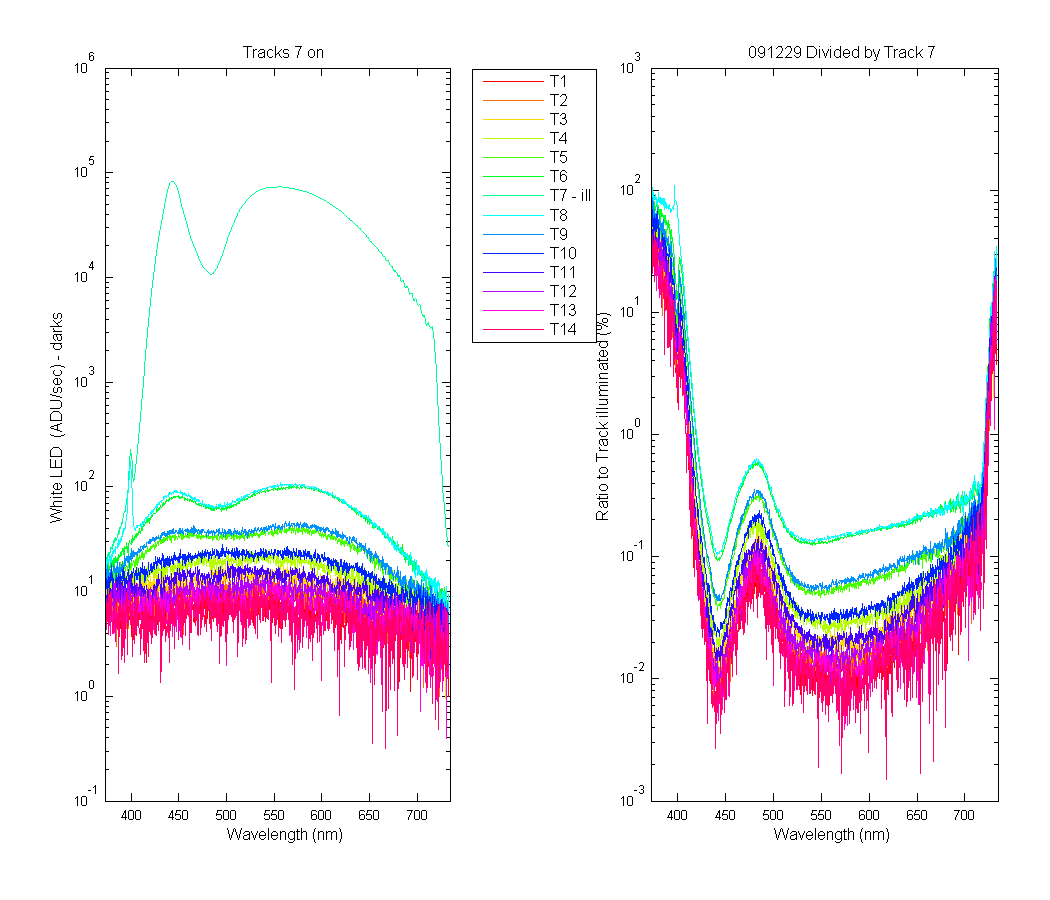
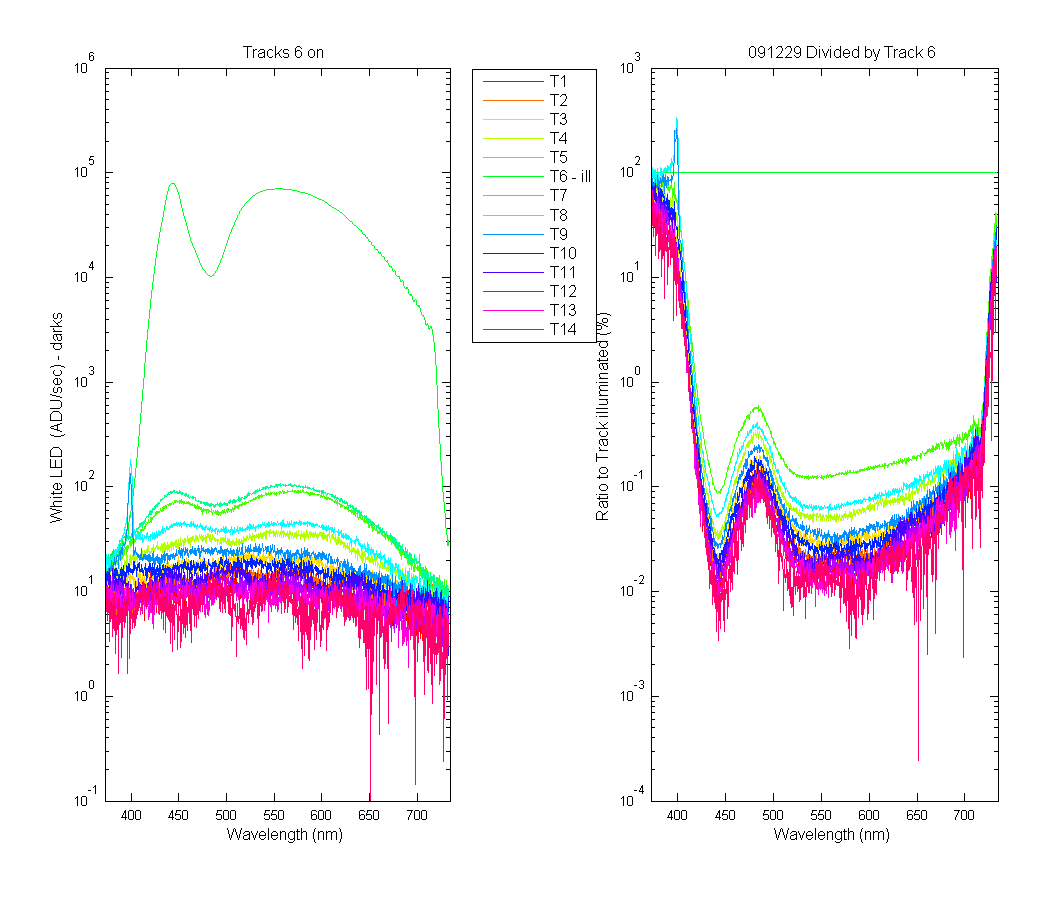
Three sources were used, Blue LED, White LED and a HeNe Laser.
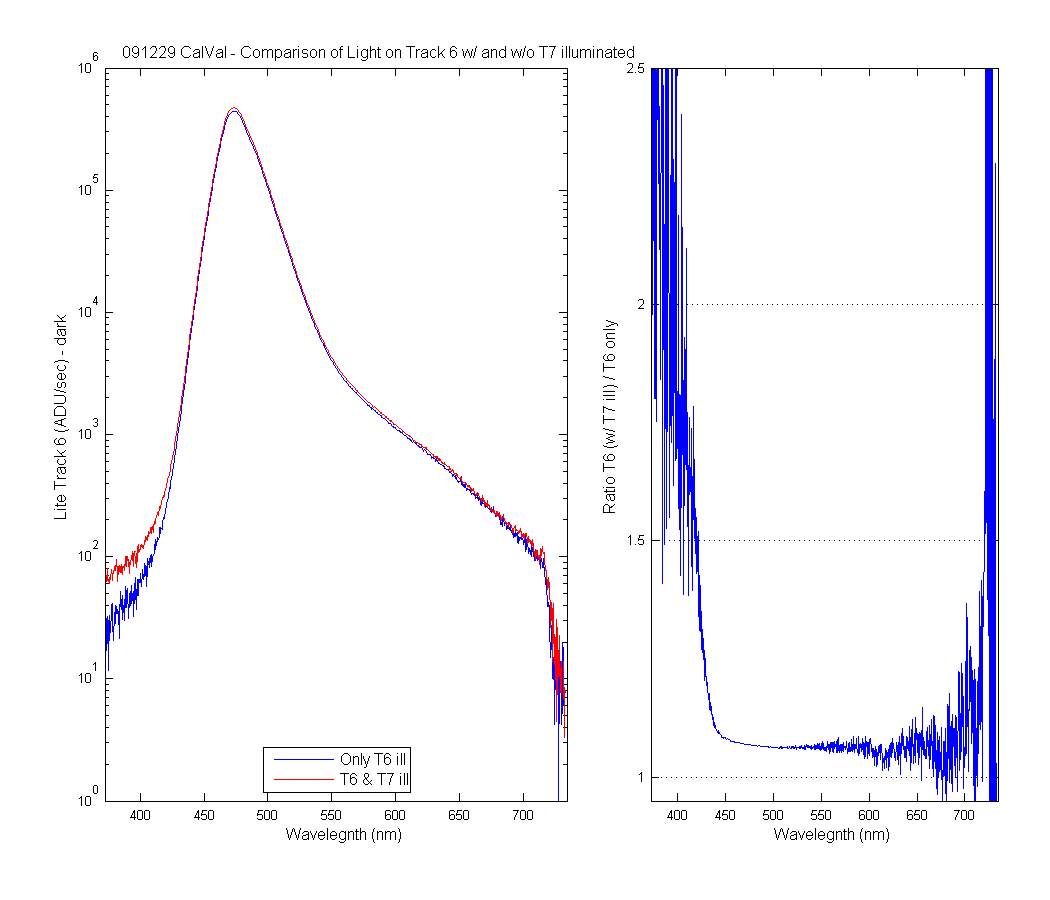
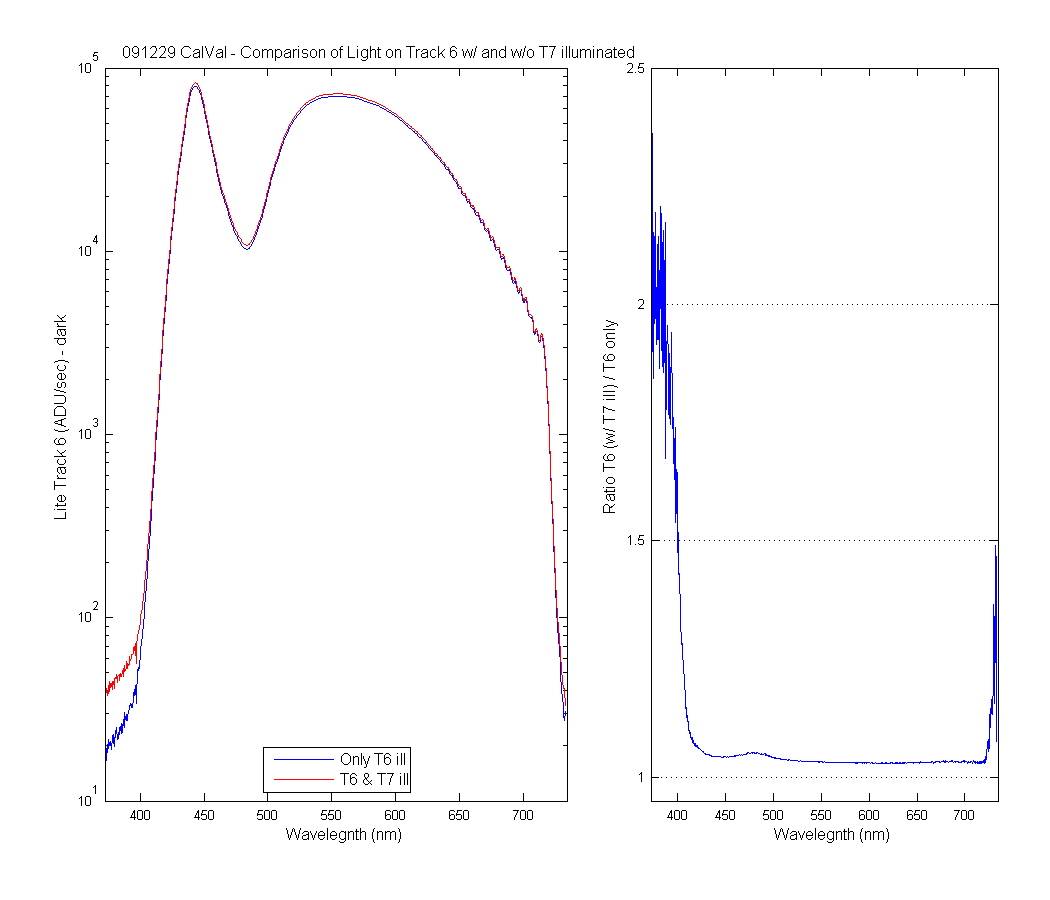
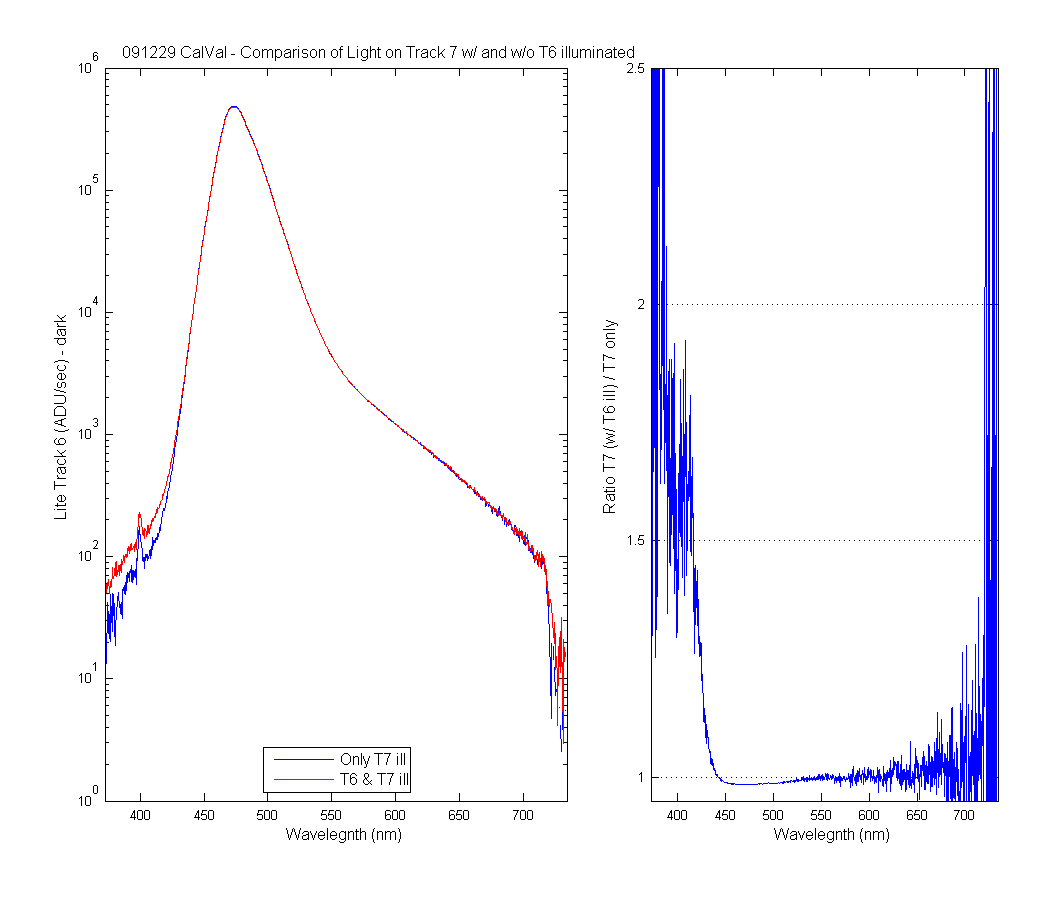
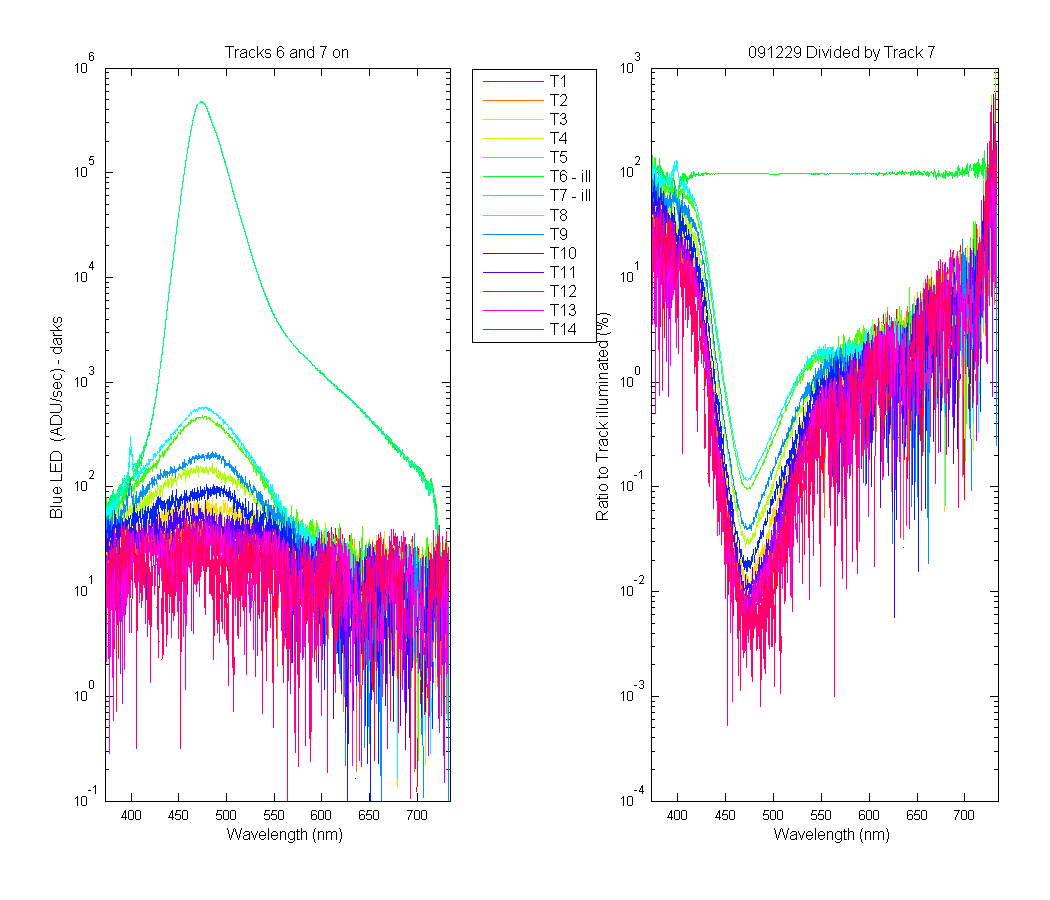
The third set of graphs show show the difference between the Track data collected with only 1 track illuminated. and two tracks illumiated. Ie how much cross track stray light is added when more than 1 track is illuminated.
The third set of graphs show the Track-to-Track straylight (cross track).
Check for Light Leaks
Net adjusted Ligth scans.
These graphs show the difference between the Track data collected with only 1 track illuminated.
and two tracks illumiated. Ie how much cross track stray light is added when more than 1 track is
illuminated.
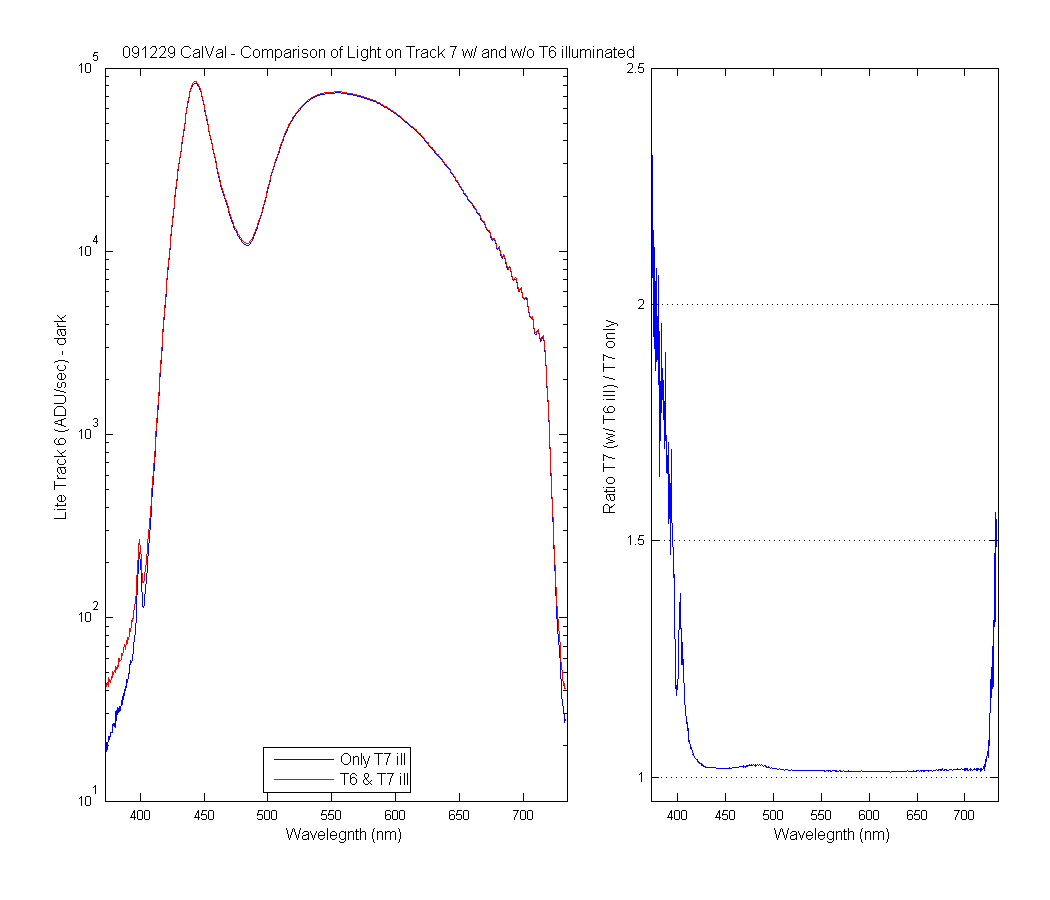
More graphs showing the Track-to-Track straylight (cross track).
pwd: C:\zflora\mldata\MOBY2\Intital_testing\091229
Date: 06-Jan-2010 15:27:57
Created from calval_(1)