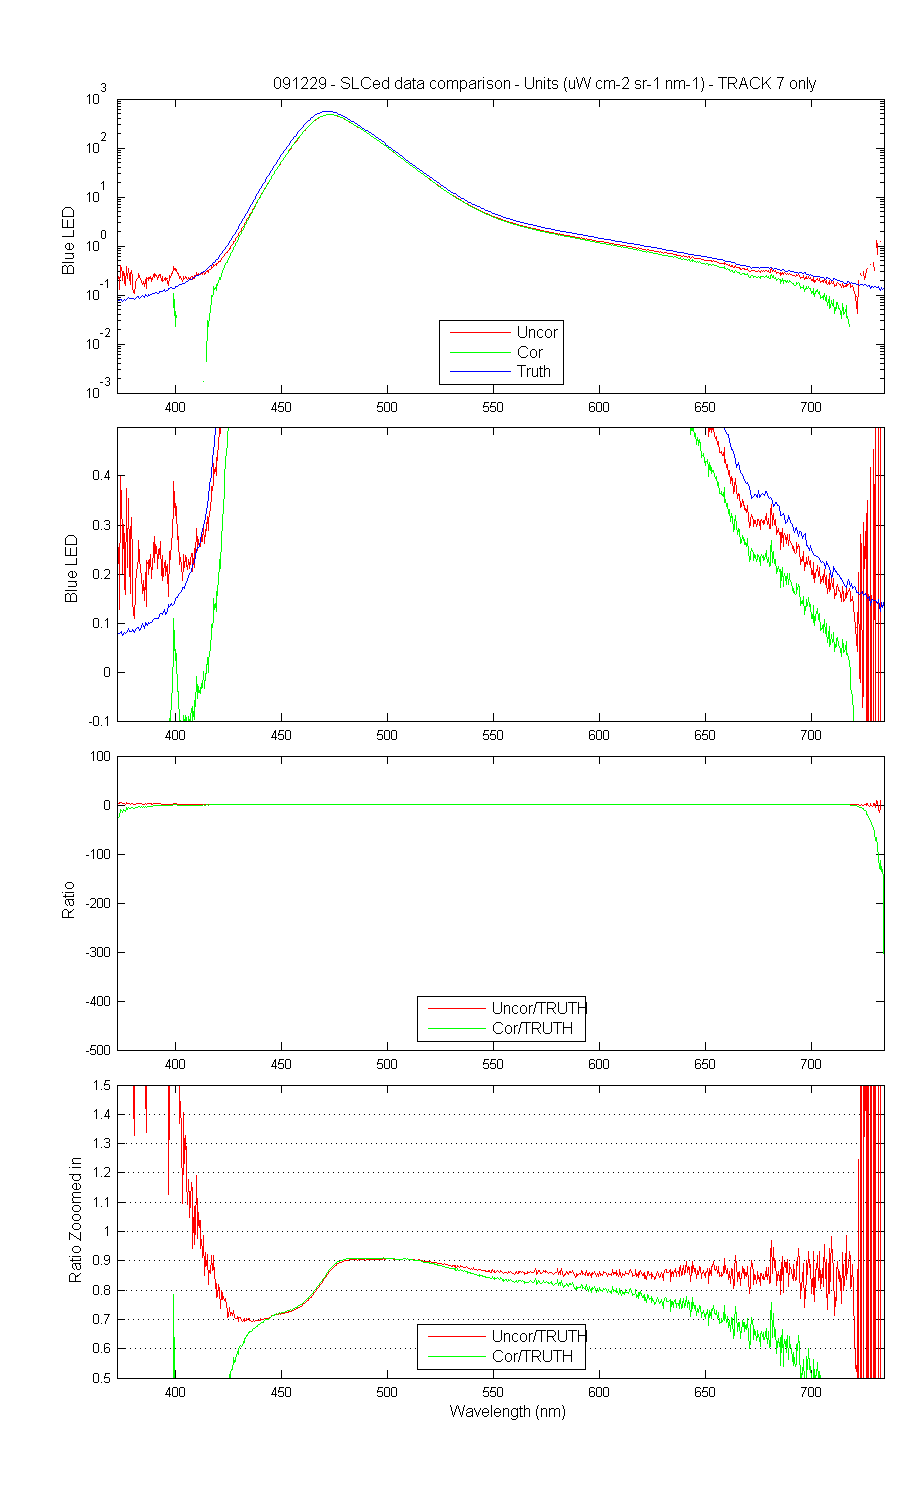
For some reason the blue spec LED data is 10 percent or more lower than the NIST truth????
SLCed validation data
pwd: C:\zflora\mldata\MOBY2\Intital_testing\091229
Date: 08-Jan-2010 11:17:30
Created from pltmkslcrsp_(1)
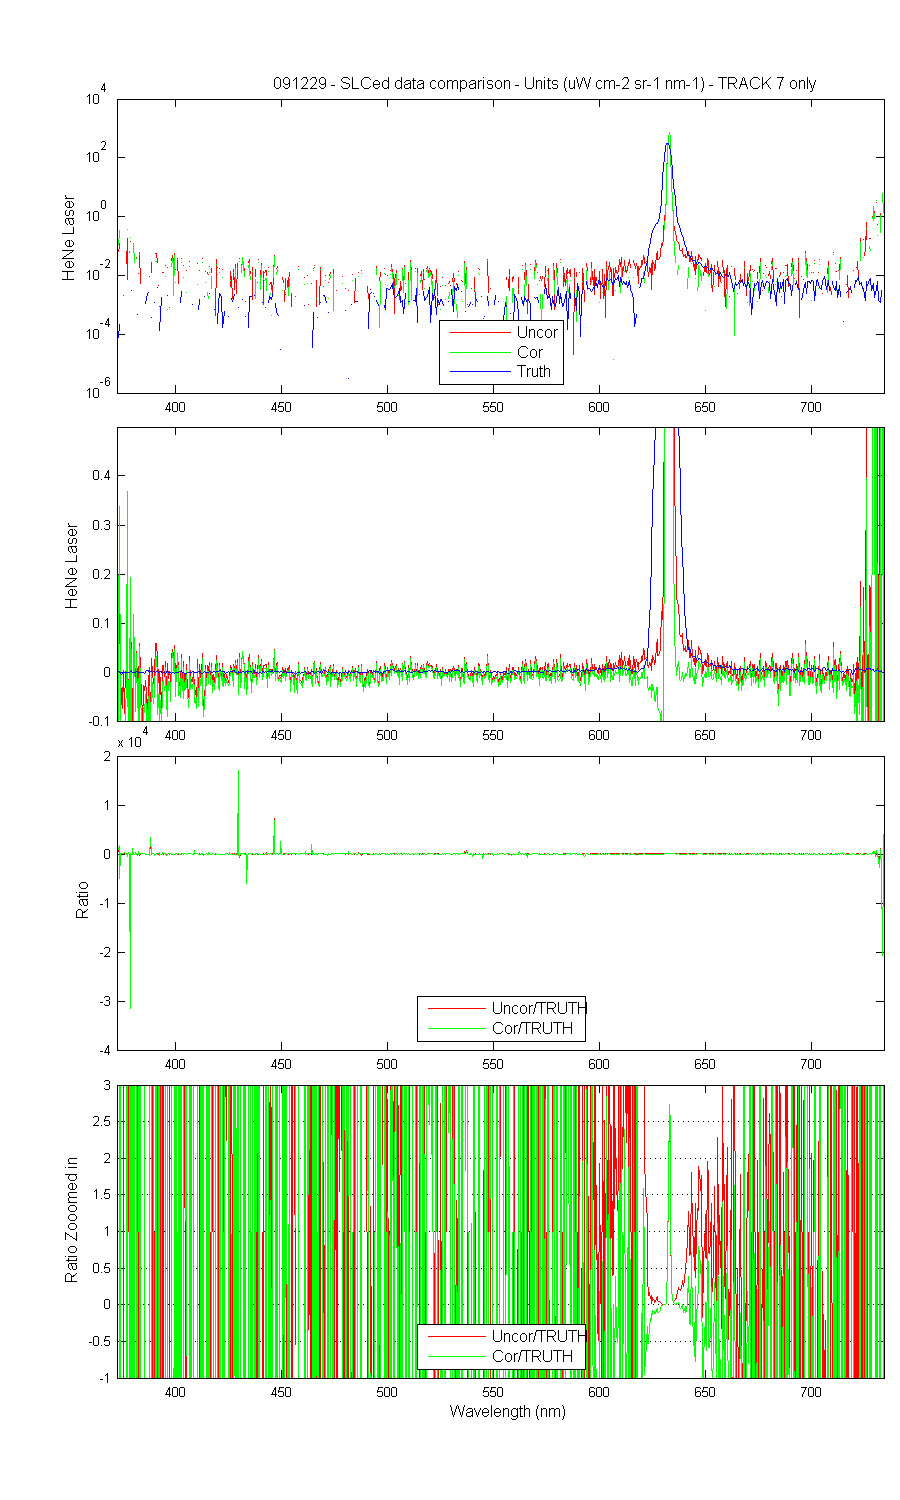
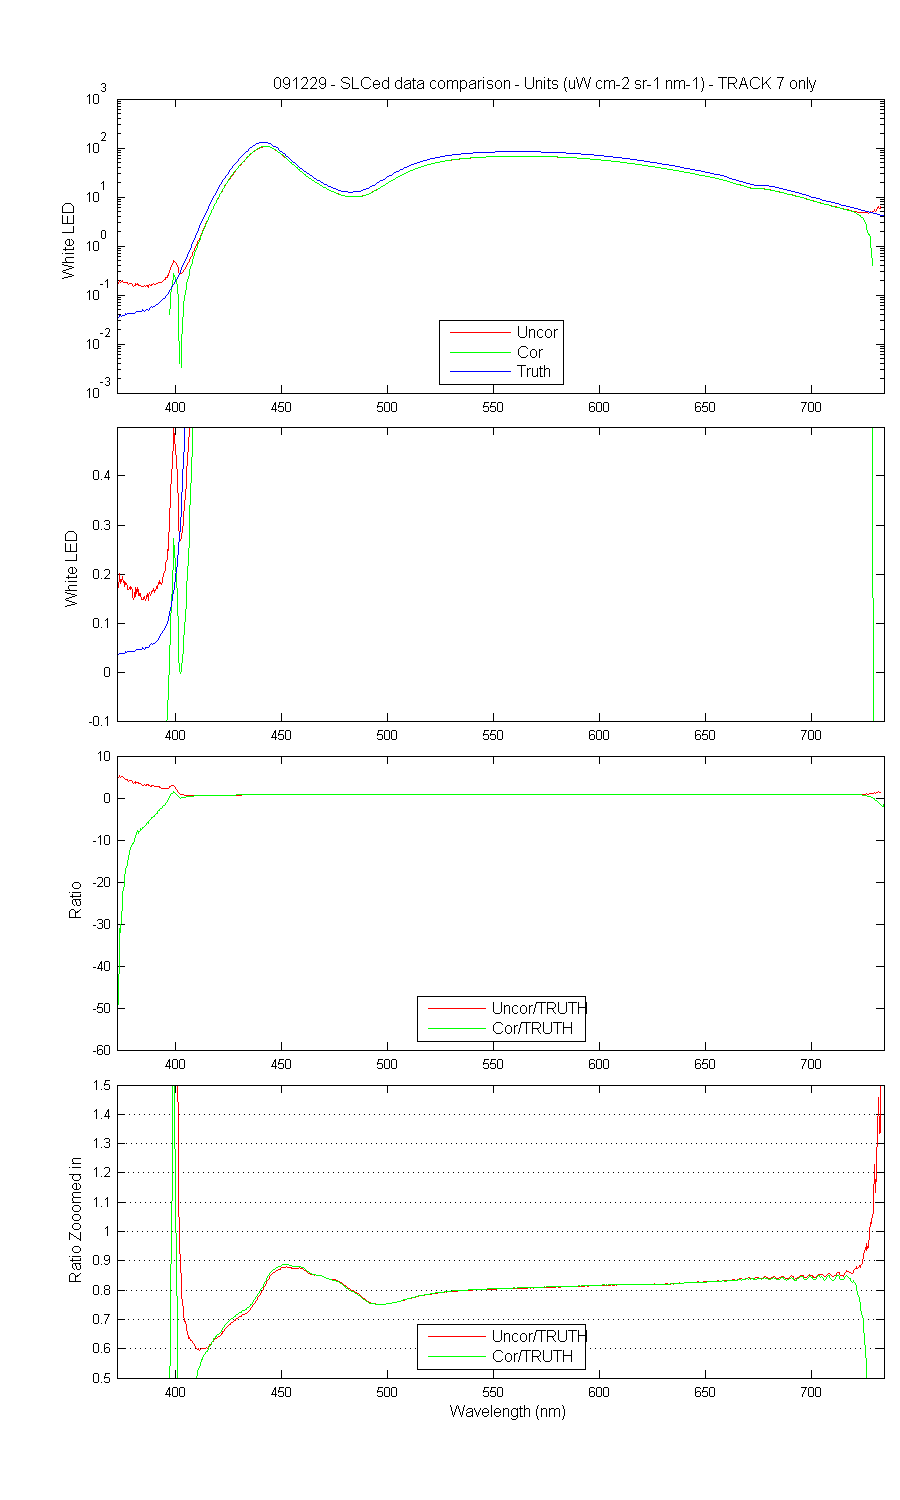
These graphs compare the SLCed HeNe Laser, blue LED and White LED data with the uncorrected and NIST radiance cal data (Truth). All the data was in ADU/sec and the first frame was removed. Only track 7 data was used.
Each graph contains 4 subplots for each source/filter.
For some reason the blue spec LED data is 10 percent or more lower than the NIST truth????
SLCed validation data