Carols's Intial Email on 5/25/2010 8:02 AM
Hi Steph and Mike
I am thinking we need to look a little more carefully at the wavelength calibration data for the different spectrographs and tracks, and say something in the final report.
I’d like to report what the instrument spectral coverage, bandpass and step size is. I’d like to quantify the “smile” distortion. It appears from the results on the web pages that the blue smile is OK and the red smile is NOT OK, at least according to Resonon’s specs of ~ 0.25 pixel at the middle and ~ 0.5 at the ends of the array.
So the steps are to find three good wavelength calibration lines for each spectrograph – with good signal, single lines, one in the middle and the other two at the ends; for all 14 tracks fit these peaks to a Gaussian and report the FWHM and the line center in pixel and wavelength space and plot bandpass and center as a function of track. This can go on the web page
The min and max wavelengths and the pixel step come from the wavelength calibration data for all the lines, Steph can you add a table with this to the web page.
Thanks, Carol
Mike's Email on 6/2/2010 6:11 PM
Hi Carol,
How well do you understand Gaussian fits ?
The FWHM number I get from Gauss fits seem high when I over-plot the fit w/ original Resonon data.
Ex: BSG Hg 690 nm line gives
a Gauss fit parameter FWHM = 4.33 pix
but at FWHM on the Resonon data I measure ~ 2.66 pix.
The attached plot (Resonon_Gauss_1.pdf) shows 5 lines:
1.) blue = Resonon BSG spectra from Hg pen lamp @ 690.75 nm
2.) red = Gaussian fit = f( amplitude, center, width )
3.) green = fit's base & amplitude
4.) cyan = 1/2 * ( base + amplitude ) i.e. FWHM !
5.) black = to get fit's FWHM parameter
Where the cyan = my idea of Full Width at Half Maximum and black = Gauss fit's FWHM == 60% larger (?).
I can make a table of fit parameters Center & FWHM and we can discuss the details of Gaussianisms if they come up...
MF
Mikes Graph
Mike's Email on 6/3/2010 2:09 AM
Hi Carol, Hi Steph,
Here's a first stab at Center and FWHM in pixel space for Resonon BSG & RSG WaveCals, for all 14 tracks, at a middle & 2 end wavelengths - attached= Resonon_WaveCal_fits.xls
I'm not too confident of the FWHM data. The FWHM and "FW base" output from PeakFit are equal for all peaks fitted for one input data file, which makes me think PeakFit is fitting a constant-width Gaussian curve - even though there is a "variable width" setting - though I haven't exactly figured this out yet. I've only used the Center output for my wavecals in the past... I'm also curious to look at the Std Err output for each of the Gauss coefficients and put errorbars on the Center coefficients.
The "Red End" Center pixel output for Track#13 is way off the others - I did double check this by re-running PeakFit - but I don't know why it is so different.
If Steph could run her approximate wavecal polynomials on these pixel numbers we can get approximate Center & FWHM in nanometer space. I.E. I did not try to make new wavelength estimates.
Aloha, MF
Mikes Excel sheet
Carol's Email on 6/3/2010 5:21 AM
Mike, send me the resonon data for the BSG HGpen pixel 119 line (blue points in your plot). I will fit to a guassian in Origin.
I think you are letting the center, amplitude, and width vary. In this log plot, did you then normalize the fit and the data so the peaks match or did you plot the fit on top of the data ? The fact that it does not match on the sides is not right, but this is a log plot which makes things look funny. Plot the same thing linear and see how it looks.
Also, a word on "width" the "sigma" in the standard Gaussian formula is not the FWHM, it is something like 2.4 times or 1/2.4 or something like that I have to look it up. But still the fit and the data should line up.
Also we can cc Al he is expert in all of this.
carol
Carol's Email on 6/3/2010 5:24 AM
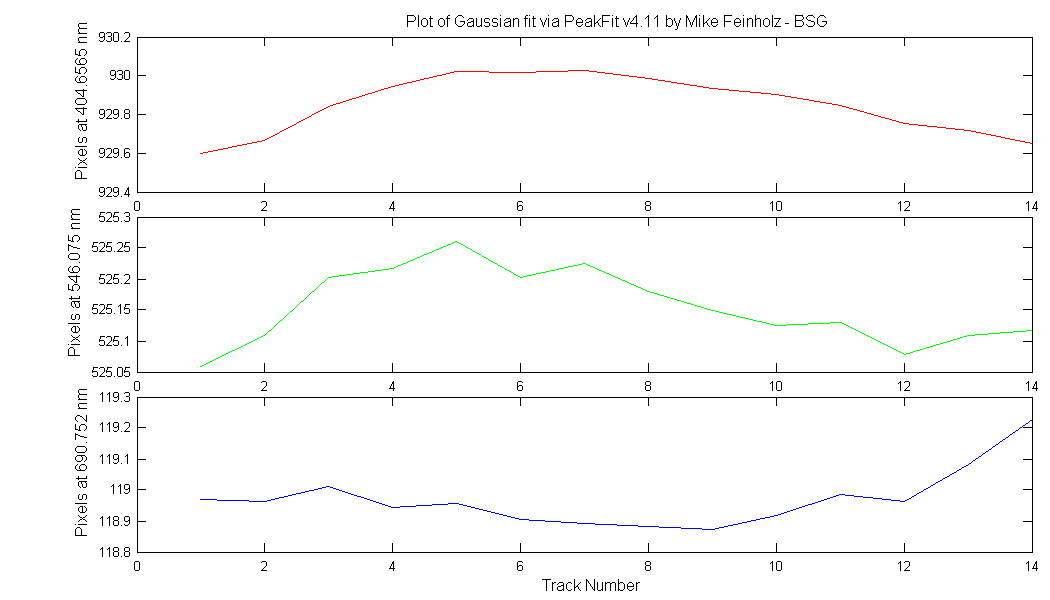
I plotted one of the results (x = track ID, y= pixel center) and YES we have SMILE! A thing of beauty.
Mikes's Email on 6/3/2010 1:37 PM
Hi Carol, Hi Al,
Al: Carol asked me to CC you on this email reply... For Al's benefit attached is the plot from the first email ( see "Original Message" at bottom ): Resonon_Gauss_1.pdf, and the spreadsheet with results for 2 spectrographs, three emission lines per spec, 14 tracks per spec: Resonon_WaveCal_fits.xls
For Carol, attached is the BSG Track#1 spectra from the Hg lamp:BSGhg01.datBSGhg01.dat
Here are the PeakFit results for the line ~ pixel 119:
Fitted Parameters
Peak Type a0 a1 a2 2 Gauss Amp 73.9751349 118.968267 1.84083851
Measured Values
Peak Type Amplitude Center FWHM Asym50 FW Base Asym10 2 Gauss Amp 73.9751349 118.968267 4.33484343 1.00000000 8.67709176 1.00000000
Peak 2 Gauss Amp
Parm Value Std Error t-value 95
Amp 73.9751349 1650.89812 0.04480902 -3166.4913 3314.44155
Ctr 118.968267 58.0985280 2.04769847 4.92953480 233.006999
Wid 1.84083851 0.04629921 39.7596073 1.74996008 1.93171695
And here is the PeakFit Gaussian (amplitude) formula:
y = a0*exp( -0.5*( (x - a1)/a2 )2 )
For this input file all the PeakFit'ed peaks had the same a2 = Width coefficient, and the same output for FWHM, Asym50, FW Base, Asym10, so I'm doubtful the width is really varying for each peak.
In the first plot I did not normalize, I overplot the raw data with the calculated Gaussian ( via a0 a1 a2 coef above using x=[1:1024] ). Attached is the same plot on a linear y-axis scale: Resonon_Gauss_2.pdf
Rodger the 2.4x factor - I wondered about that yesterday, and for this peak it was FWHM/a2 = 2.3548.
It looks like the fit and the data line up, but the width looks overestimated (?)
Cheers, MF
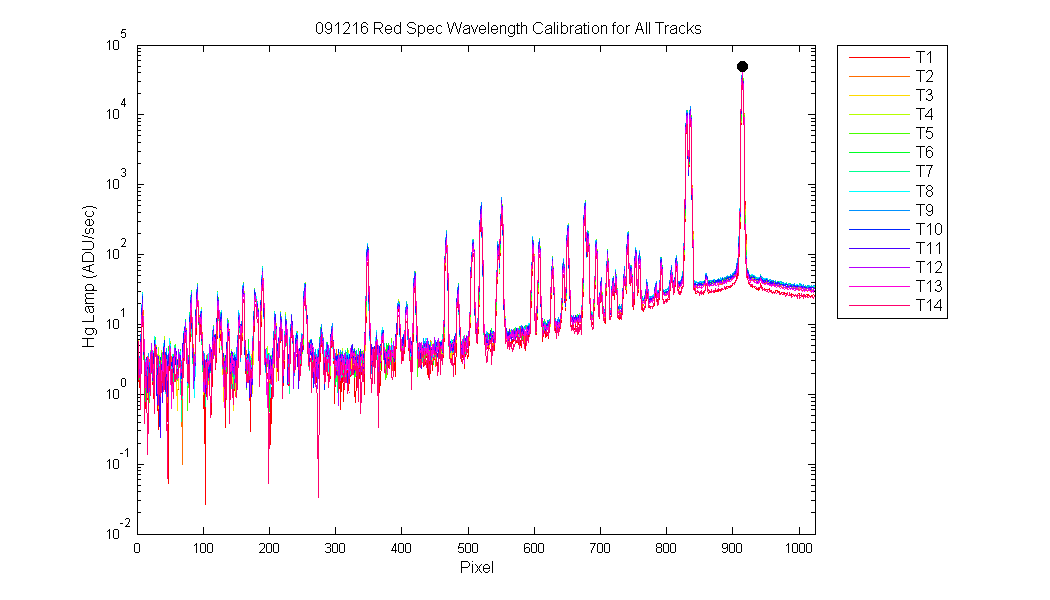
Black Dots show the peak Mike used from the RSG Hp Lamp data
Figure 1
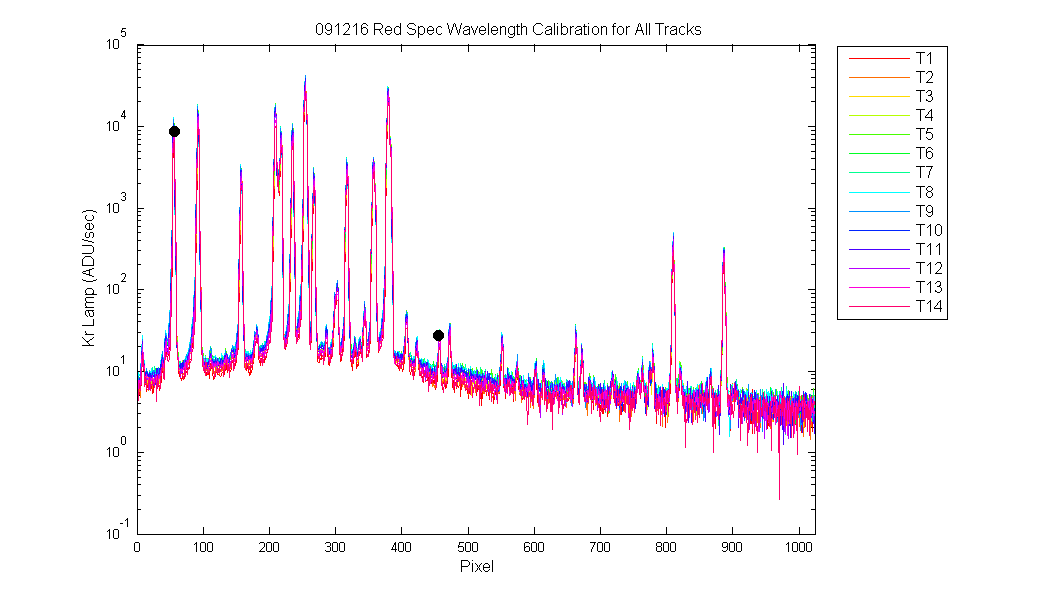
Black Dots show the two peaks Mike used from the RSG Kr Lamp data
Figure 2
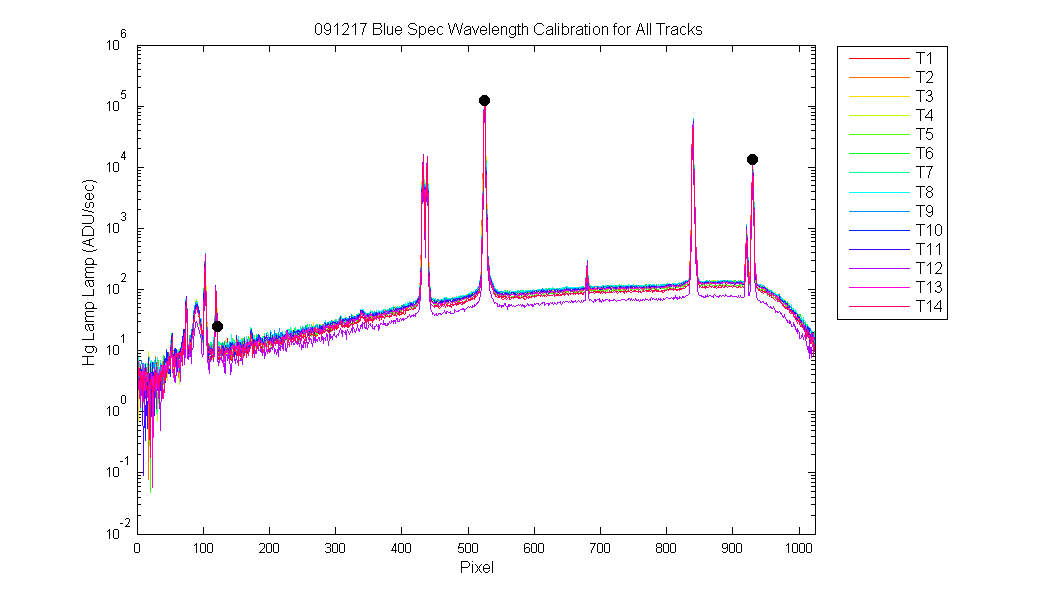
Black Dots show the three peaks Mike used from the BSG Hp Lamp data
Figure 3
Plot showing the BSG center pixel for each wavelength (three panels) and track (x-axis)
Figure 4
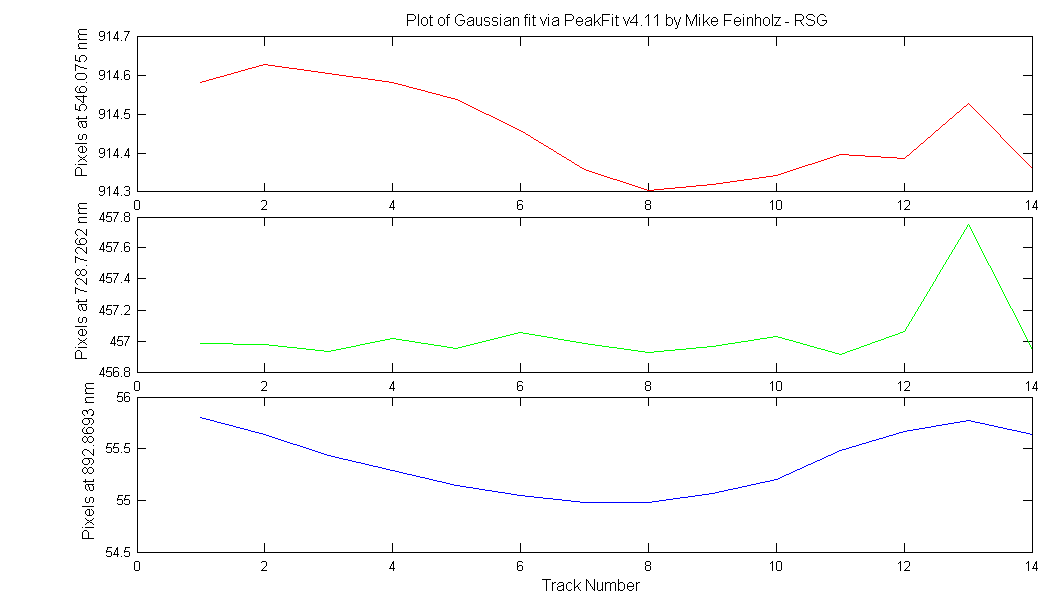
Plot showing the RSG center pixel for each wavelength (three panels) and track (x-axis)
Figure 5
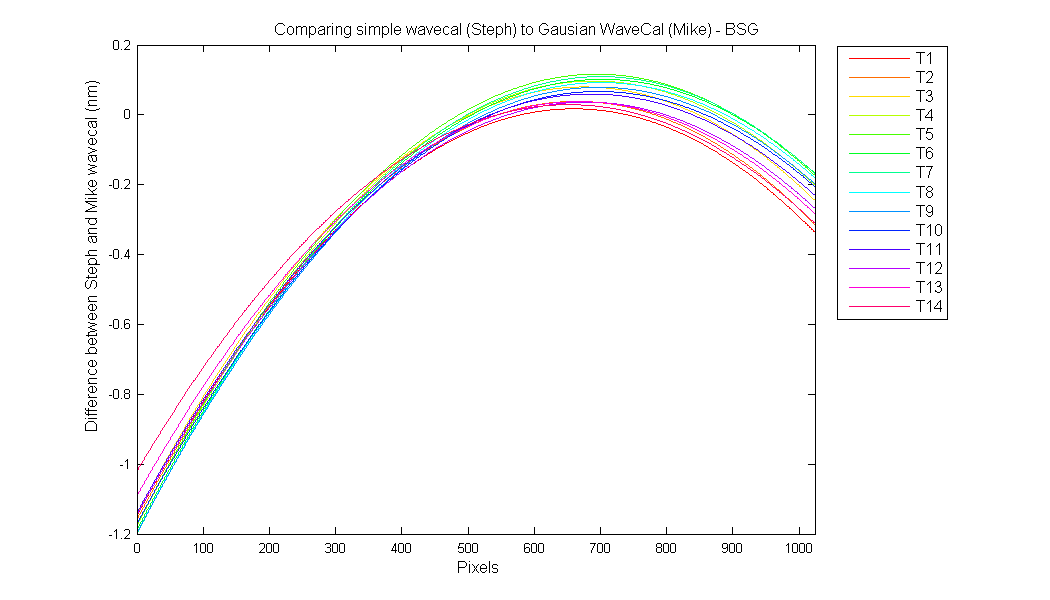
Difference between Stephanie's simple wavecal and Mike's Gausian wavecal for the BSG (Mike- Steph).
Figure 6
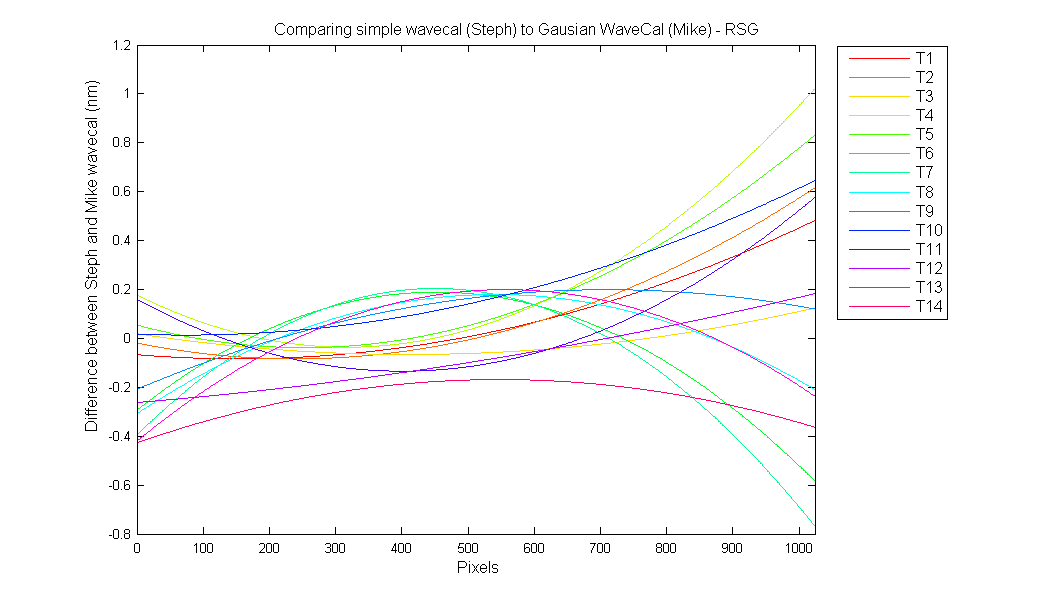
Difference between Stephanie's simple wavecal and Mike's Gausian wavecal for the RSG (Mike- Steph).
Figure 7