REVISION DATE: 07-Jun-2012 15:04:47
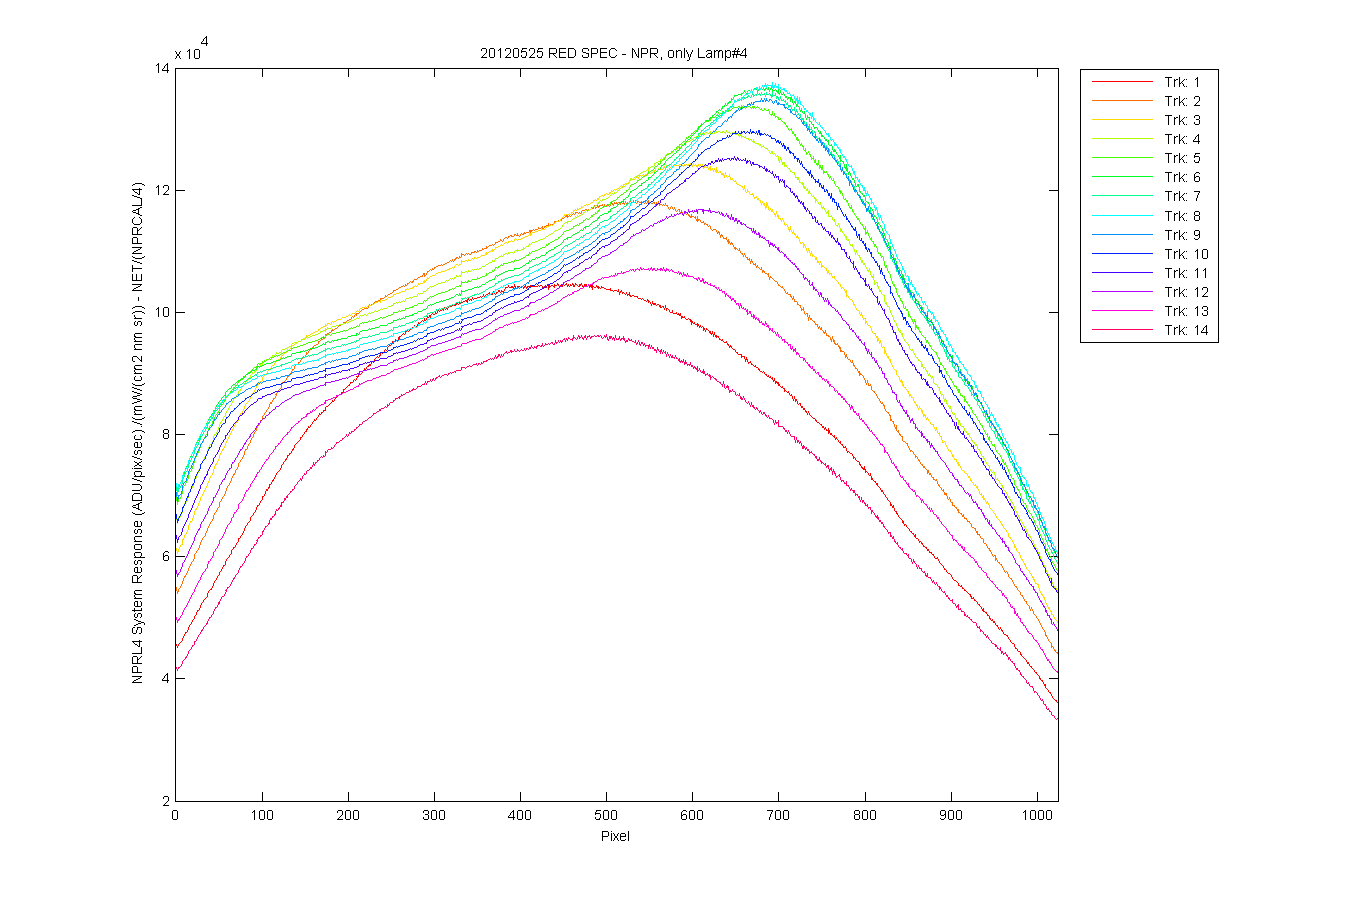
So once I had check the track definitions (which needed to be changed) and checked that the darks looked good (which they did). It was time to look at the system responses for each track. I used B2012052603 for the blue spec and R2012052601 for the red spec. I found their corresponding dark. Removed frame 1 and calculated and average dark and lite for each track to produce a NET value. I then subtracted the lite and dark and divided the result by the integration time. I then got the NPRX4_3-12_cal.txt file from Mike which is the latest NPR cal. In interpolated column 1 and 2 to the Resonon wavelengths and divided column 2 by 4 to aproximate only one lamp on (since the cal is for 4 lamps). and divdied the NET by the interped CAL column 2 to get the responses for each track. There are a lot of assumptions in this. The biggest is probably the wavelengths. Since there is no wavelength cal for 2012 the wavelengths used interp the cal data are the 2009 wavelength cal data. If this is incorrect then the response could be off. We also have no intergration time cal which could change the values by a lot. Mike and Carol had to use very fast int times because even with only one lamp on the system was saturating. Also dividing the cal by 4 is a VERY rough approximation of the lamp signal.
My biggest problem with the data is what the red spec data looks like it is saturated but if you good at the raw images (the 3rd and 4th Figues show the problem best) the max values are around 33,000 ADU. Which is not saturated. The data was collected with a Gain of 1 rather than the 3 we were using before. I am not sure how this affects things. Mark, Carol or Mike can explain this.
Email from Carol: on May 29 2012. About the Resonon response data collected on 25-May-2012
Hi Mark
Well the NPR saturates the Romack/Resonon configuration. We had to run with only one of the four lamps on, which is uncalibrated on FASCAL. Then, we had to shorten the integration time way short and run on Gain 1. Overall, the result for the responsivity will be ~5 to 10%. I will use the VXR to ratio to find the single lamp level.
It may be once we put the rest of the system together the losses will bring us into range, but it is probably better to assume a responsivity calibration will come from the MLML spheres.
When you have a second you or Mike could change the fibers to the OL455 12ö sphere 3ö opening that is out there. Send me the NPR jigs so I can play with fibers here. I took VXR data on it at four settings of the micrometer that controls the aperture iris. The first two seemed equivalent (fully open) and this means that once you reach about ô9.000ö on the setting it does not increase any more. The lowest level I took was ô1.00ö on the micrometer and this was at the bottom end of the VXR scale.
We sent the Resonon files to Steph, and Iĺll reduce the OL455/VXR data and send it along.
Thanks for the good trip, Carol
NIST NPR Cal file (from Mike)Figure 1
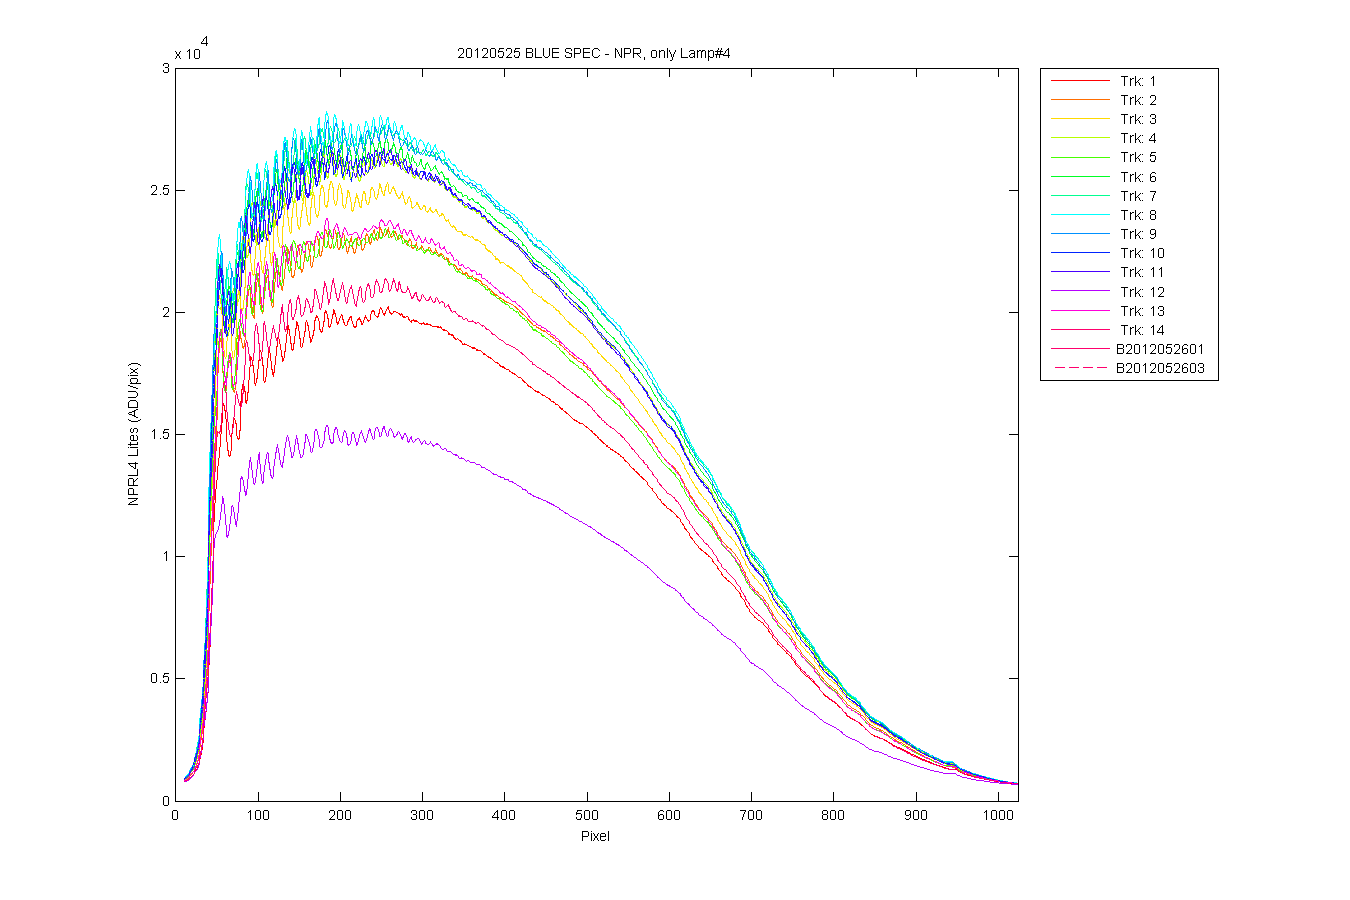
Figure 2
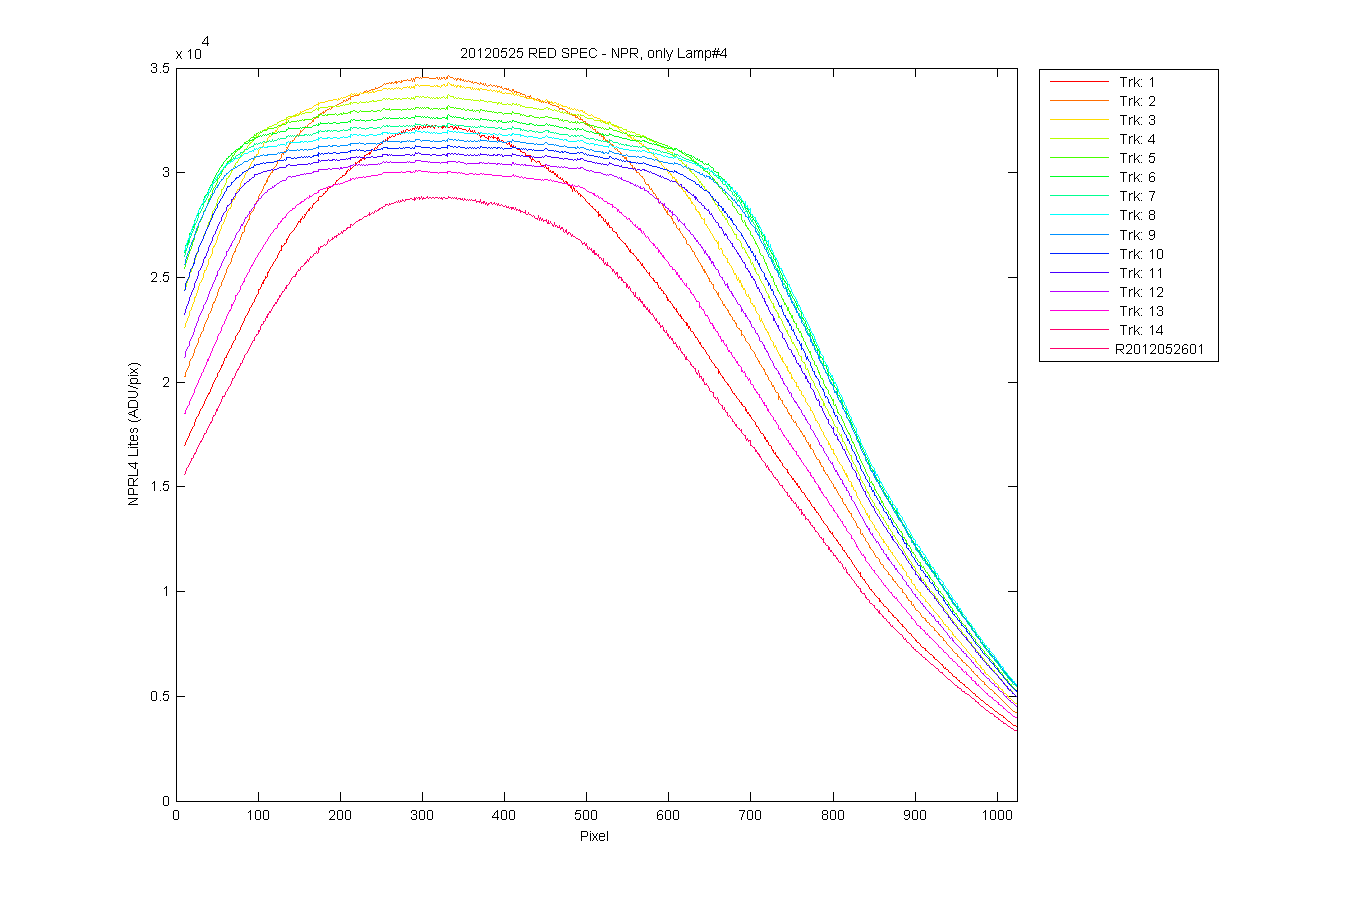
Figure 3
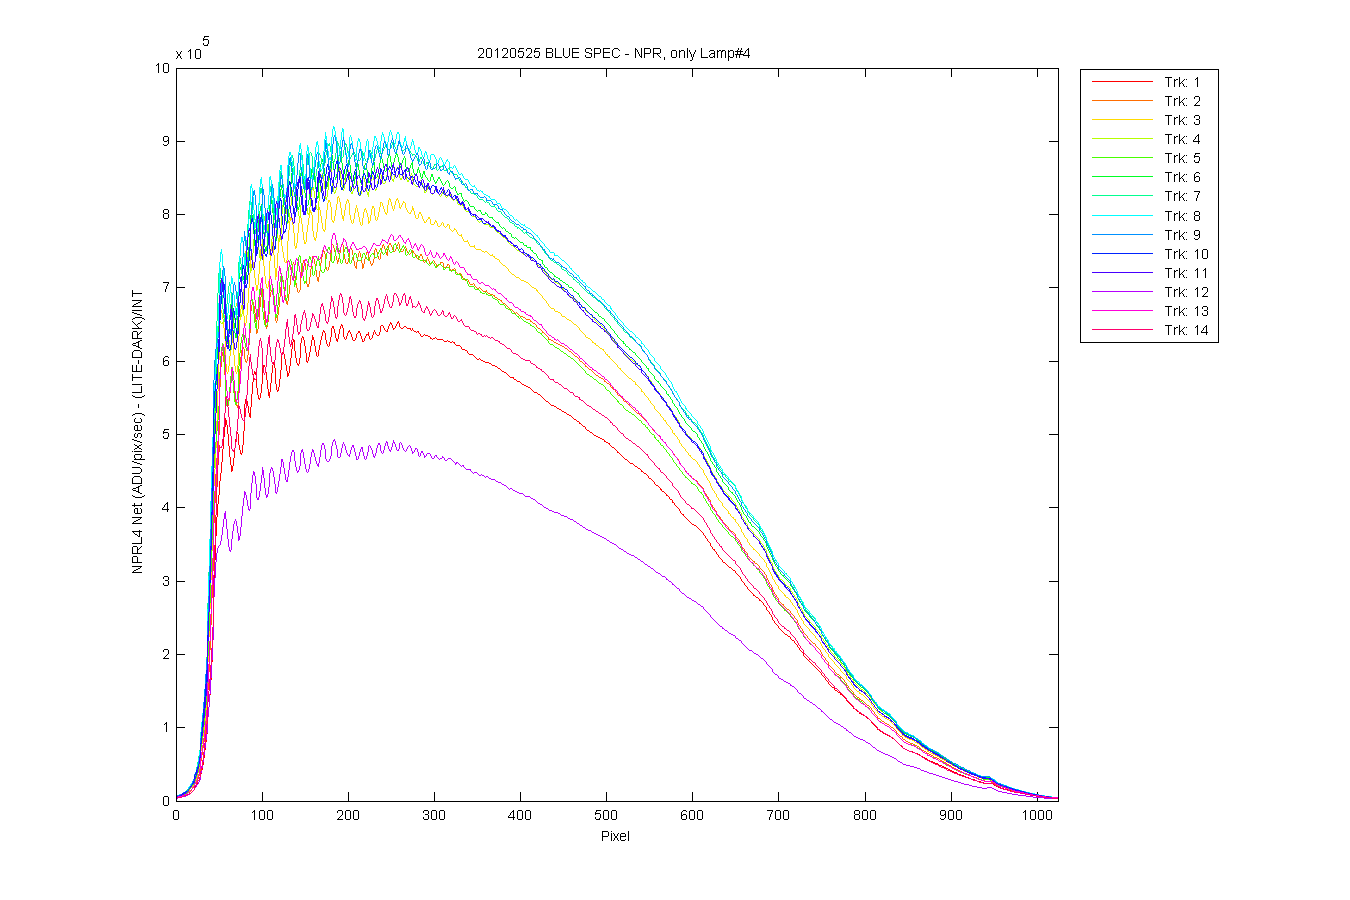
Figure 4
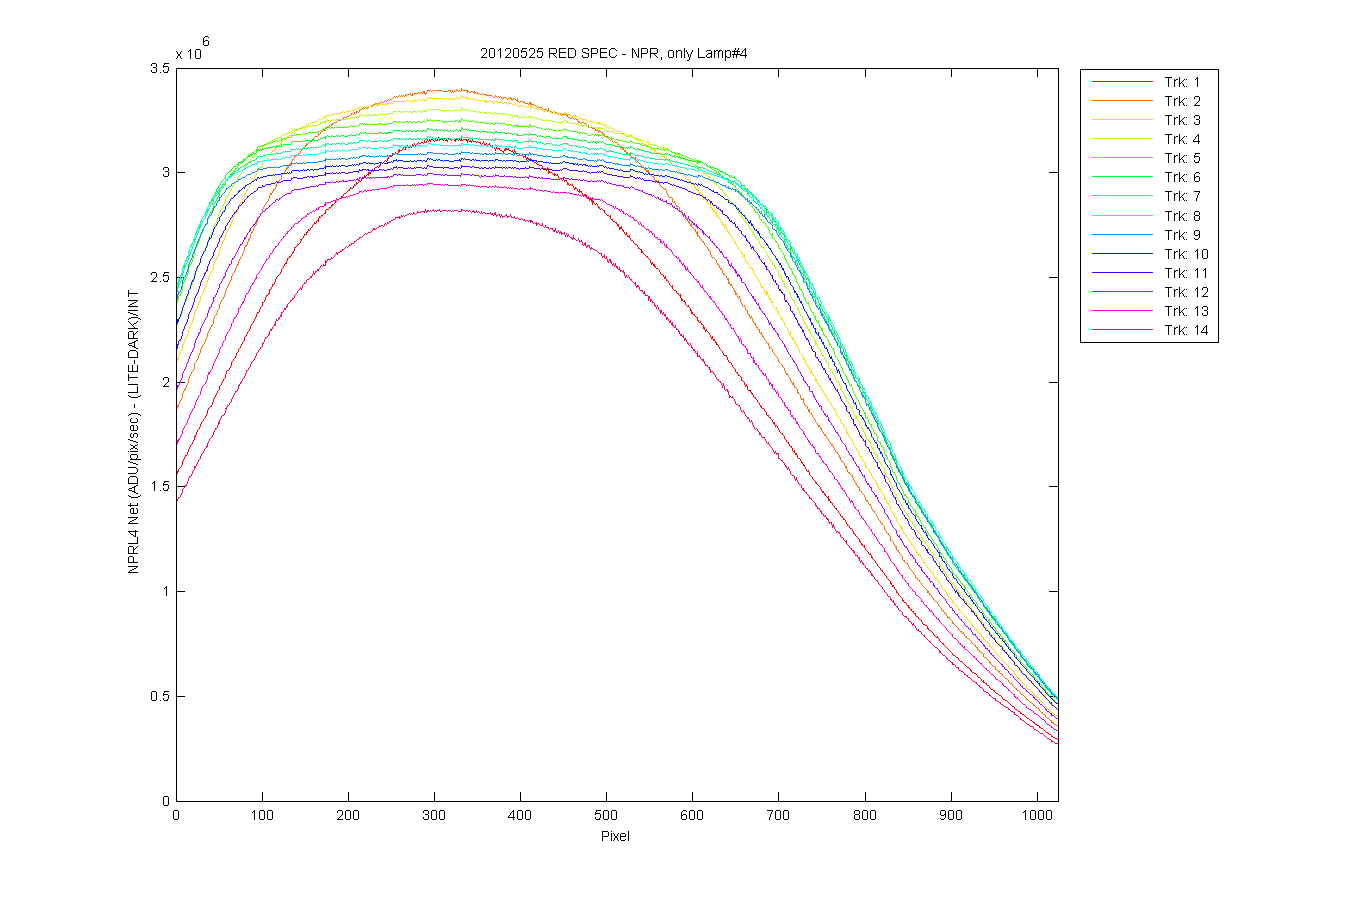
Figure 5
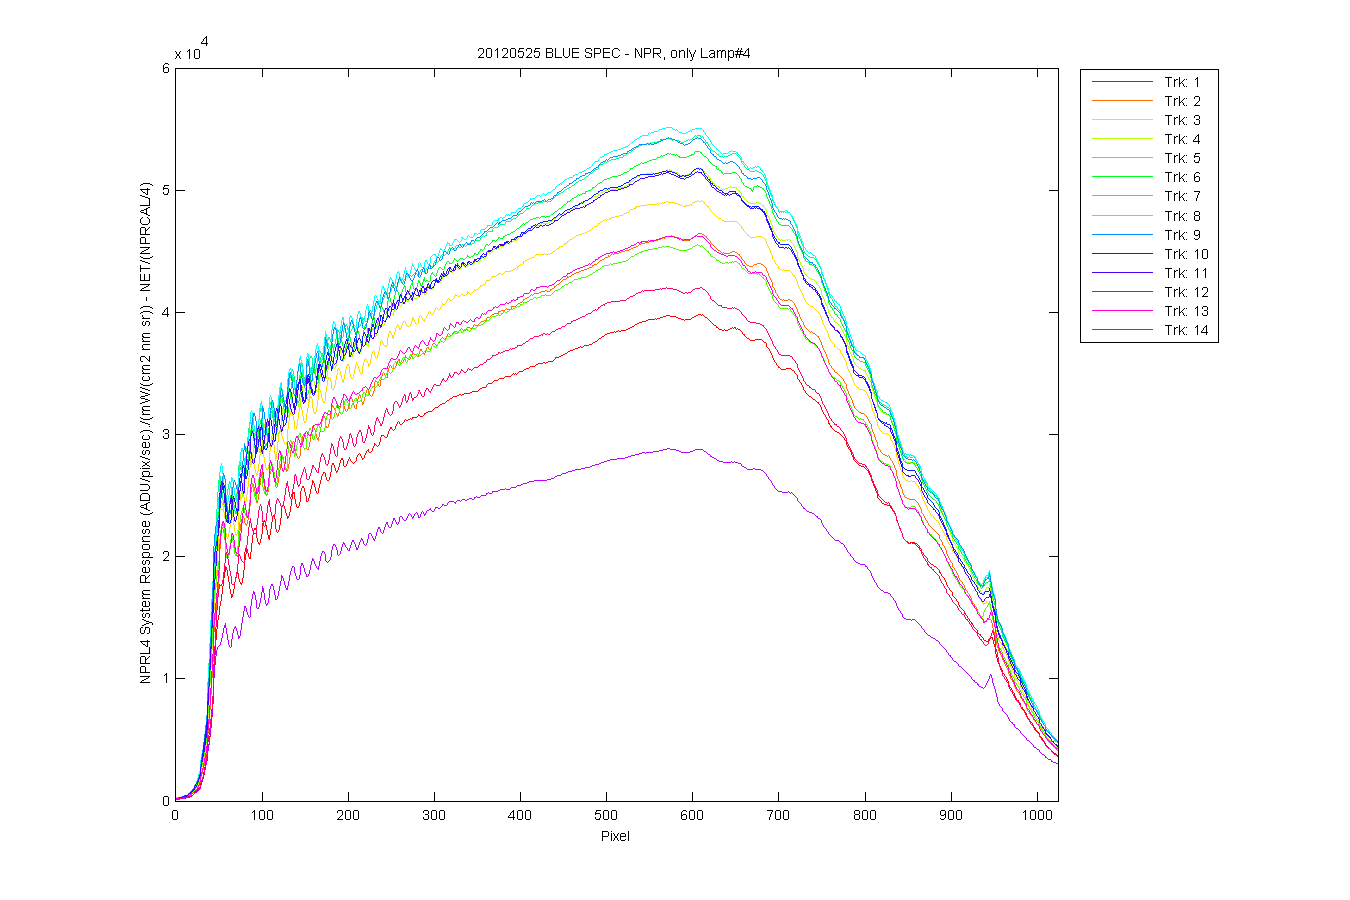
Figure 6