Here is what Thom Germer did:
From: Germer, Thomas A. Dr.
Sent: Wednesday, December 02, 2015 3:55 PM
To: Johnson, B. Carol <carol.johnson@nist.gov>
Subject: RE: test images
Well…I turned this into a B&W TIFF file that shows the Bayer pattern. This is obtained through dcraw with the -4 -T –D switches.
I am a little worried that you might end up measuring the uniformity of the sensor, the vignetting of the lens, the uniformity of the illumination, and the uniformity of the diffuser. I am wondering if there
is a way to take several pictures, where you move the diffuser a small amount between each one. Then, you look at the part that moves.
It would be interesting to see what David sees when he reads in the jpg and the raw file, compared to this one.
You might want to expose a little bit more. Your peak intensity seems to be about 1000 for the green channel, 550 for blue (I’m guessing), and 820 for red. You might be able to expose up to about almost, 8162,
or even 16324.
You’ll need to figure out the zero point. Shoot with the lens cap on, same exposure, although the camera may do that for you for long exposures. Look in settings for long exposure noise something-or-other.
Delay before sending… You should really come by. This is interesting. I split the array into four separate arrays, the red channel, the blue channel, and the two green channels. It is cool to see the difference
between the two green channels:
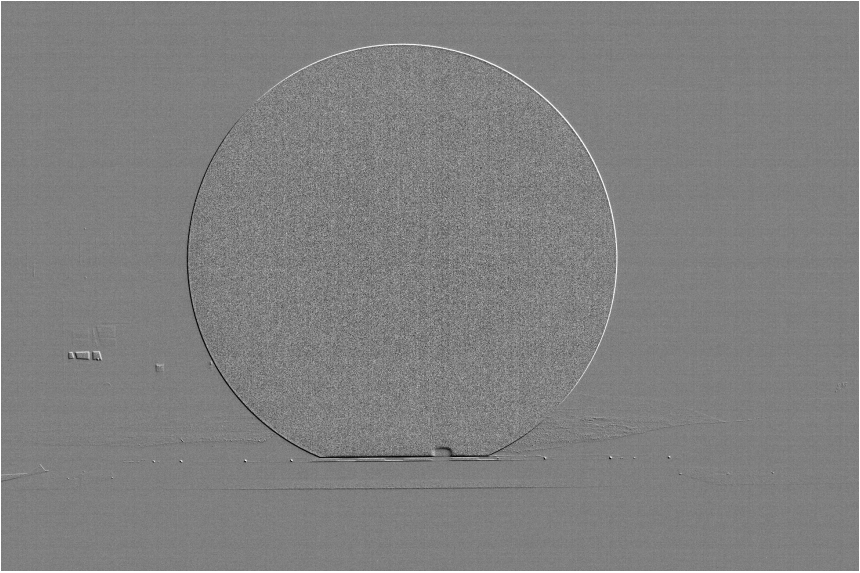
Since they are offset by 45 degrees, you can see the 45 degree derivative like spectrum. I am blowing up the difference, big time.
Here is the red (or blue…sorry don’t know which is which) channel with its scale expanded about the mean and normalized by the standard deviation.
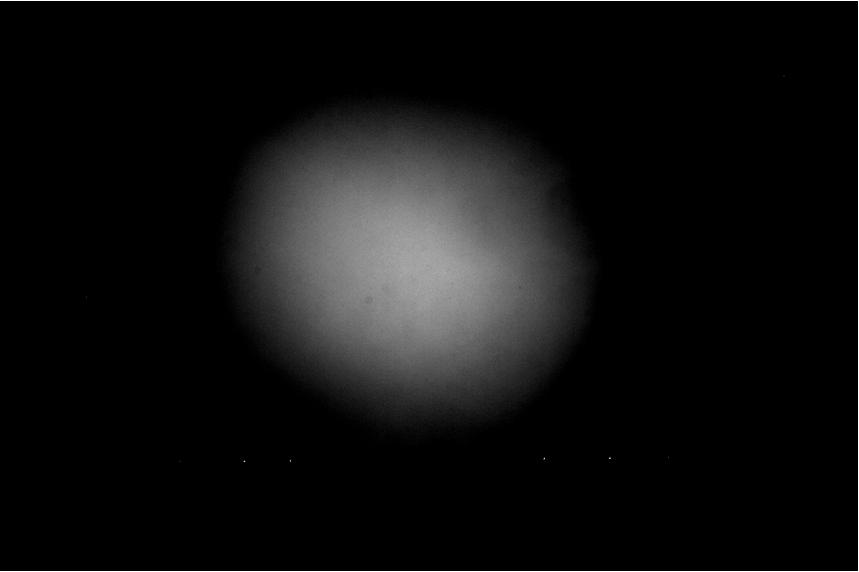
Here is one of the green channels…also expanded about the mean and normalized by the standard deviation.

Here is the blue (or is it red?) channel with its scale expanded about the mean and normalized by the standard deviation.
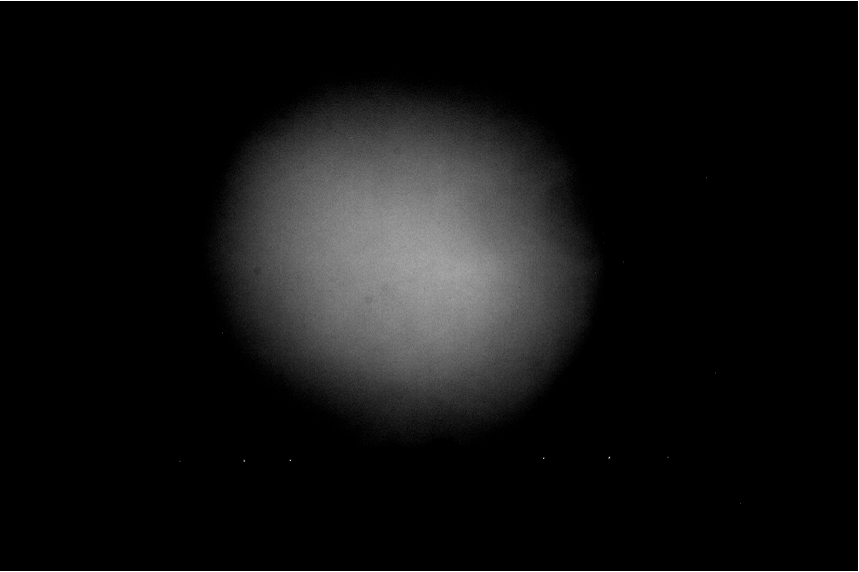
There is something about the final one which is different than the first two…
Maybe I can explain this later, but I’m thinking one end of the spectrum is diffusing more than the other end…
I got to run…
Thom
From: Johnson, B. Carol
Sent: Wednesday, December 02, 2015 11:35 AM
To: Germer, Thomas A. Dr. <thomas.germer@nist.gov>
Subject: test images
Hi Thom,
I am wanting to compare different diffusers under the same illumination conditions to select the best one (for uniformity). Attached are two formats of a test image I took with my Canon. I’m asking David for help with the CR2 file (I can
read the JPG in Matlab, and am checking if it will read the CR2 as well…) David has IDL which he says will work.
Anyway, this image was in manual, 3”2, f/16 and ISO 100. I have a 55mm focal length lens. Since you mentioned you were a semi pro, I am wondering if you have advice about choosing the best camera settings for what I am trying to do? (I
am not a photographer!!!) The diffusers are 9.375” in diameter. If you want to see the test setup I can show you (B011/221).
Thanks, Carol
B. Carol Johnson, Physicist
Sensor Science Division
NIST
100 Bureau Drive MS 8441
Gaithersburg, MD 20899-8441
Tel. 301-975-2322
Fax. 301-869-5700