REVISION DATE: 09-Dec-2015 14:35:31
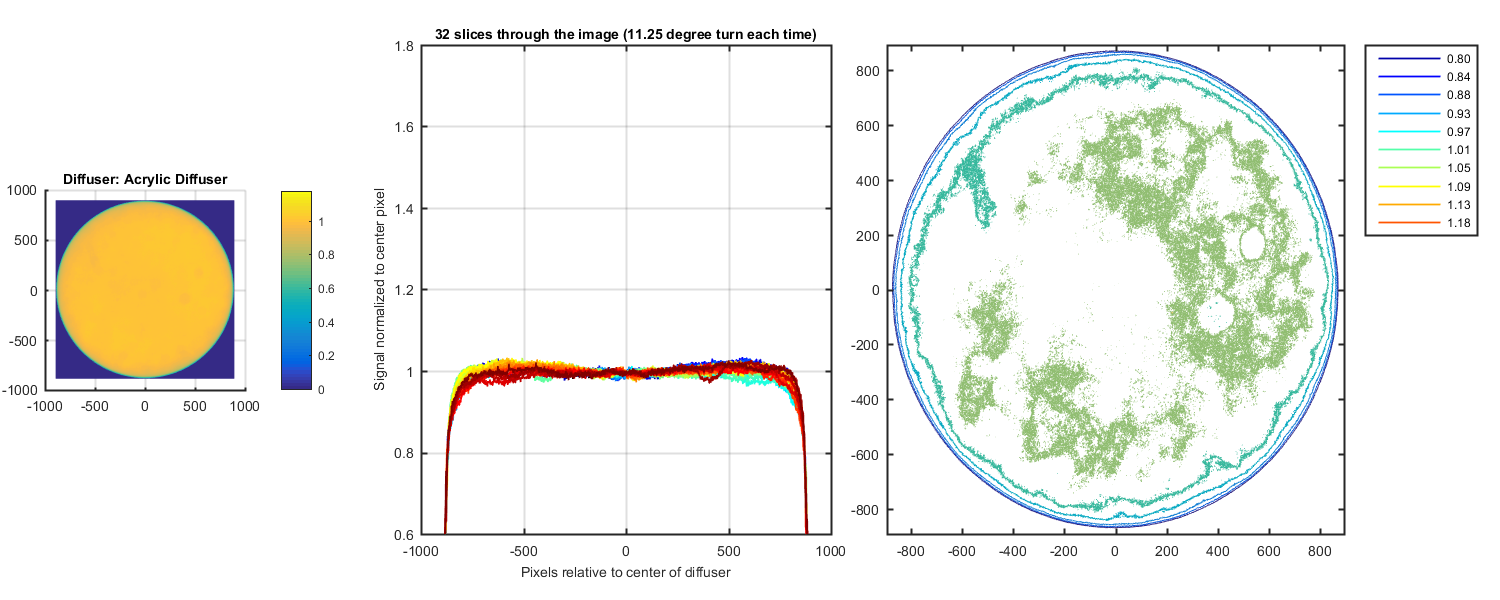
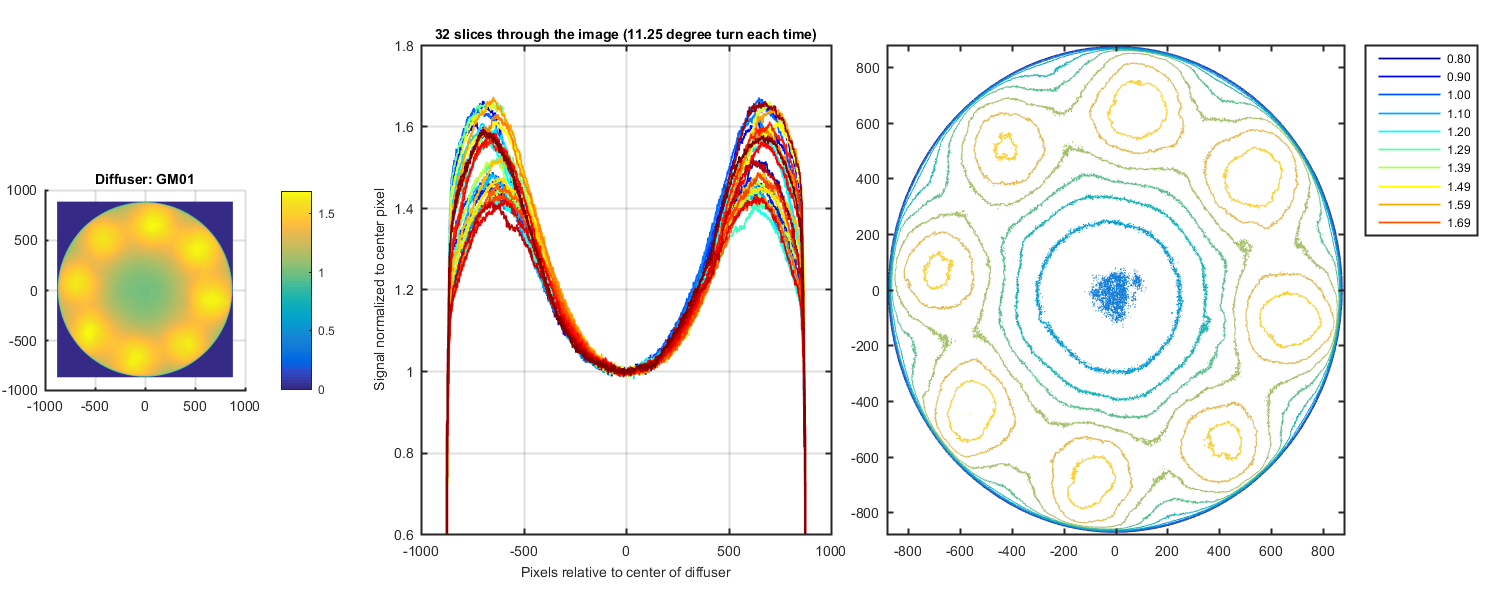
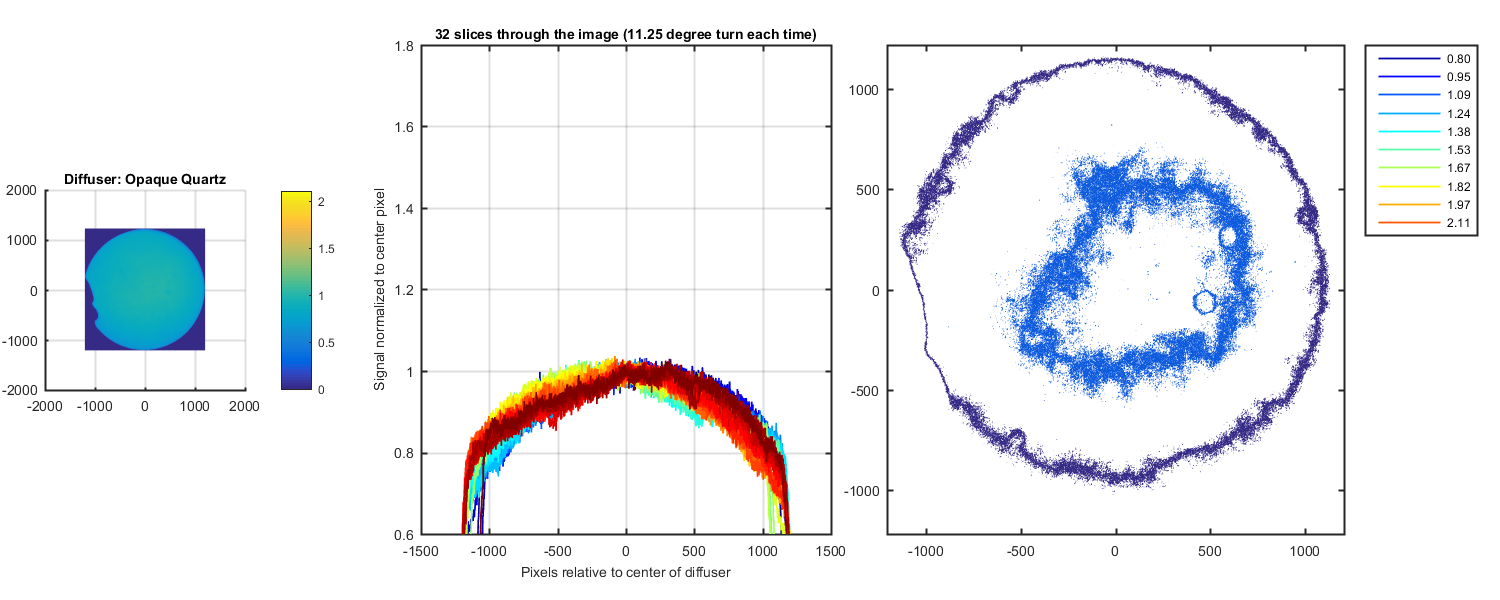
Carol took photos of 6 diffusers (see list below). I created a automated masking program. The masked image was then cut down so only the diffuser was in the image. I found the center of the diffuser and normalized the image to that value. The I plotted one horizonal line through the center of the image, rotated the image by 11.25 degrees and plotted another horizontal slice. This gives you 32 slices through the image to get an idea of the variation in the image. Each figure below is for a different diffuser. The first axes is the image as a surface plot normalized to the center pixel. THe second graph is 32 plots of the horizontal lines from the normalized image. The third graph is a contour of the image (10 levels).
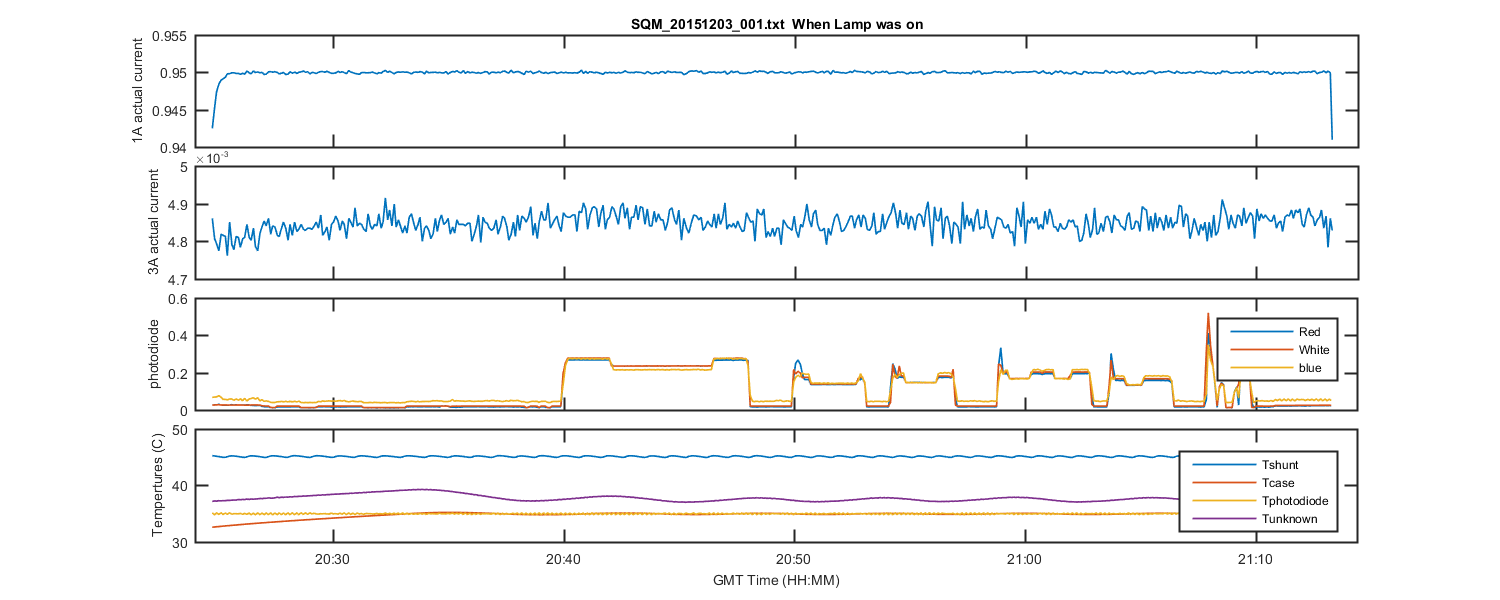
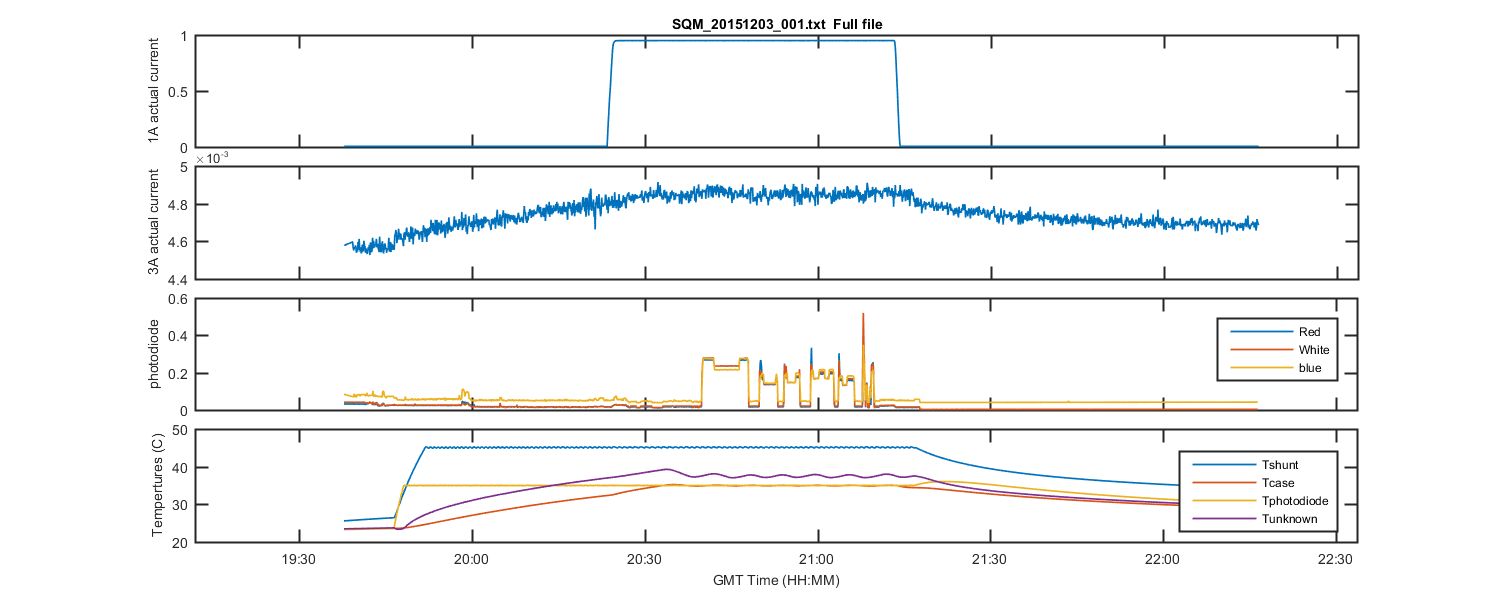
I have also added the plots of the SQM data to the bottom.
Diffuser options:
acrylic diffuser = the original acrylic diffuser installed on the SQM, which will not pass the UV we would like to have
GM01 = 10um sandblast
GM02 = sided bead blast
GM03 = Al2O3 sandblast 300 mesh 60 psi 12" distance
GM04 = 2 sided lap by hand 70 um silicon carbide
opaque quartz = a smaller diameter piece of commercial opaque quartz that will not fit into the SQM until I make an adaptor/holder. So I just held it between the camera and the SQM.
The original image. You can see the diffuser is in the center of the image. But there are also small bright spots below the diffuser which need to be masked.
Figure 1
The black and white mask. You can see all the small dots are now black and the only white is the diffuser.
Figure 2
Original image with the mask applied to it.
Figure 3
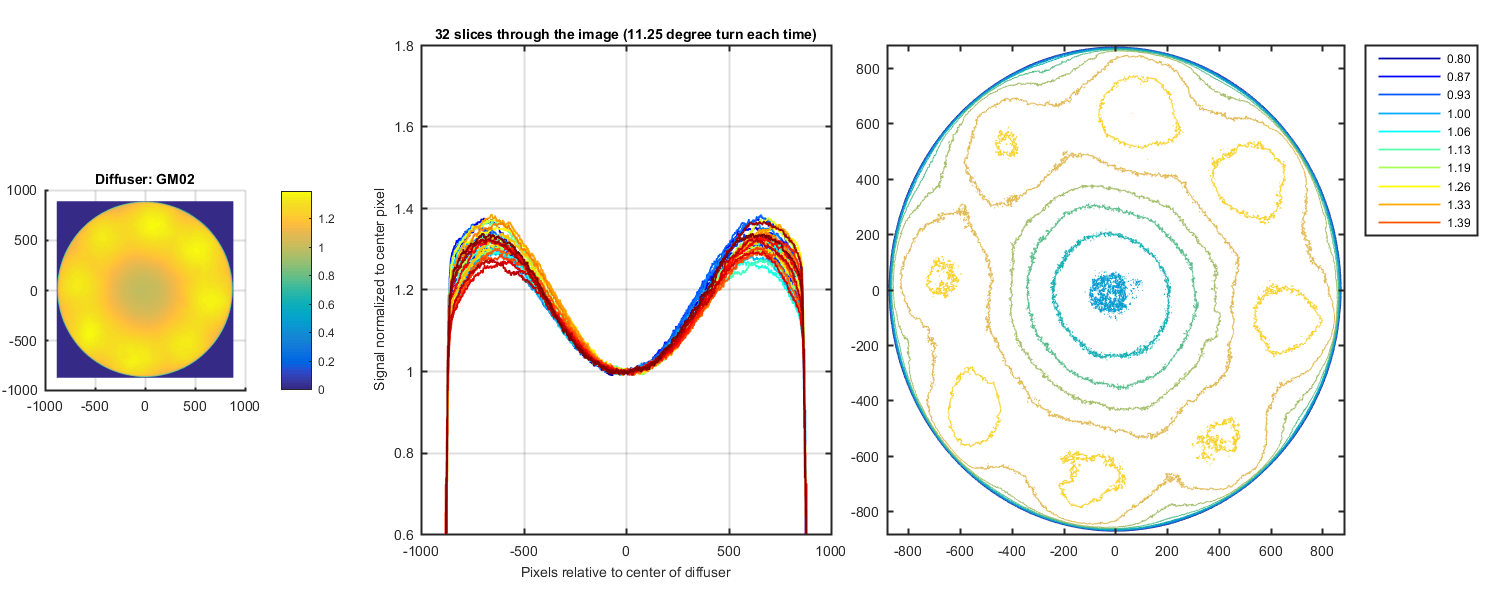
Figure 4
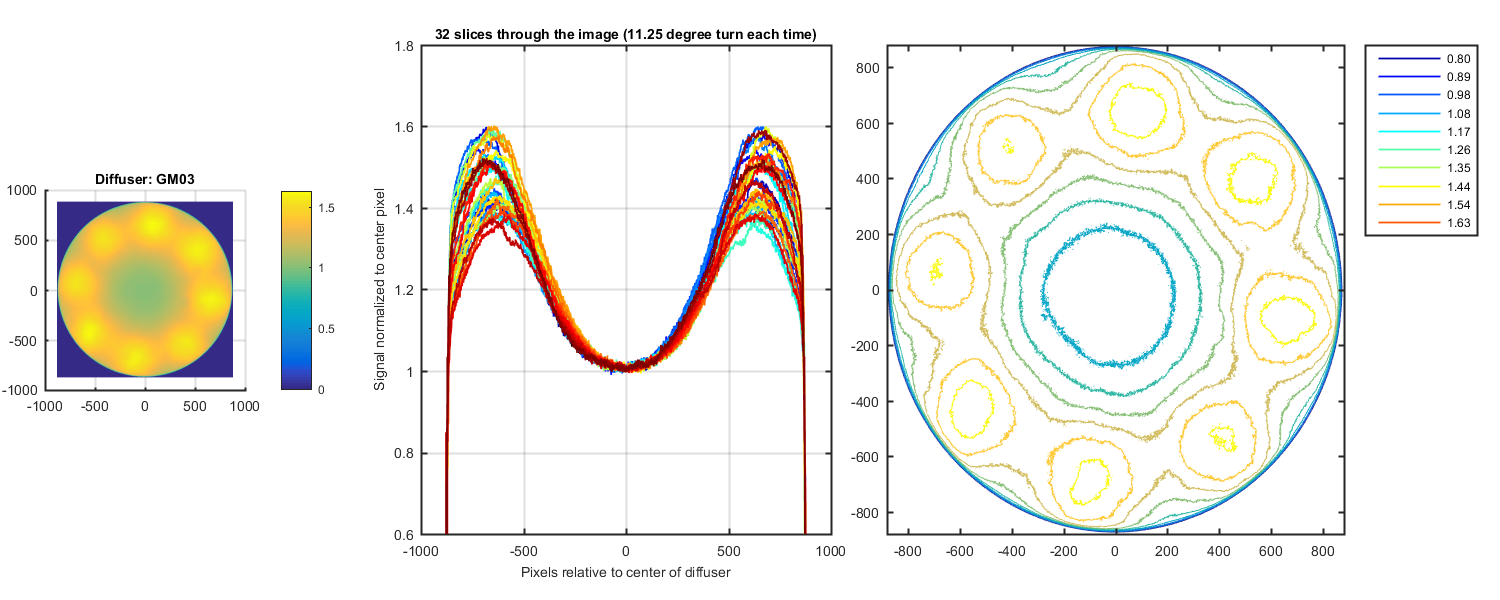
Figure 5
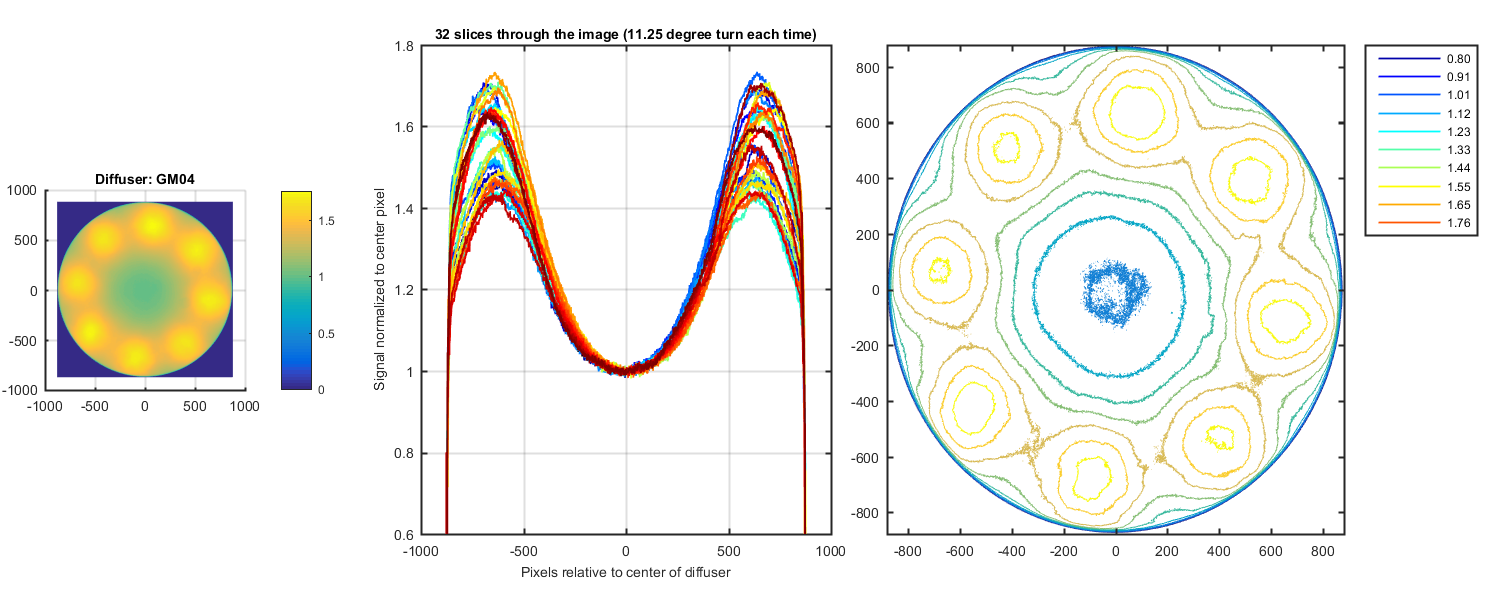
Figure 6
The original image. You can see the diffuser is in the center of the image. But there are also small bright spots below the diffuser which need to be masked.
Figure 7
The black and white mask. You can see all the small dots are now black and the only white is the diffuser.
Figure 8