REVISION DATE: 13-Dec-2016 12:51:32
Email from Mike Kehoe on 11/29/2016 8:43 AM:
Greetings All,

Casey has assembled RS5.  Please find report attached.  The test data are at the usual location, dated 11/28/16. The system is ready to ship, upon request.

This is the last Red system.  Whew -- that was harder than I thought!  We have three blue systems yet to ship.  In order to proceed, we need a camera.  We have one fiber bundle in stock.  All other parts are on hand.

-Mike
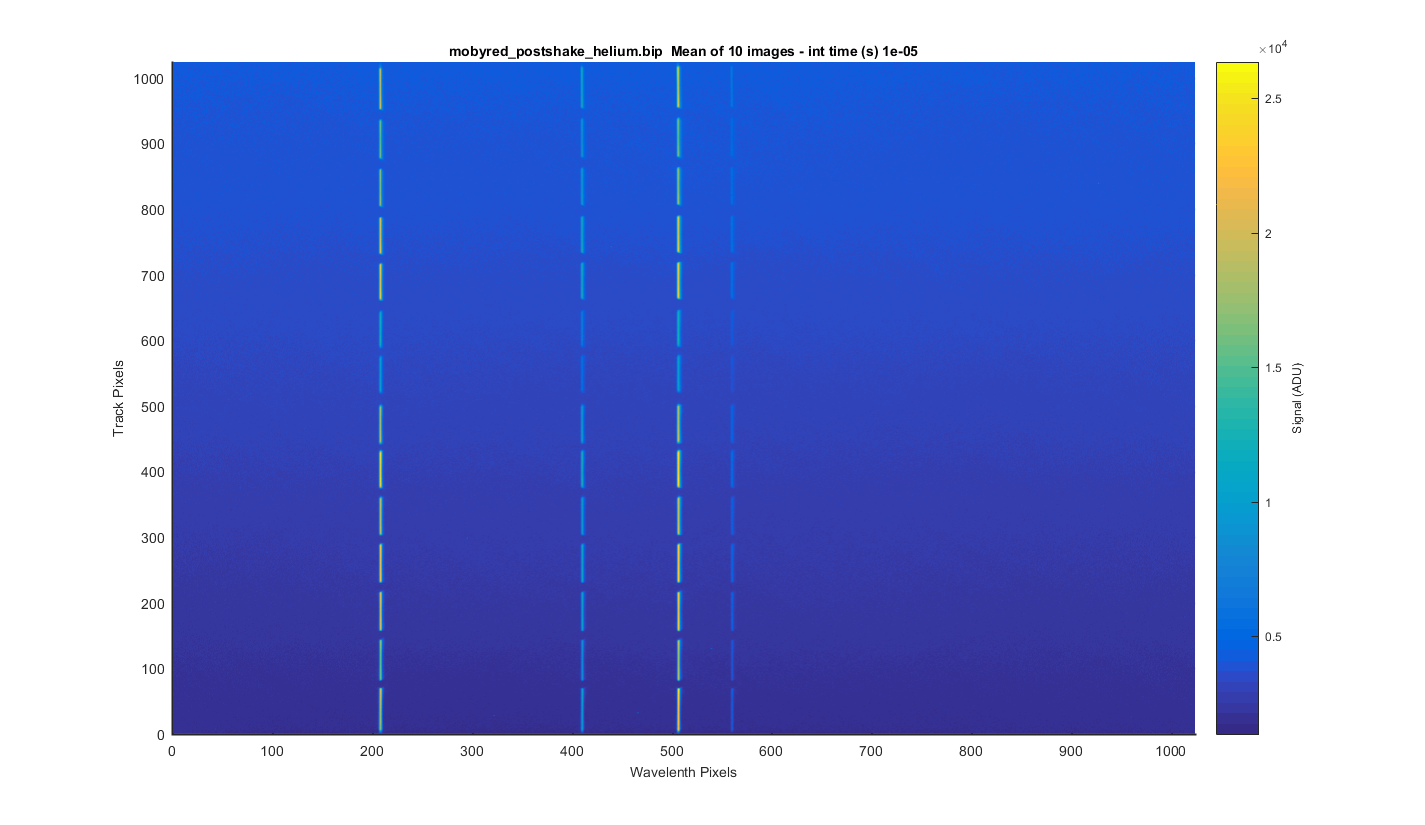
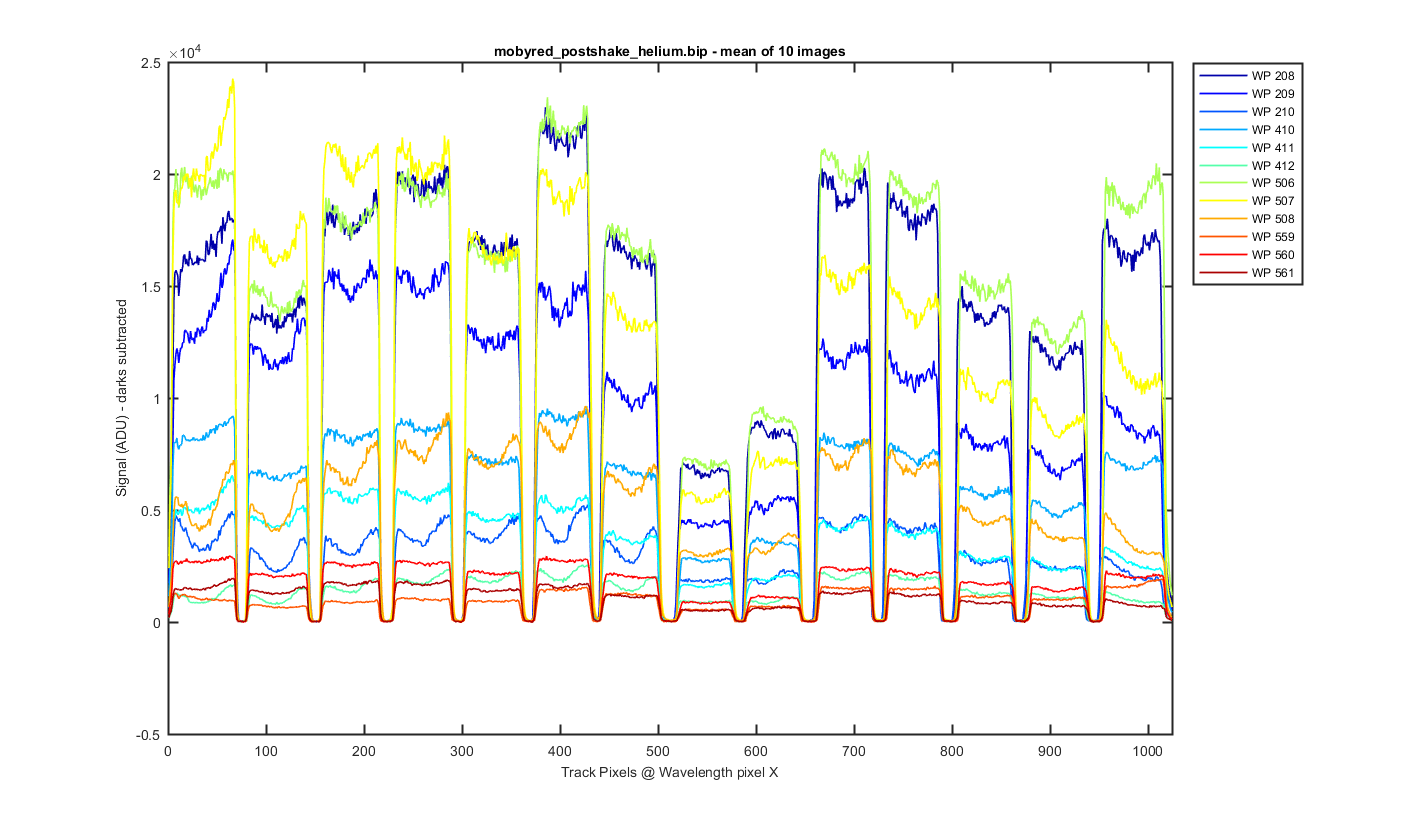
Below are my graphs of the helium.bip file. The file contains 10 dark images at 0.1 sec Note some graphs are dark corrected and some are not so check the axis labels to know what you are looking at.
I should also note that the darks used to subtract had some faint helium lines in them. The helium lines in the darks where very small and are not likely to significanly effect the data.
I took the 10 images and meaned them to get the surface plot below.
Figure 1
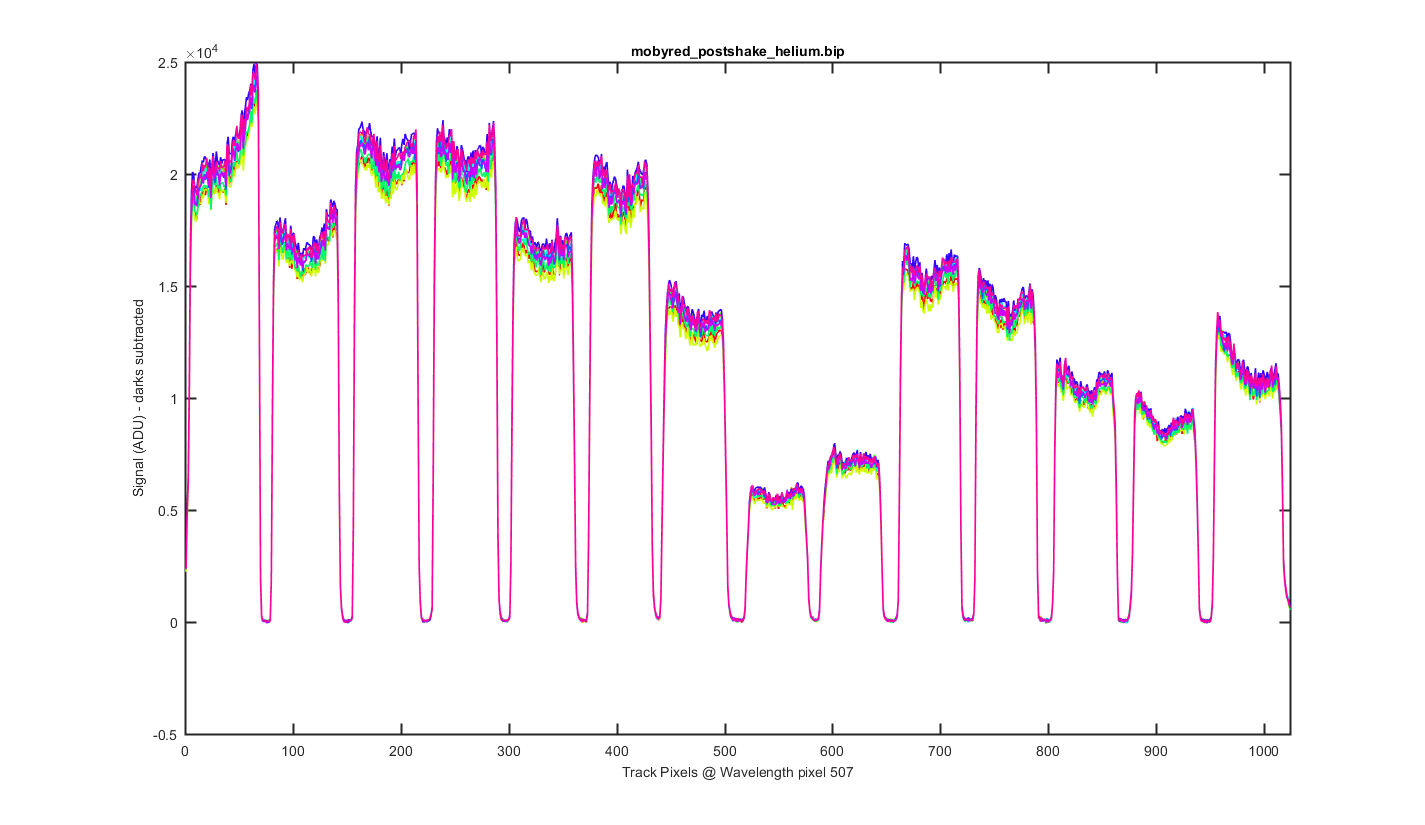
This is a cross section through the tracks at wavelength pixel 536, with one line for each of the 10 images. The tracks and their shapes look really stable.
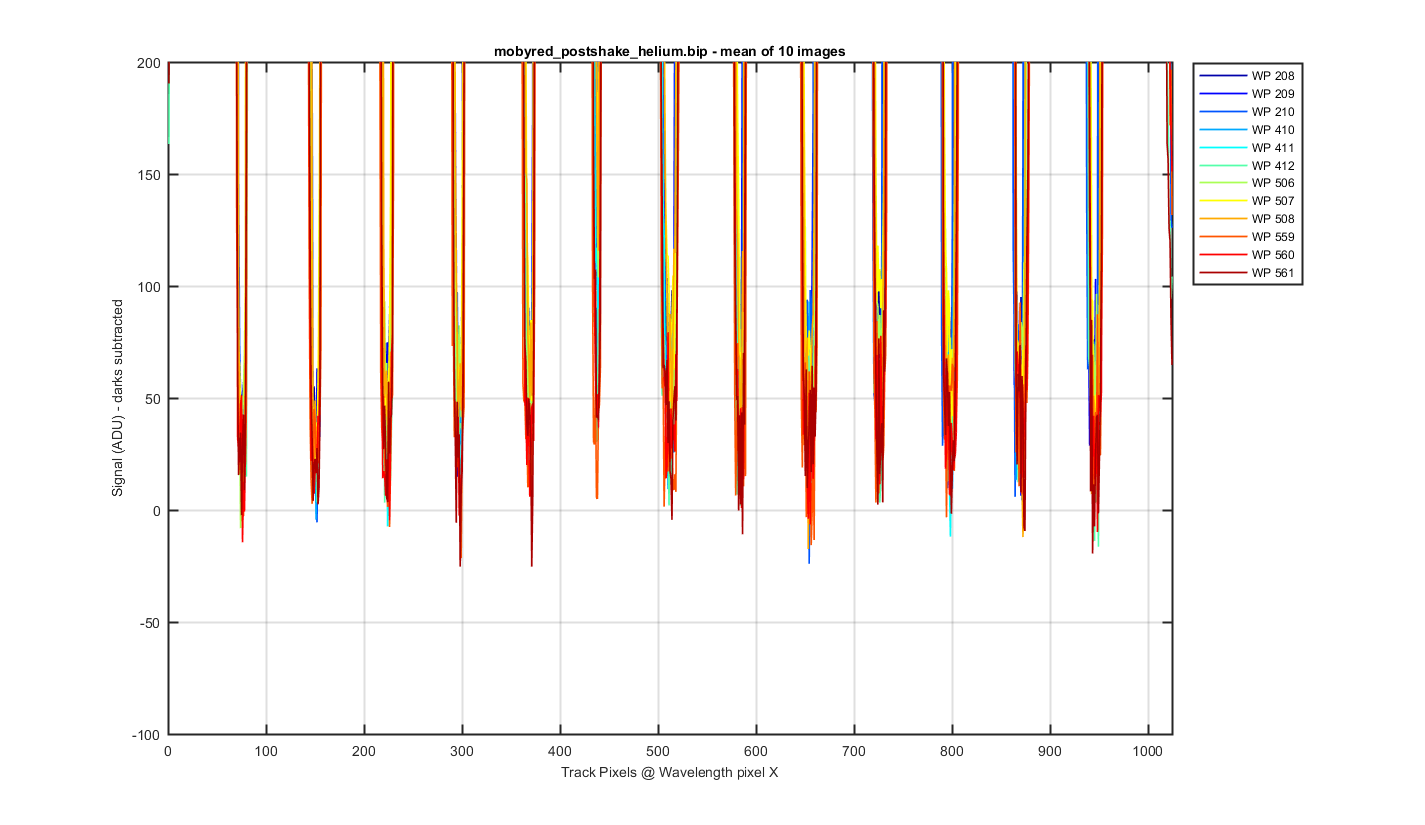
Figure 2
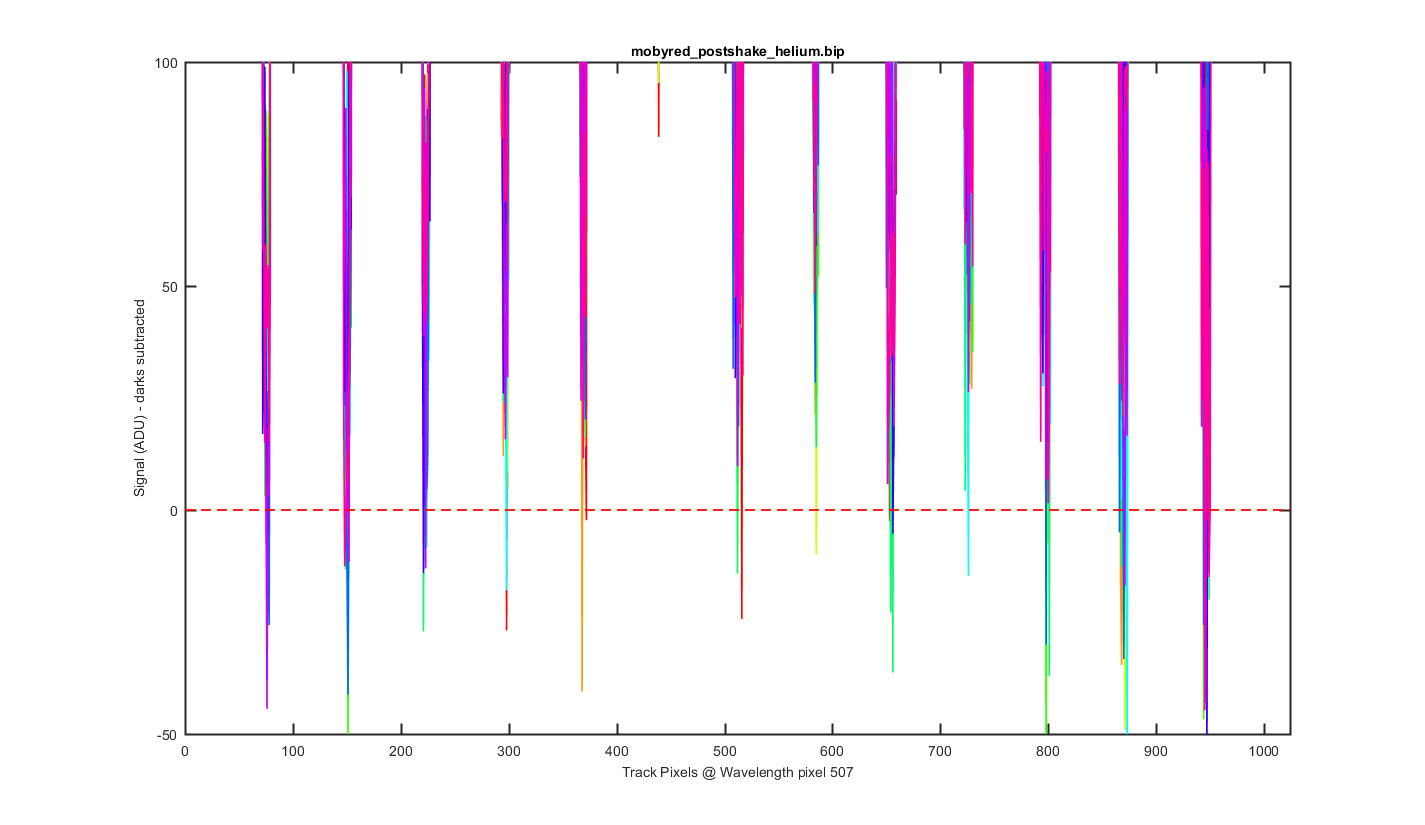
Same as the previous graph but zoomed into the bottom to see the level of the darks between the tracks.
Figure 3
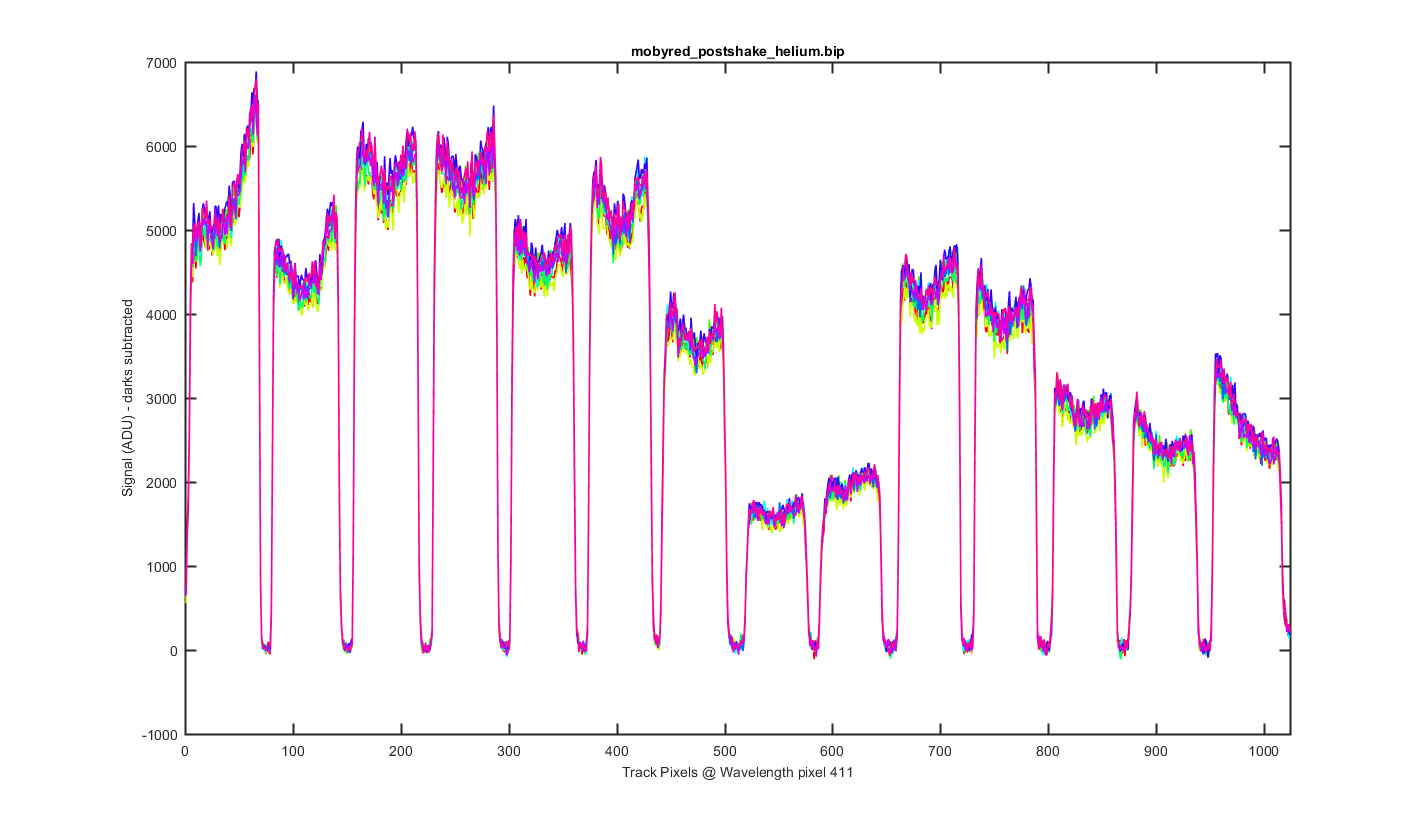
Same as figure 2 but for Wavelength pixel 440.
Figure 4
Again this is the mean image with slices thought the image at different wavelength pixels. The pixels choosen are where the helium peaks are and +- pixel pixel around them.
Figure 5
Same as figure 5 but zoomed to the bottom so you can see the darks between the tracks.
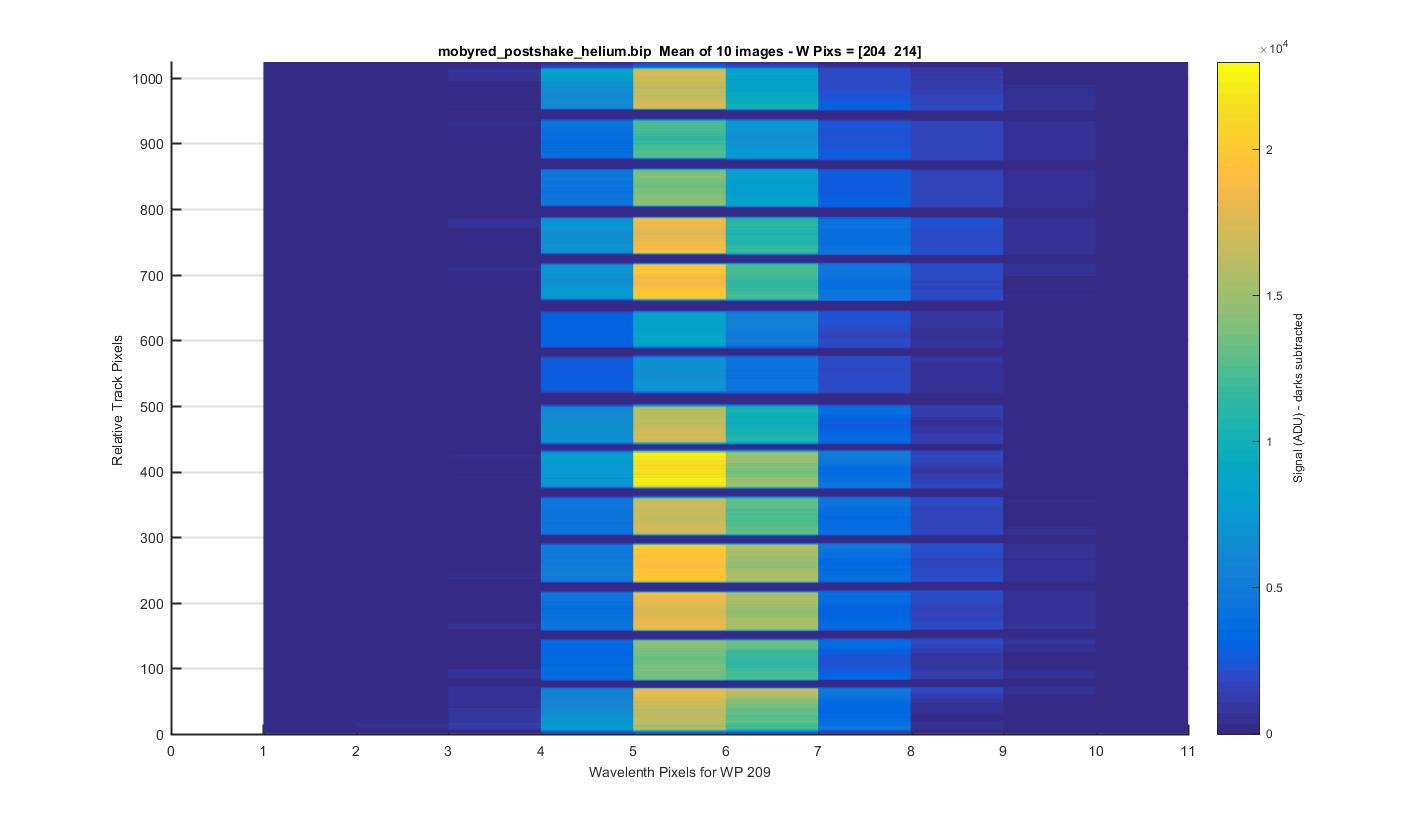
Figure 6
Helium Peak 1 (at pix 209): The same surface plot but showing how individual helium peaks line up from track to track. Looks pretty good!
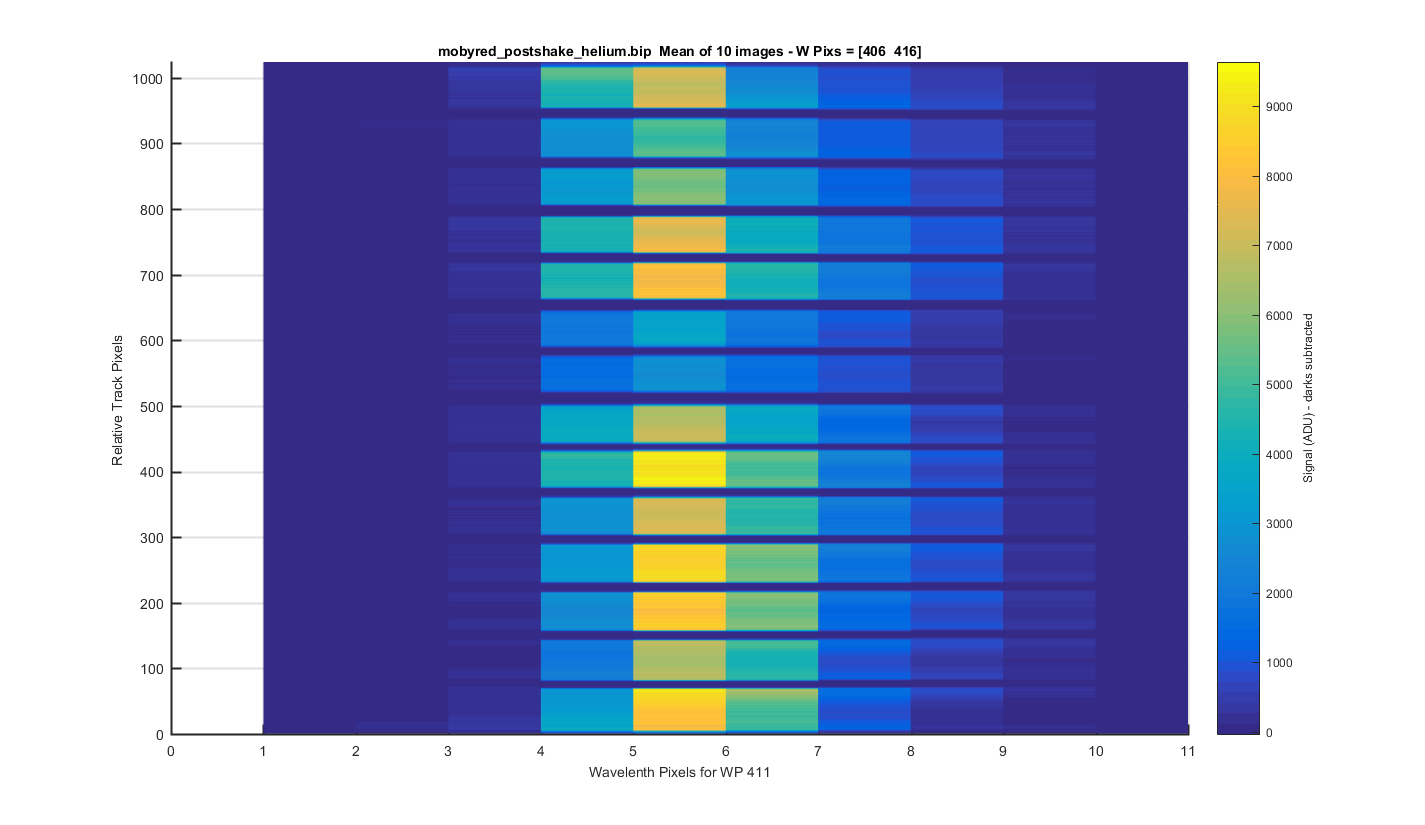
Figure 7
Helium Peak 2 (at pix 411): The same surface plot but showing how individual helium peaks line up from track to track. Looks pretty good!
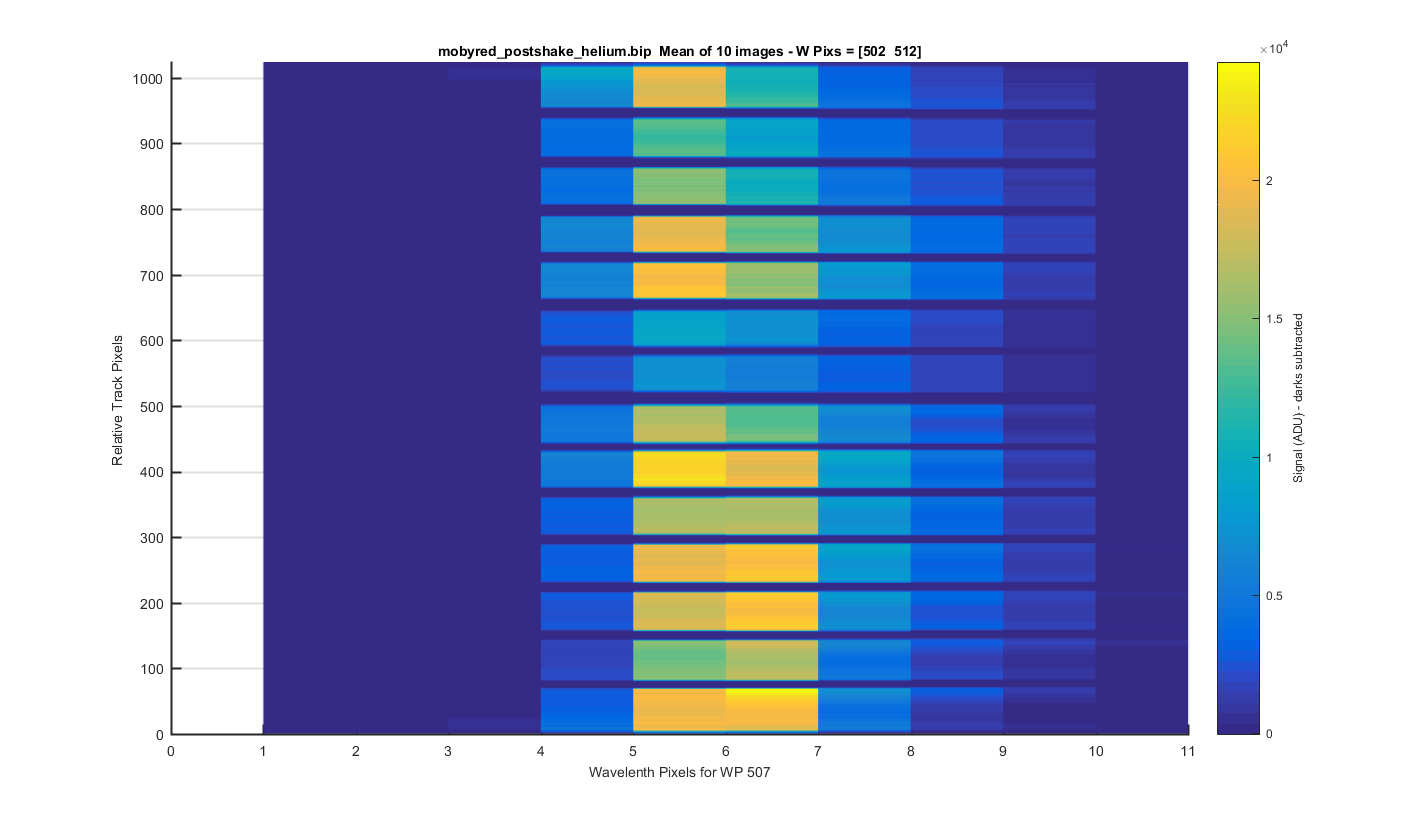
Figure 8
Helium Peak 3 (at pix 507): The same surface plot but showing how individual helium peaks line up from track to track. Looks pretty good!
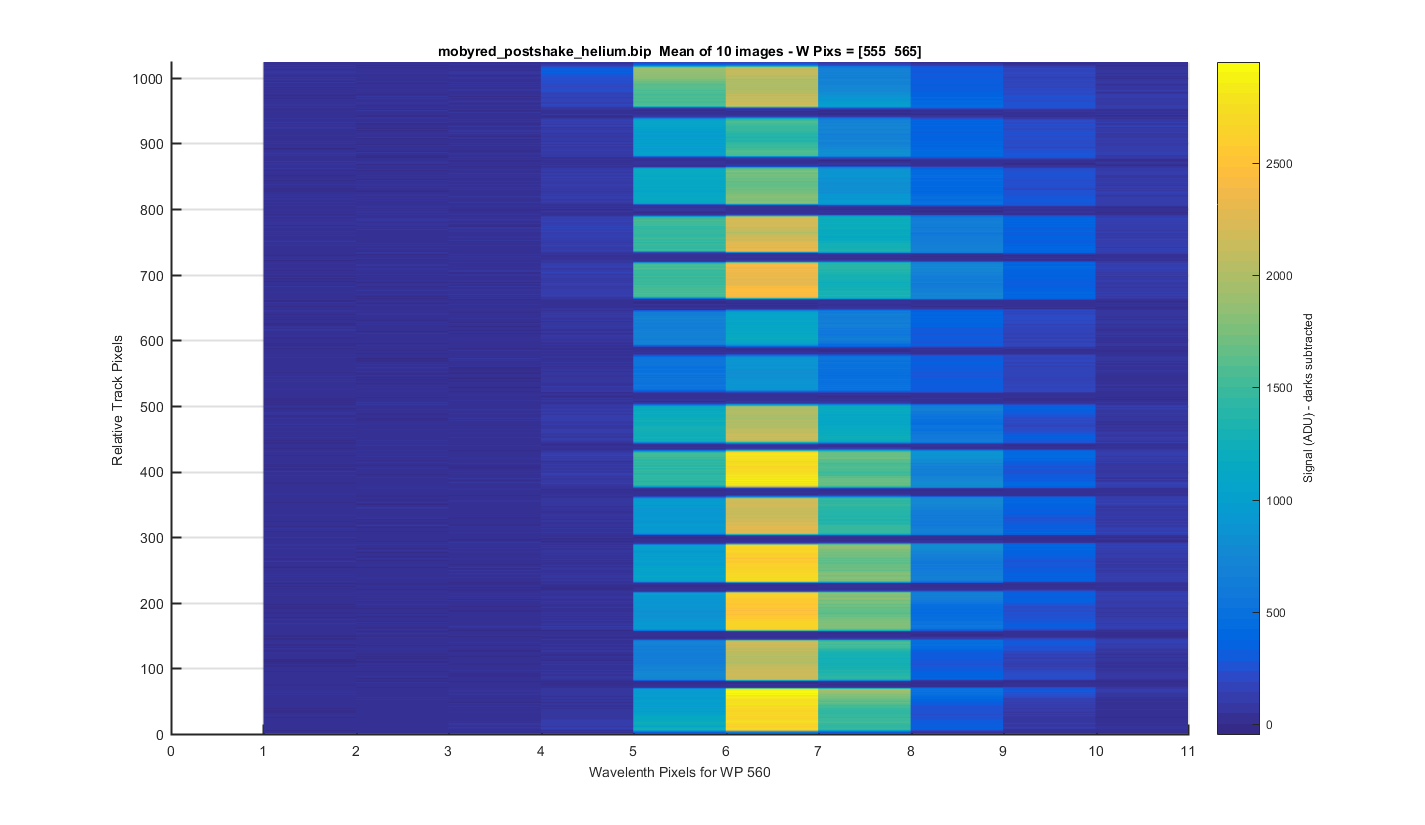
Figure 9
Helium Peak 4 (at pix 560): The same surface plot but showing how individual helium peaks line up from track to track. Looks pretty good!
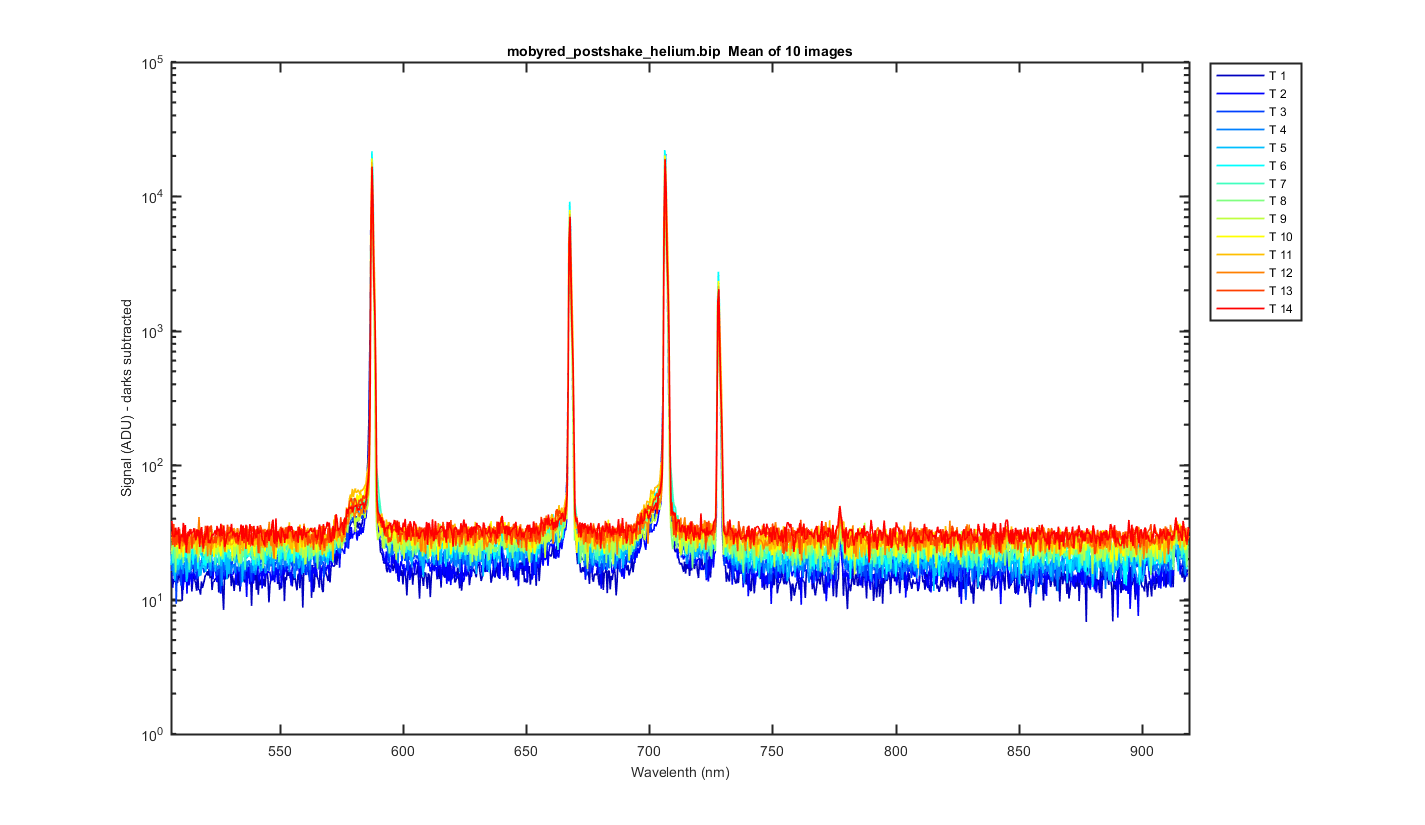
Figure 10
Mean image binned by track, the x-axis is wavelength pixels.
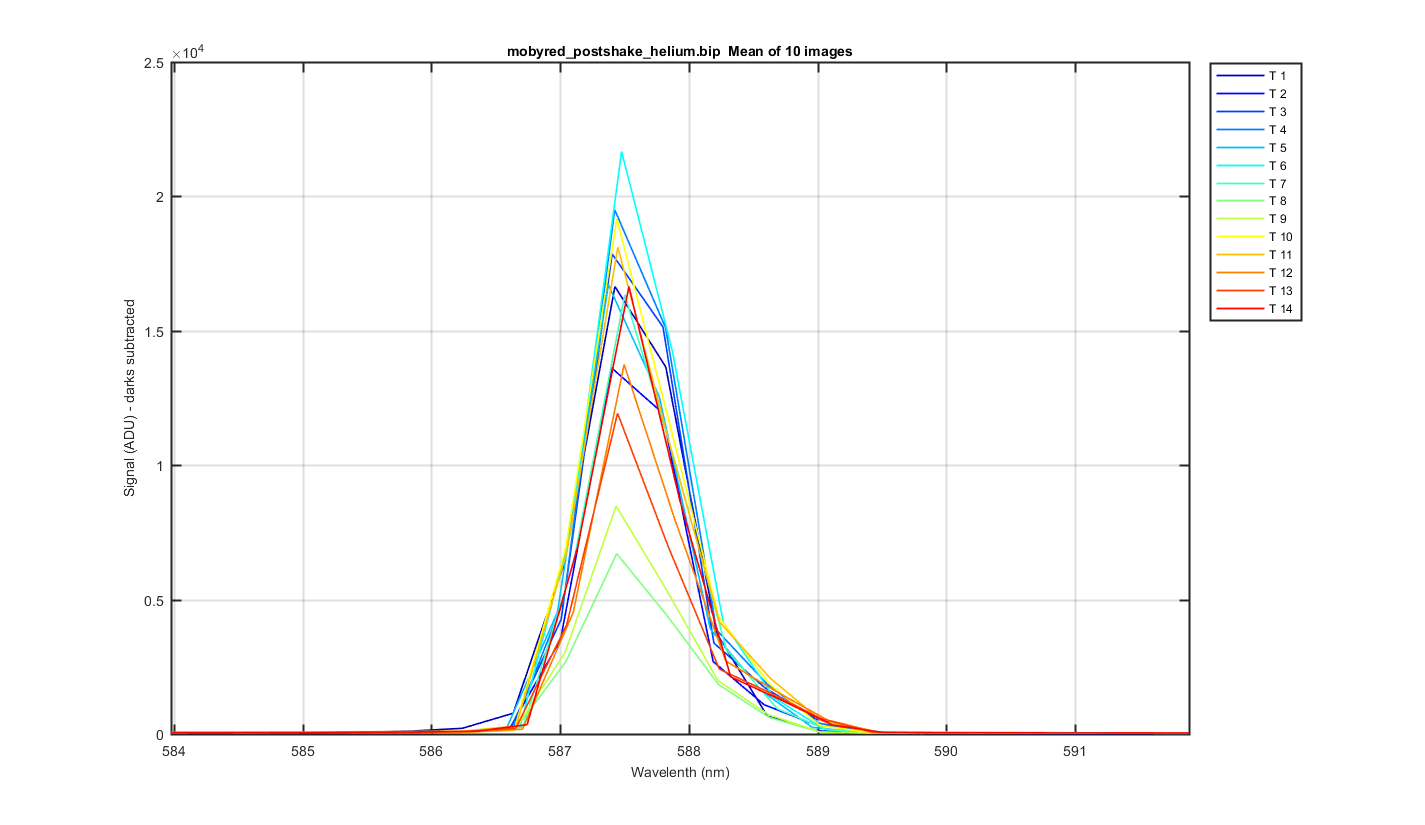
Figure 11
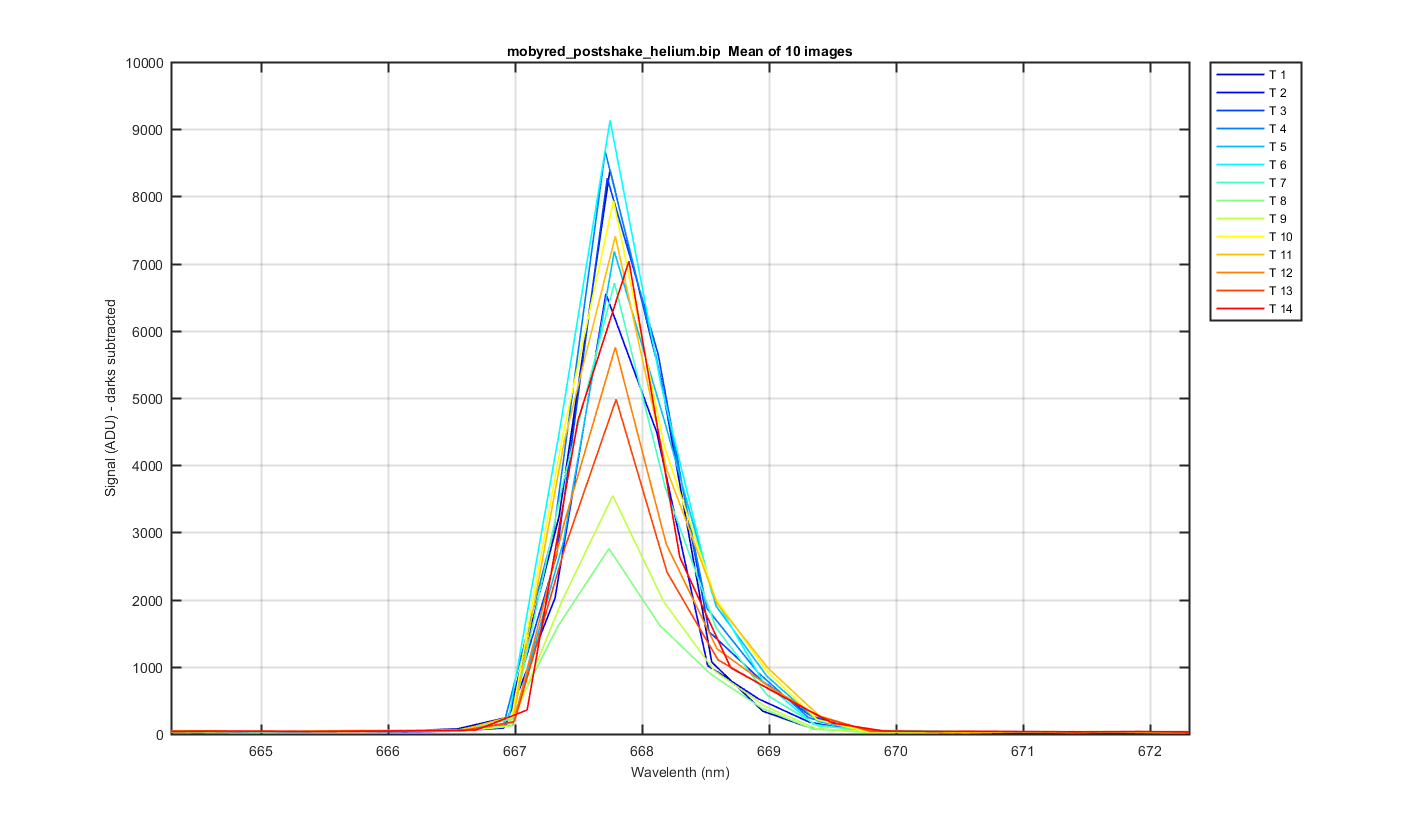
Close up of one of the helium peaks
Figure 12
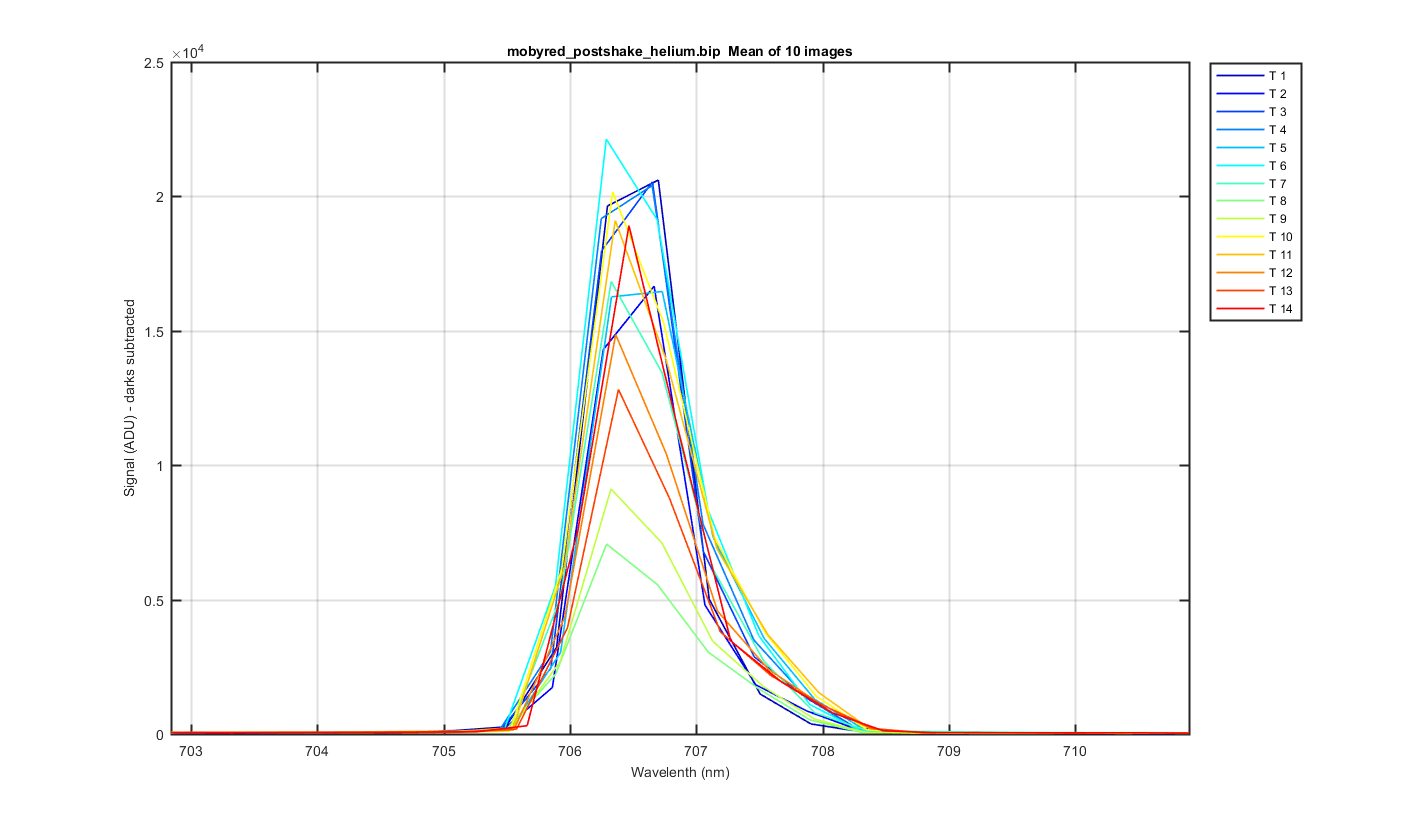
Close up of one of the helium peaks
Figure 13
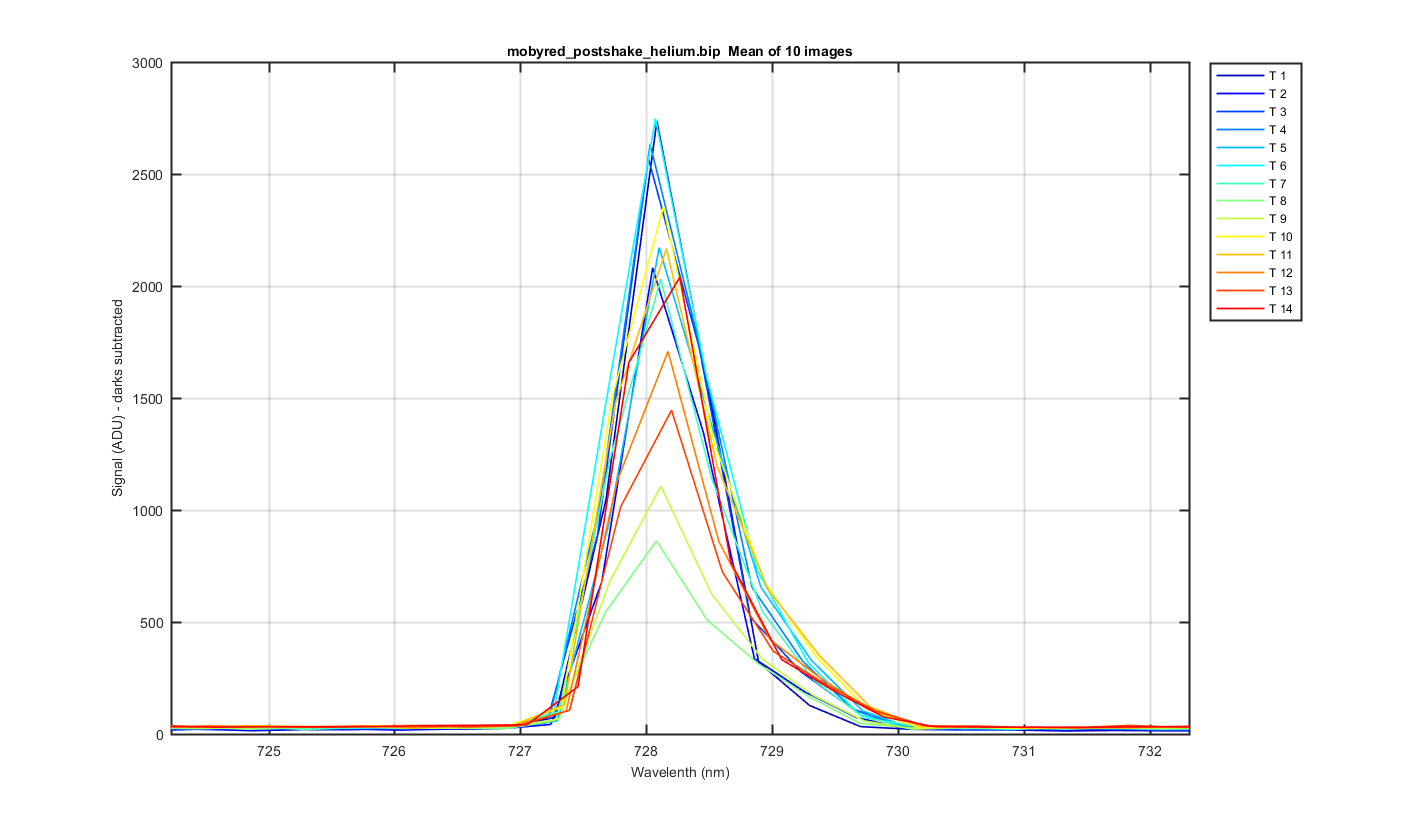
Close up of one of the helium peaks
Figure 14
Close up of one of the helium peaks
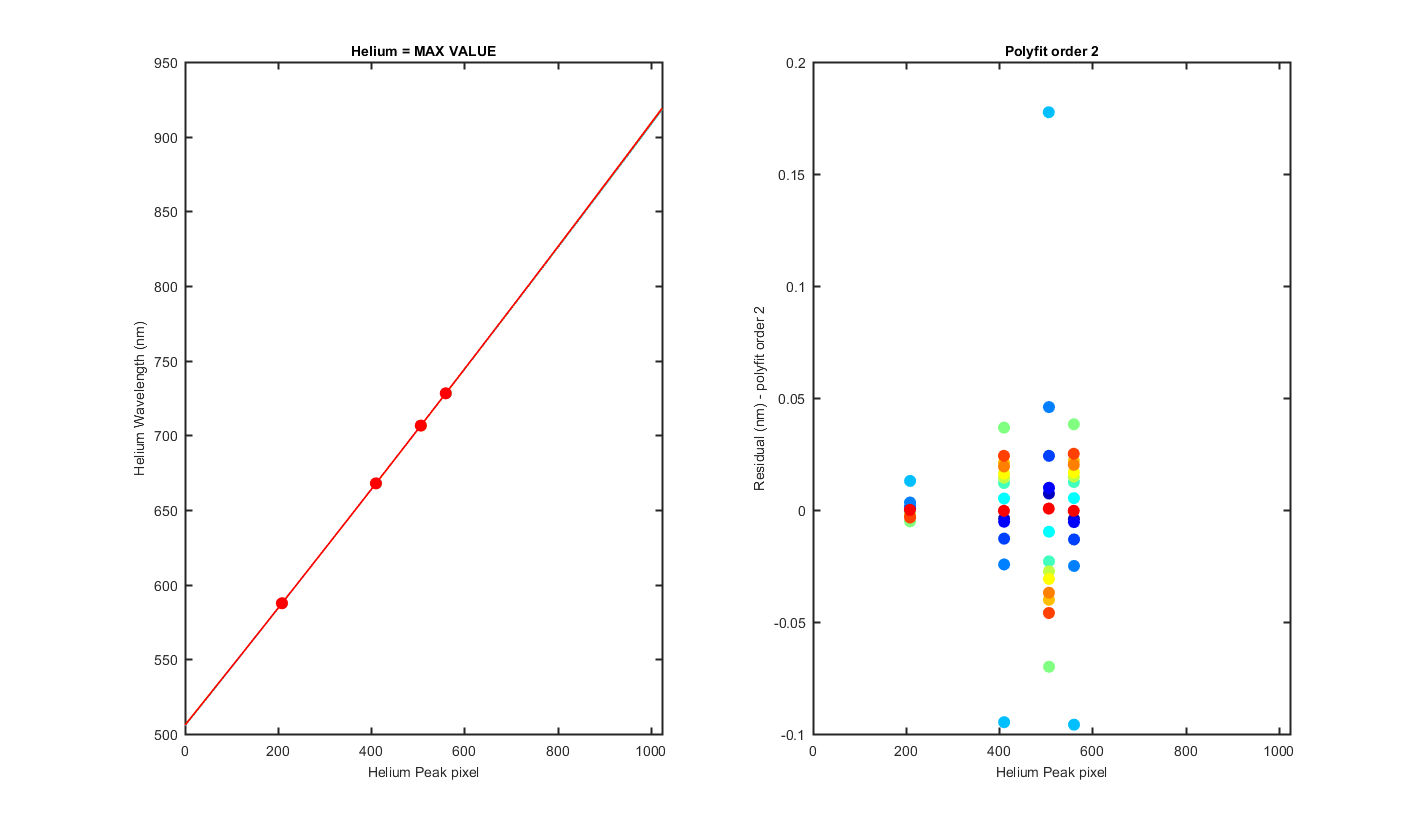
Figure 15
MY VERY ROUGH GUESS AT A WAVELENGTH CAL!!! THIS ASSUMES I GUESS CORRECTLY WHICH PEAKS WHERE WHICH HELIUM LINES. Originally I had ~ 506.51, 921.42, but after Mikes email I drop the peak at 683 and changed from 2nd order to linear. Mikes says "pix #1 = 504.70, pix #1024 = 911.97, with pixel separation = 0.40 nm"
Track, Min,    Max,     diff,    P
    1, 506.22, 918.44,  0.40   0.000013 0.389576
    2, 506.20, 918.42,  0.40   0.000013 0.389528
    3, 506.12, 917.98,  0.40   0.000012 0.390127
    4, 506.27, 918.40,  0.40   0.000013 0.389271
    5, 505.95, 917.99,  0.40   0.000012 0.390916
    6, 506.37, 918.54,  0.40   0.000014 0.389014
    7, 506.38, 918.61,  0.40   0.000014 0.389054
    8, 506.29, 918.56,  0.40   0.000013 0.389231
    9, 506.22, 918.51,  0.40   0.000013 0.389632
   10, 506.24, 918.65,  0.40   0.000013 0.389468
   11, 506.25, 918.73,  0.40   0.000013 0.389450
   12, 506.43, 919.04,  0.40   0.000014 0.388631
   13, 506.29, 919.02,  0.40   0.000014 0.389162
   14, 506.29, 918.75,  0.40   0.000013 0.389735
Figure 16
  Track = The Resonon Track number
Lwave = Laser Wavelength
Lpix1 = Laser Pixel found using the max value of the track
Lpix2 = Laser Pixel found using mygaussfit to fit the laser peak
| Track | Lwave | Lpix1 | Lpix2 |
|---|---|---|---|
| 1 | 587.56 | 208.00 | 208.34 |
| 1 | 667.82 | 410.00 | 410.17 |
| 1 | 706.52 | 507.00 | 506.53 |
| 1 | 728.13 | 560.00 | 560.13 |
| 2 | 587.56 | 208.00 | 208.41 |
| 2 | 667.82 | 410.00 | 410.26 |
| 2 | 706.52 | 507.00 | 506.61 |
| 2 | 728.13 | 560.00 | 560.22 |
| 3 | 587.56 | 208.00 | 208.40 |
| 3 | 667.82 | 410.00 | 410.25 |
| 3 | 706.52 | 507.00 | 506.61 |
| 3 | 728.13 | 560.00 | 560.32 |
| 4 | 587.56 | 208.00 | 208.34 |
| 4 | 667.82 | 410.00 | 410.32 |
| 4 | 706.52 | 507.00 | 506.56 |
| 4 | 728.13 | 560.00 | 560.32 |
| 5 | 587.56 | 208.00 | 208.44 |
| 5 | 667.82 | 410.00 | 410.32 |
| 5 | 706.52 | 507.00 | 506.03 |
| 5 | 728.13 | 560.00 | 560.32 |
| 6 | 587.56 | 208.00 | 208.22 |
| 6 | 667.82 | 410.00 | 410.15 |
| 6 | 706.52 | 506.00 | 506.60 |
| 6 | 728.13 | 560.00 | 560.14 |
| 7 | 587.56 | 208.00 | 208.16 |
| 7 | 667.82 | 410.00 | 410.05 |
| 7 | 706.52 | 506.00 | 506.54 |
| 7 | 728.13 | 560.00 | 560.02 |
| 8 | 587.56 | 208.00 | 208.32 |
| 8 | 667.82 | 410.00 | 410.09 |
| 8 | 706.52 | 506.00 | 506.74 |
| 8 | 728.13 | 560.00 | 560.04 |
| 9 | 587.56 | 208.00 | 208.33 |
| 9 | 667.82 | 410.00 | 410.07 |
| 9 | 706.52 | 506.00 | 506.55 |
| 9 | 728.13 | 560.00 | 560.01 |
| 10 | 587.56 | 208.00 | 208.31 |
| 10 | 667.82 | 410.00 | 410.06 |
| 10 | 706.52 | 506.00 | 506.53 |
| 10 | 728.13 | 560.00 | 559.95 |
| 11 | 587.56 | 208.00 | 208.30 |
| 11 | 667.82 | 410.00 | 410.01 |
| 11 | 706.52 | 506.00 | 506.50 |
| 11 | 728.13 | 560.00 | 559.88 |
| 12 | 587.56 | 208.00 | 208.17 |
| 12 | 667.82 | 410.00 | 410.01 |
| 12 | 706.52 | 506.00 | 506.48 |
| 12 | 728.13 | 560.00 | 559.85 |
| 13 | 587.56 | 208.00 | 208.30 |
| 13 | 667.82 | 410.00 | 409.98 |
| 13 | 706.52 | 506.00 | 506.45 |
| 13 | 728.13 | 560.00 | 559.77 |
| 14 | 587.56 | 208.00 | 208.07 |
| 14 | 667.82 | 410.00 | 409.79 |
| 14 | 706.52 | 506.00 | 506.13 |
| 14 | 728.13 | 560.00 | 559.67 |