REVISION DATE: 24-Apr-2015 17:03:11
Mike and I noticed in the intial data that track 1 data collected at low integration times the saddle shaped tracks are more pointed (all at Gain 1). The day 1 laser data shows this. These data are at different wavelengths so take that into account. There is a logged and linear version of the day 1 graph. In the logged graph you can see a down turn on track 1 on the top of the tracks. It can been seen in the linear version too. Notice that as the integration time increase (depending on wavelength) the track can get more saddle shaped,
The last graph is the day 2 data, all tracks are on and the source is a Oriel Lamp. And had even lower integration times. You can really see the down turn on track 1 and some on track 2 and 3. All the day 1 data are dark subtracted and the day 2 data are background subtracted. I dont see any problems with the darks or back grounds to explain this.
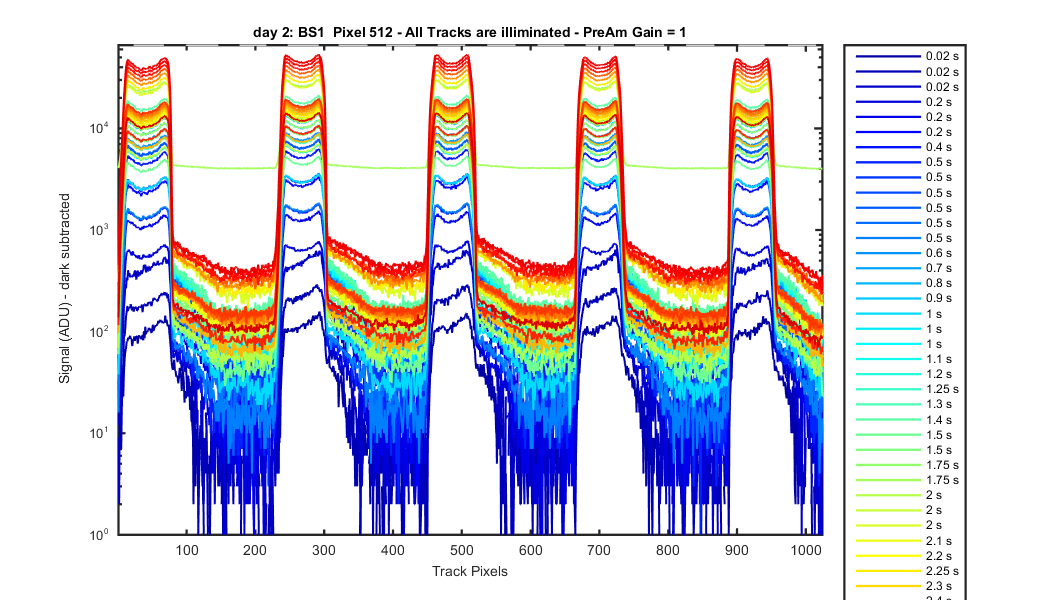
The day 3 data shows the same effect but now you can see it on all the tracks. Only 5 tracks are illuminated. My guess is the large about of cross track light is changing the shapes of the track. This would explain why when all tracks are illumiated only track 1 shows the problem to a large degree.
Figure 1
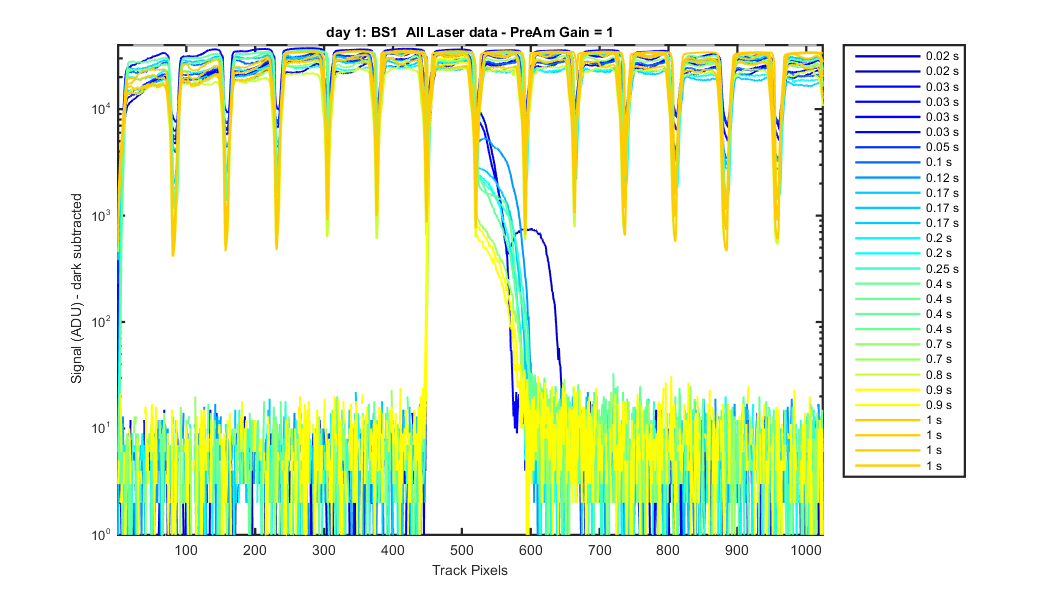
Figure 2
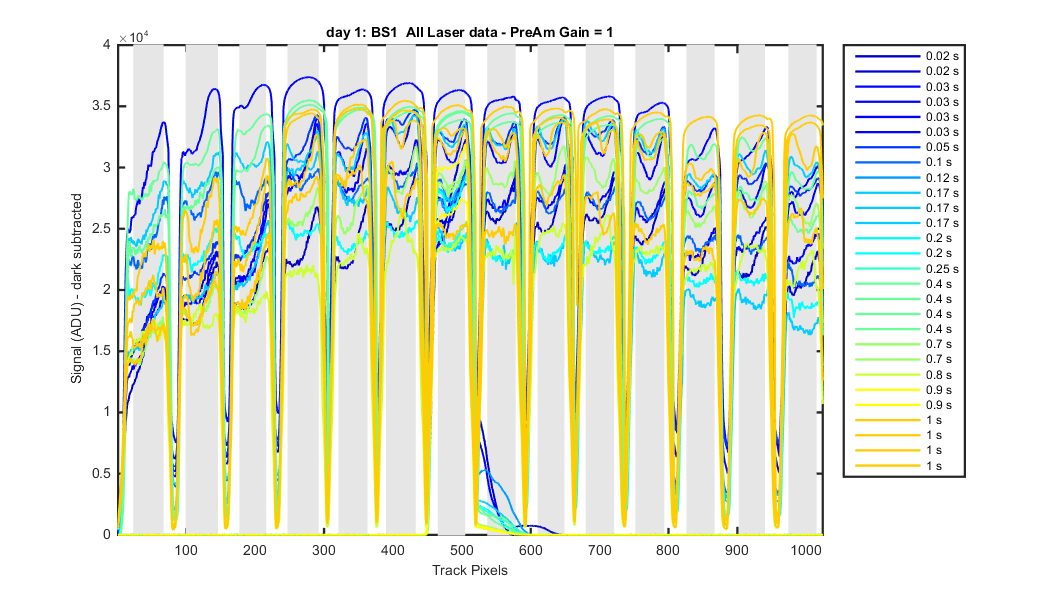
Figure 3
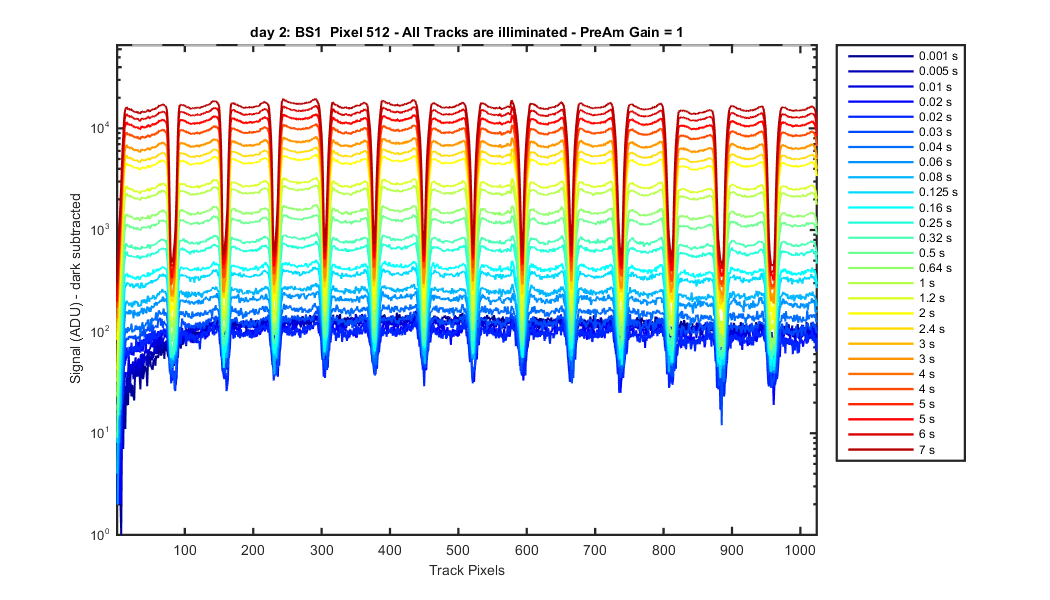
Figure 4