REVISION DATE: 14-Apr-2015 16:09:55
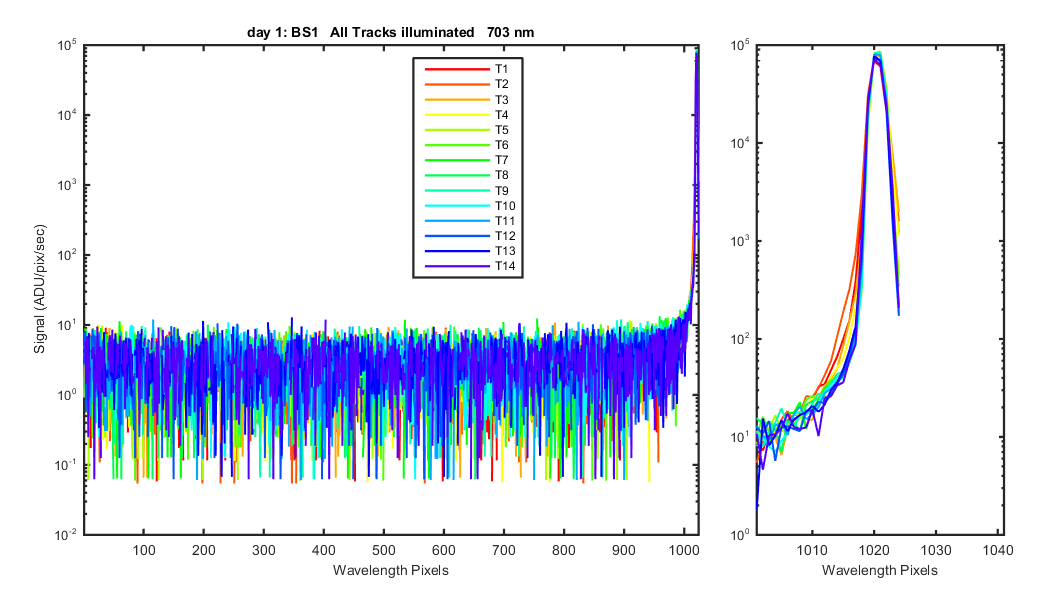
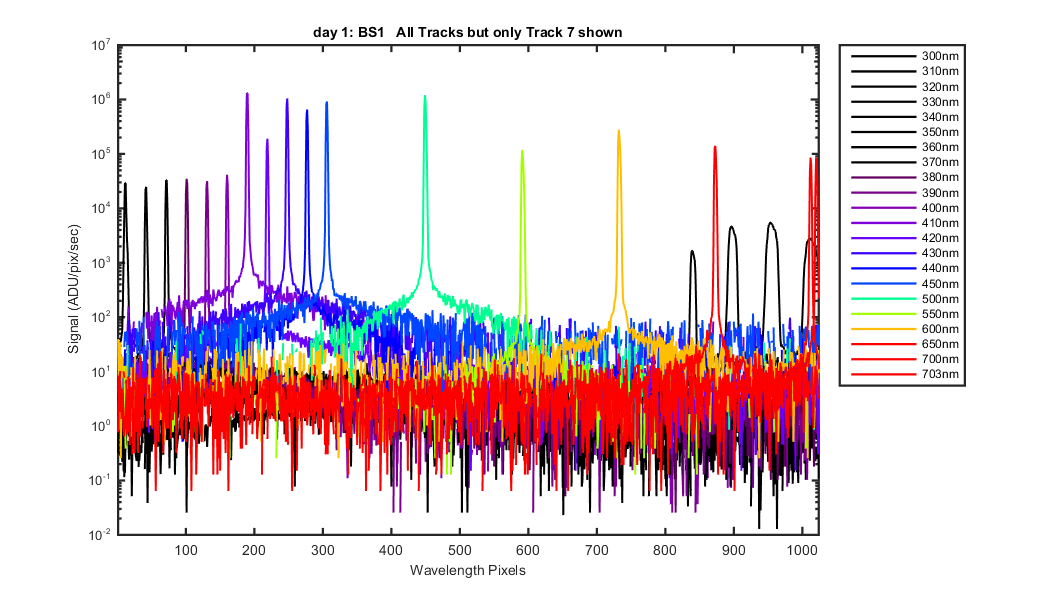
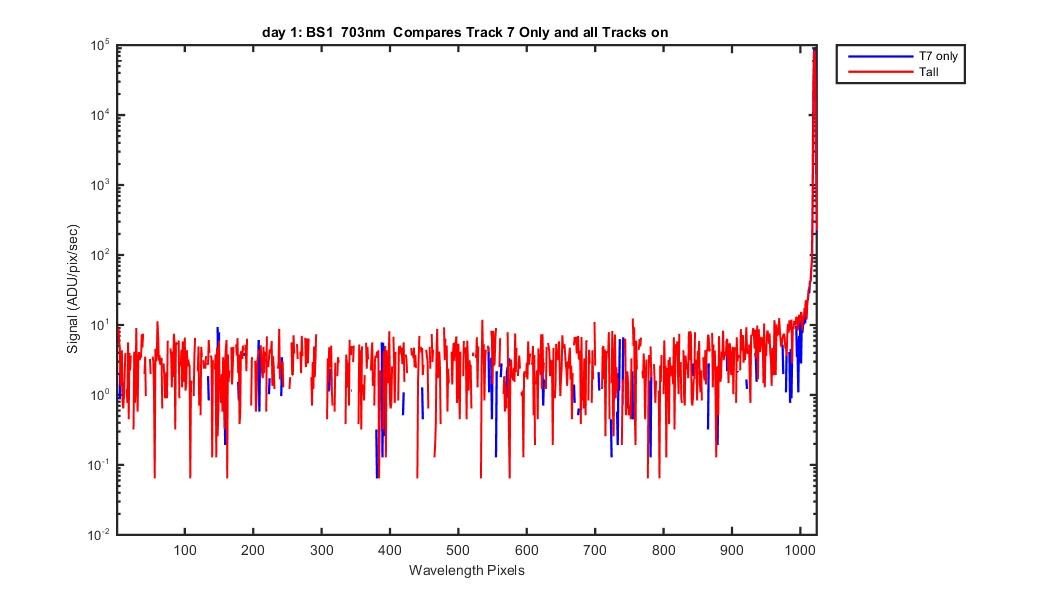
This shows the laser data collected by Mike on day 1. Data was collected with all tracks on and with only track 7 on. Also note that this data was collected on Preamp gain 1 which was saturating at ~35,000 ADU so much of these data sets are saturated at the laser peak. The first two graphs show these two data sets. The next graphs compare the two data sets by wavelength so you can see the effect of cross track. And the third set compares the laser data for each track (when all the tracks are on)
Looks at all the track data (track 7 only and all tracks on)Figure 1
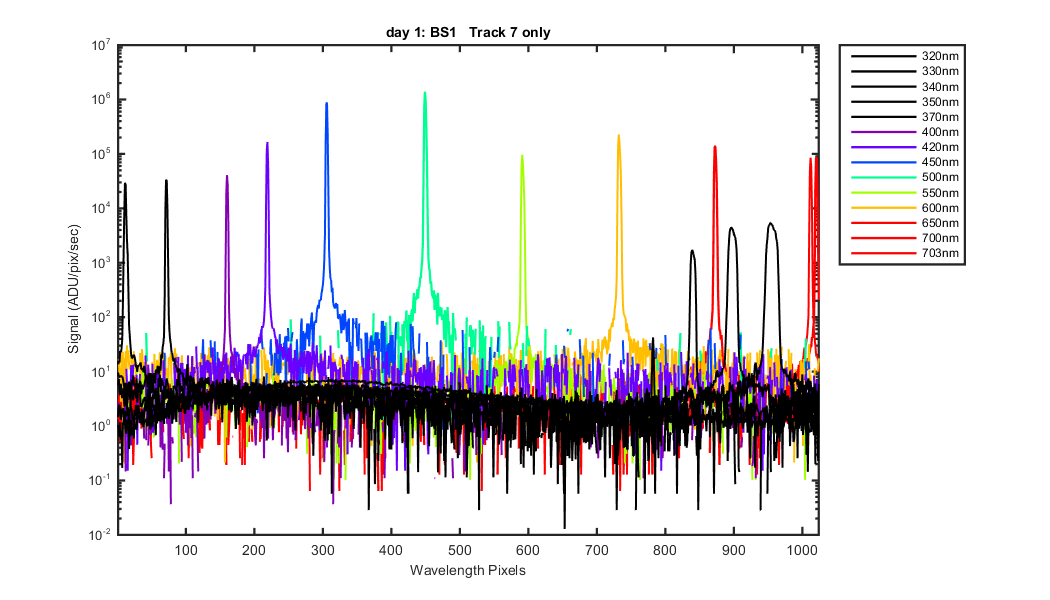
Figure 2
Compares Track 7 laser data when Track 7 is the only track on and when all the other tracks are on
Figure 1
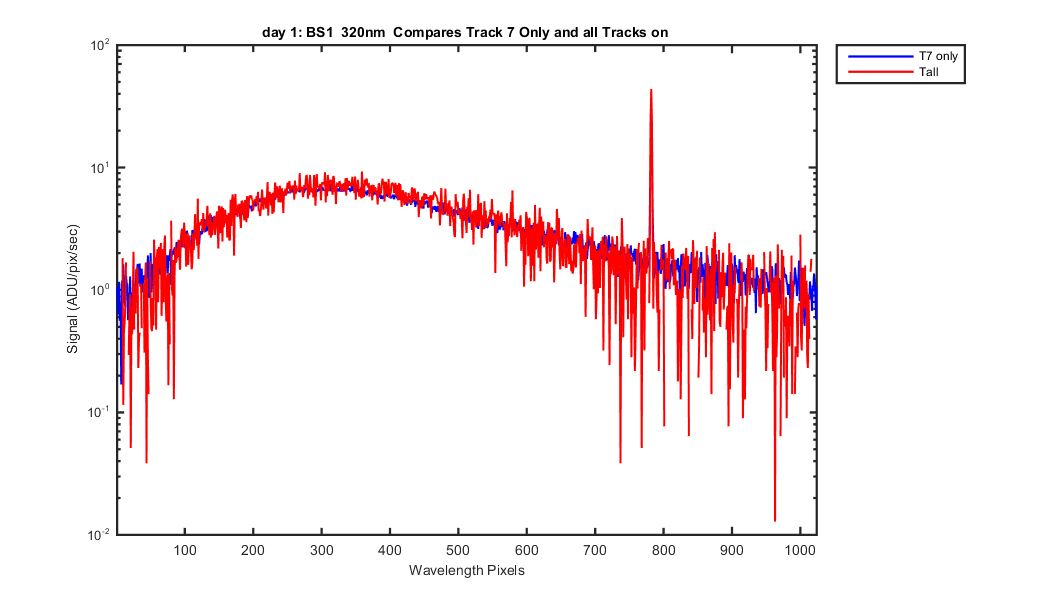
Figure 2
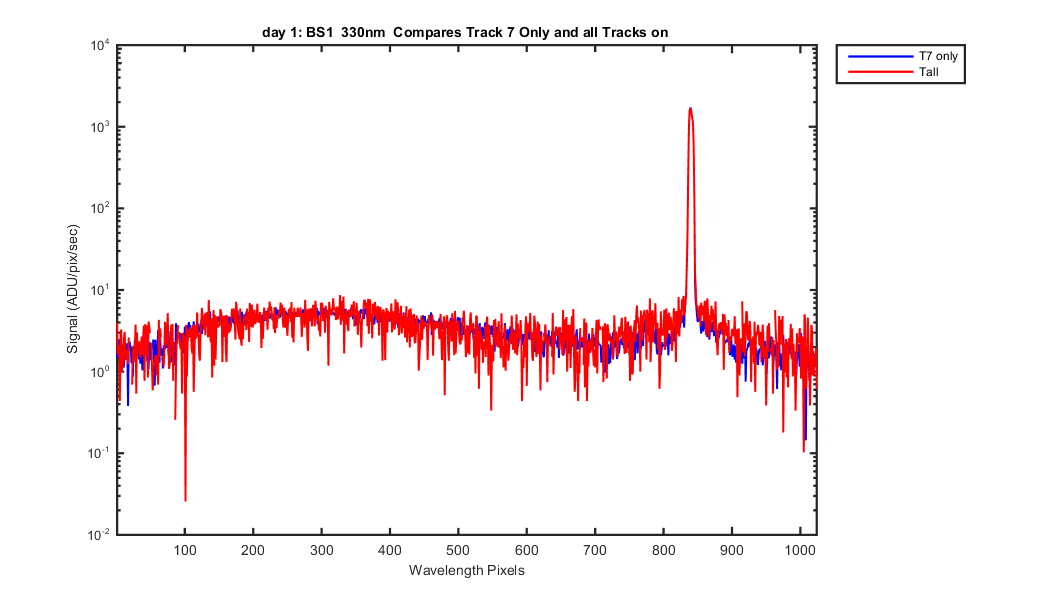
Figure 3
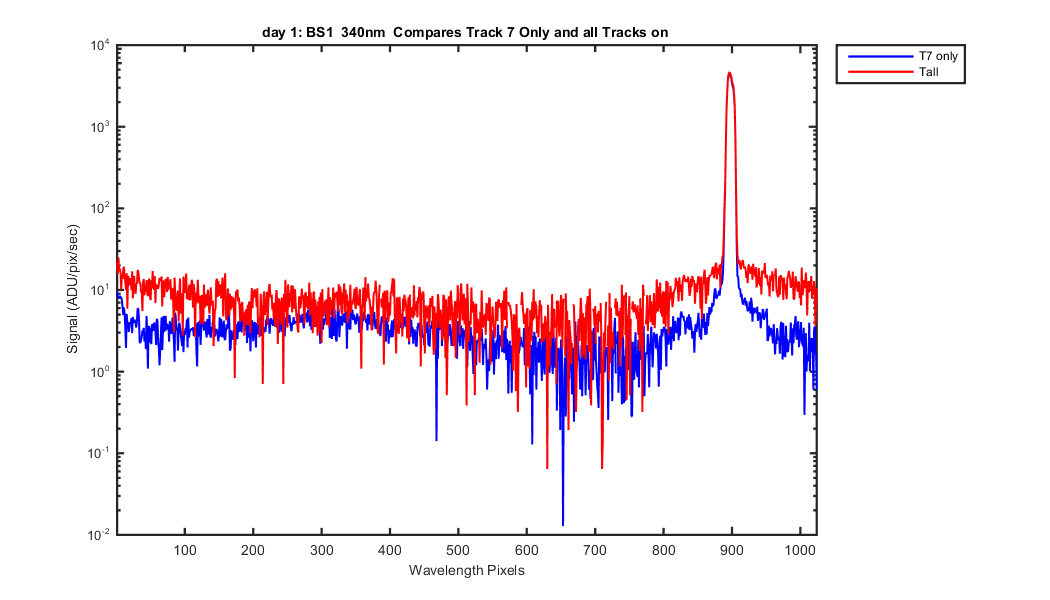
Figure 4
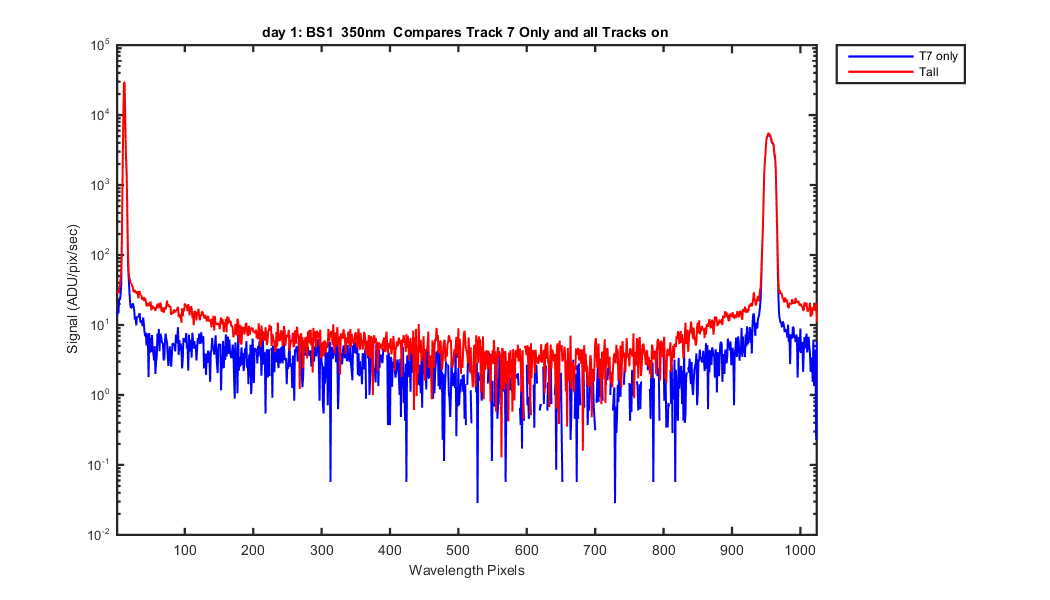
Figure 5
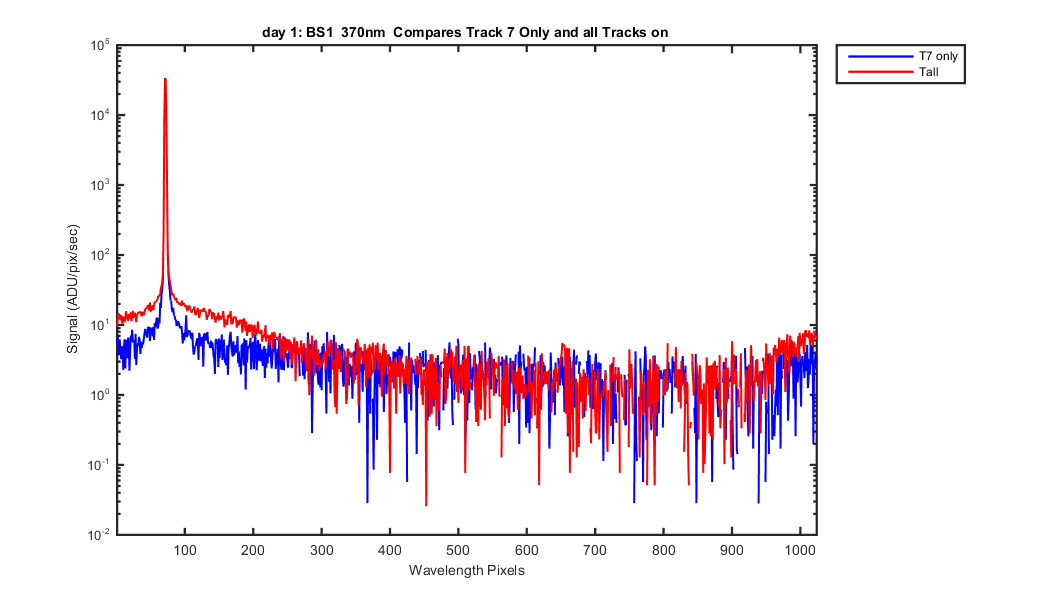
Figure 6
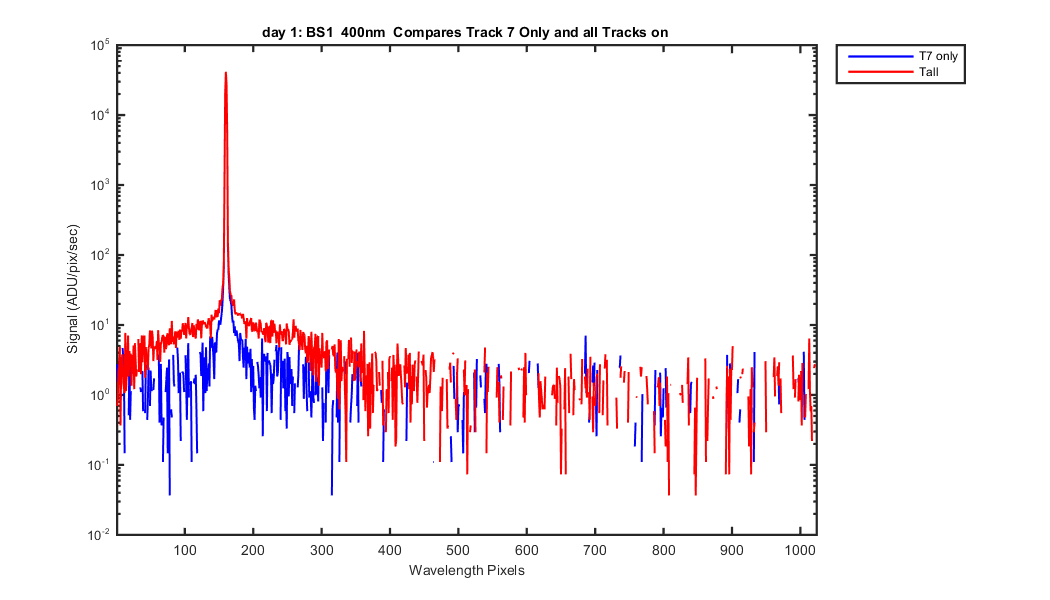
Figure 7
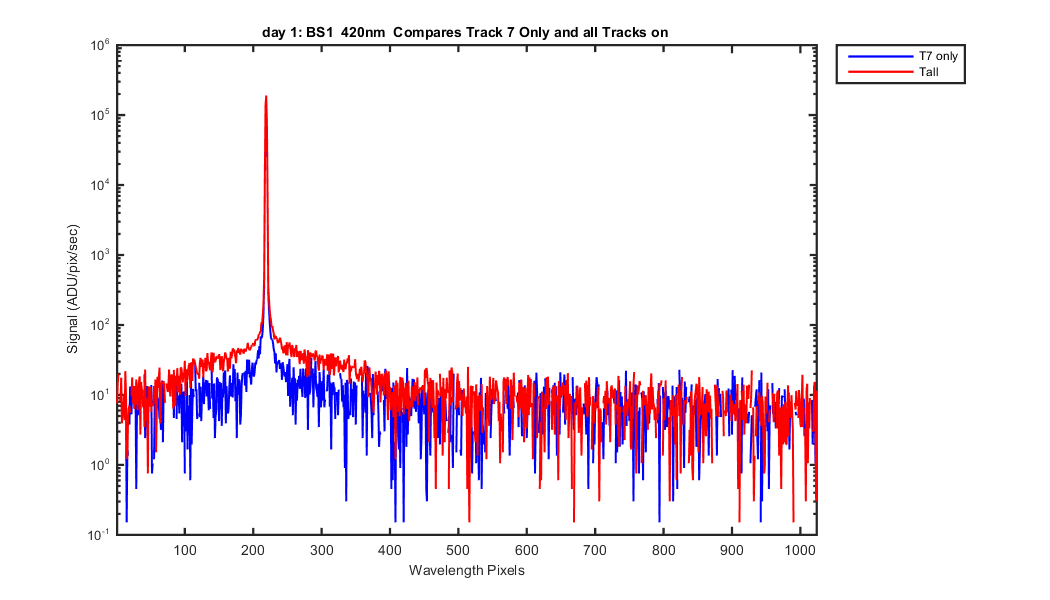
Figure 8
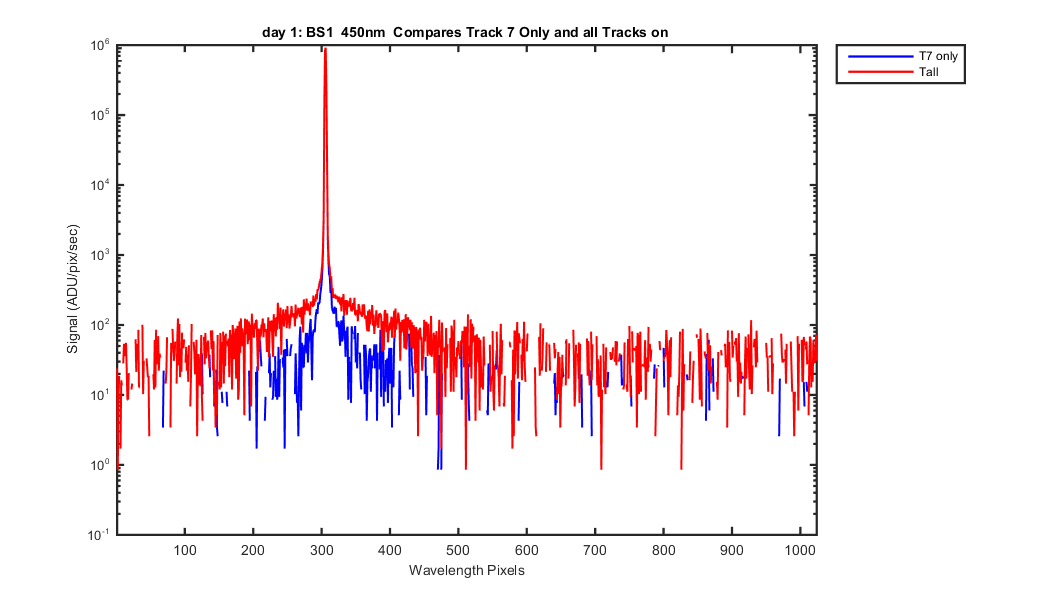
Figure 9
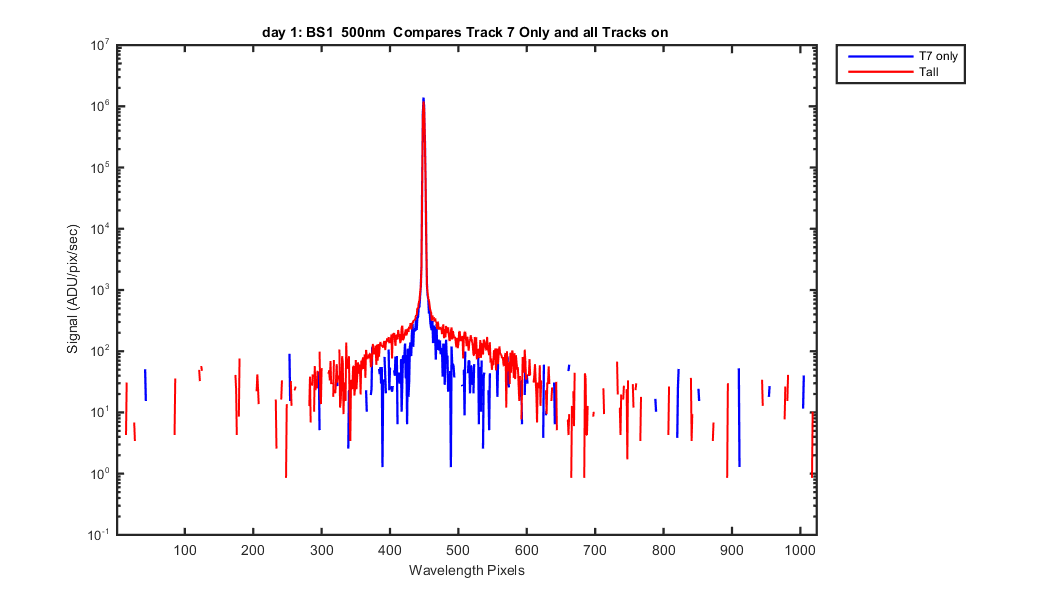
Figure 10
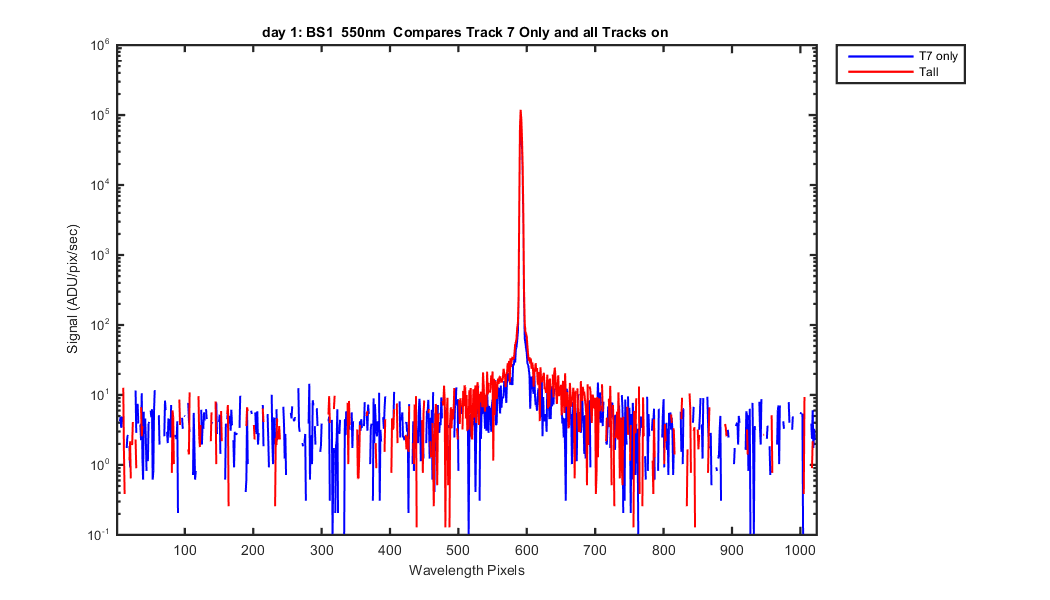
Figure 11
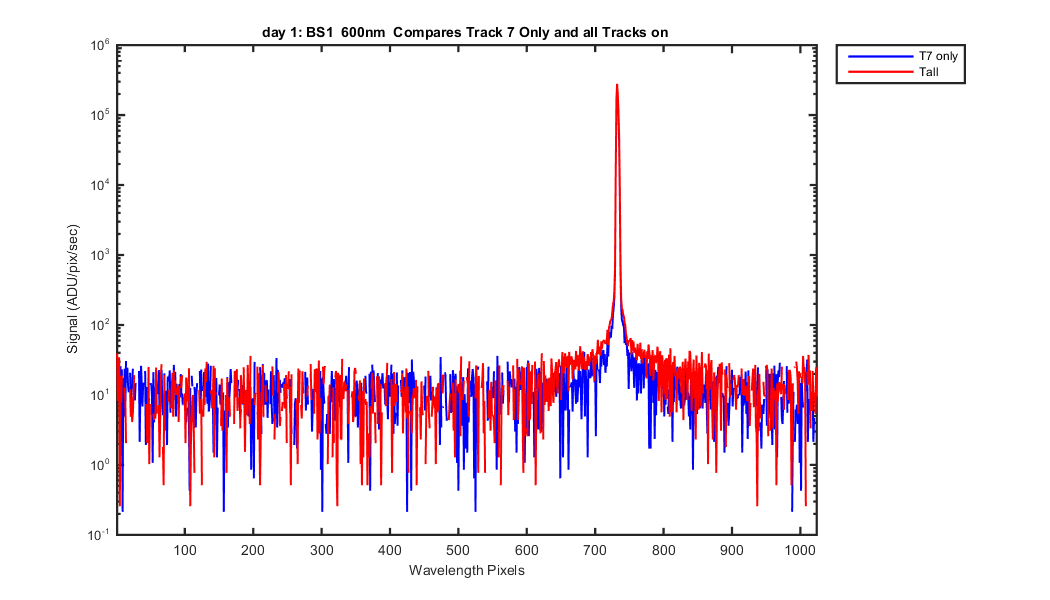
Figure 12
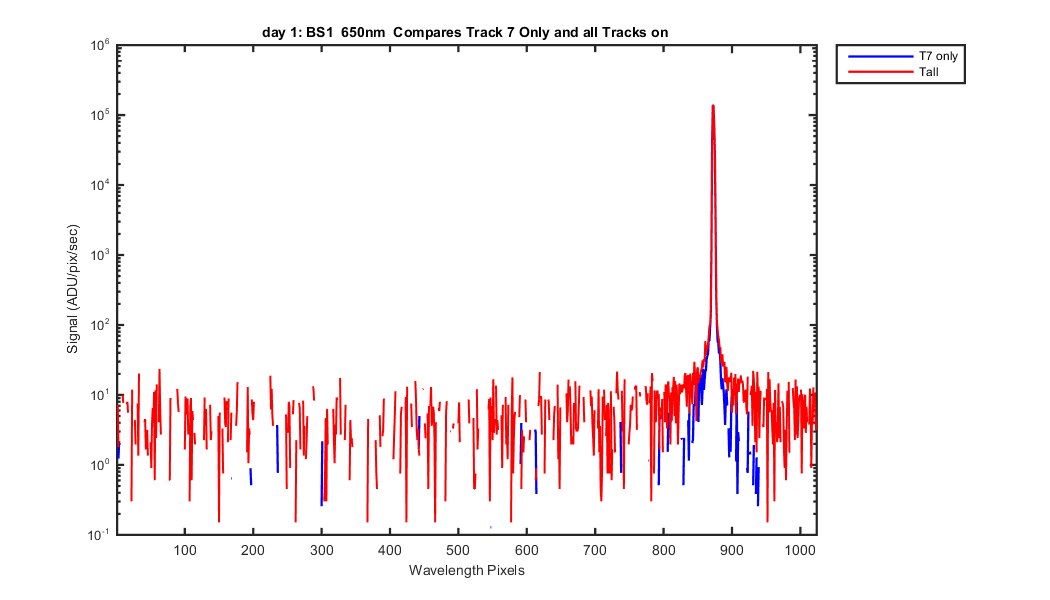
Figure 13
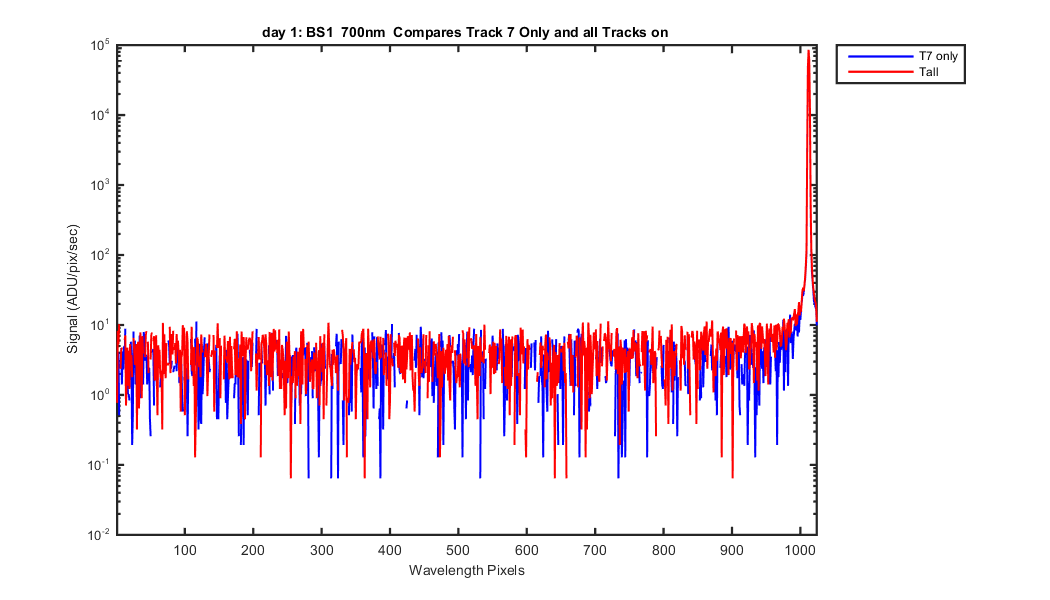
Figure 14
Compares all the tracks laser data to each other when all tracks are on
Figure 1

Figure 2
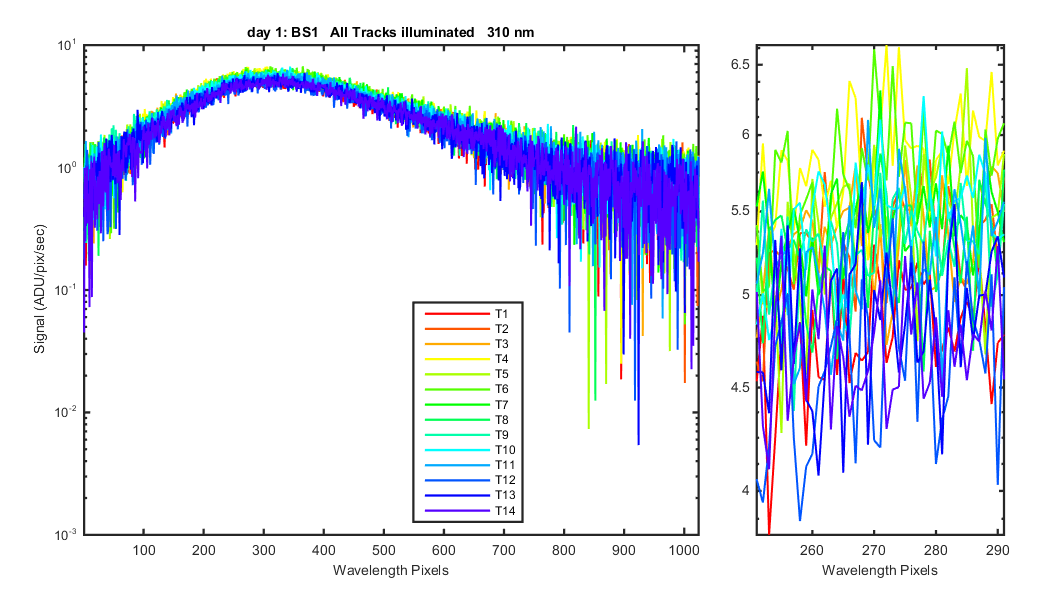
Figure 3
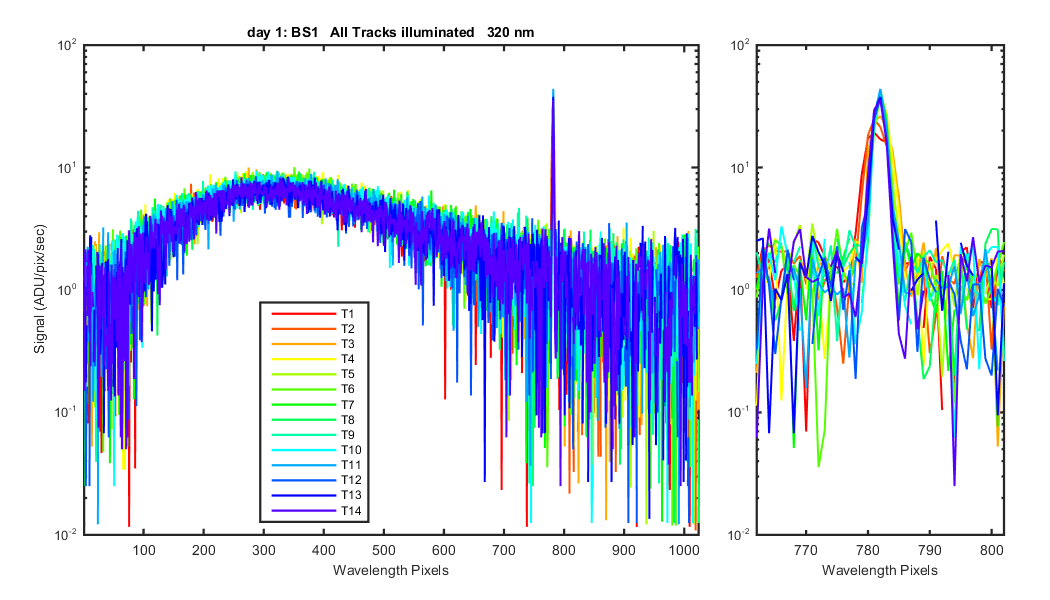
Figure 4
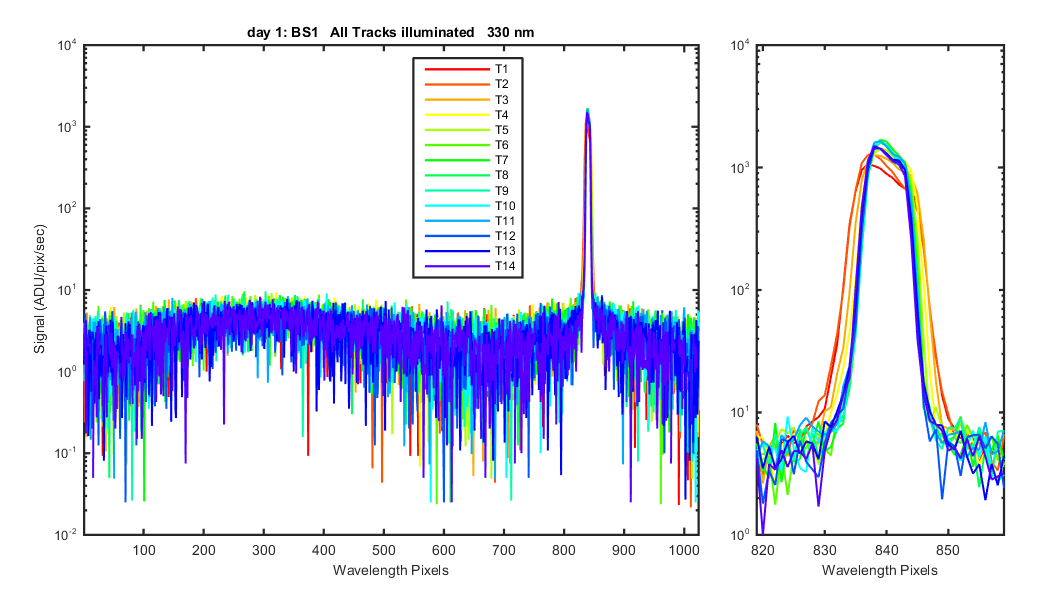
Figure 5
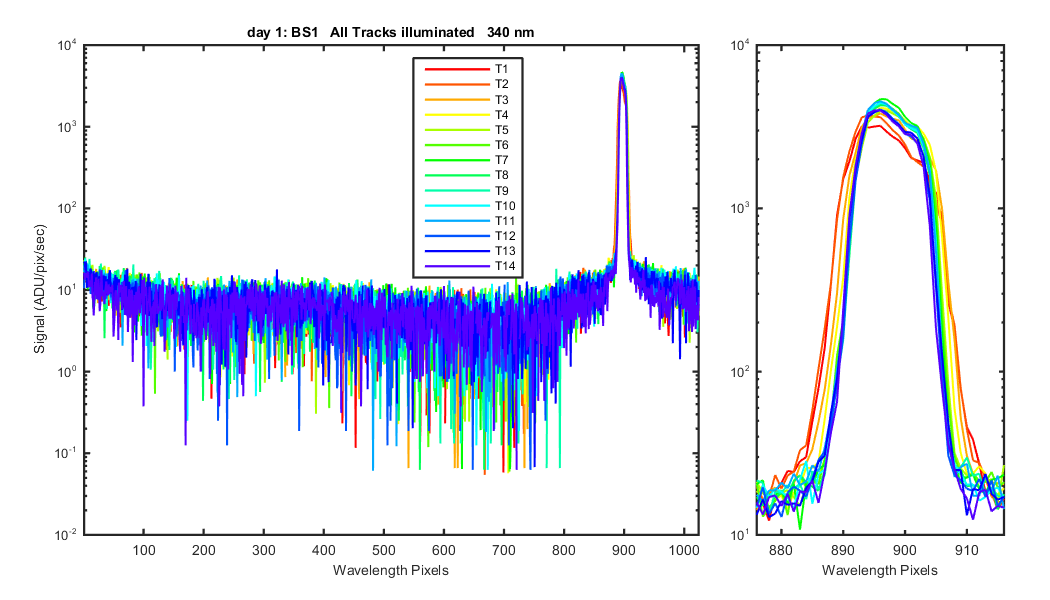
Figure 6
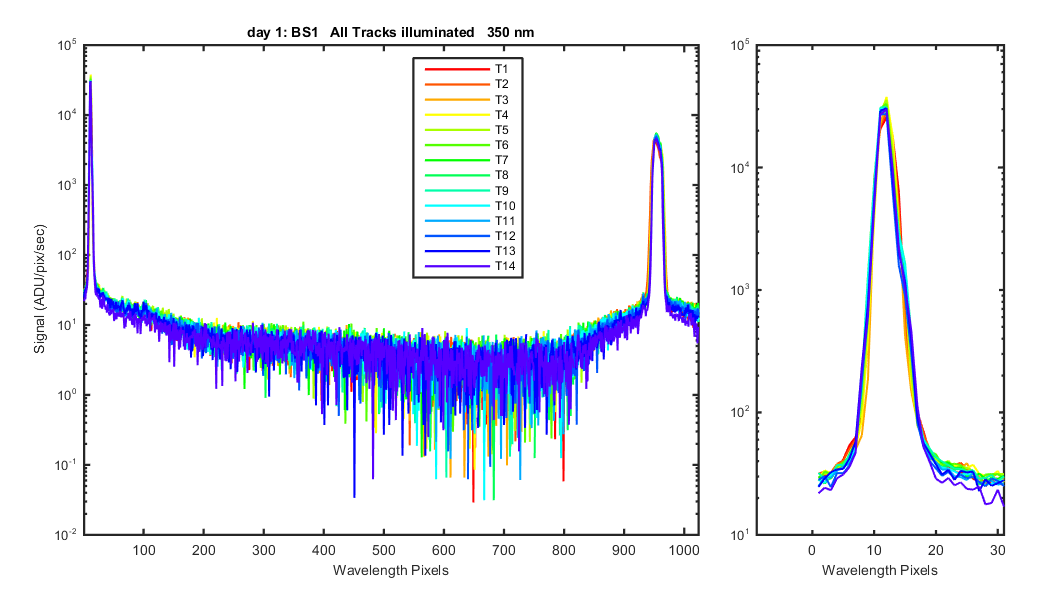
Figure 7
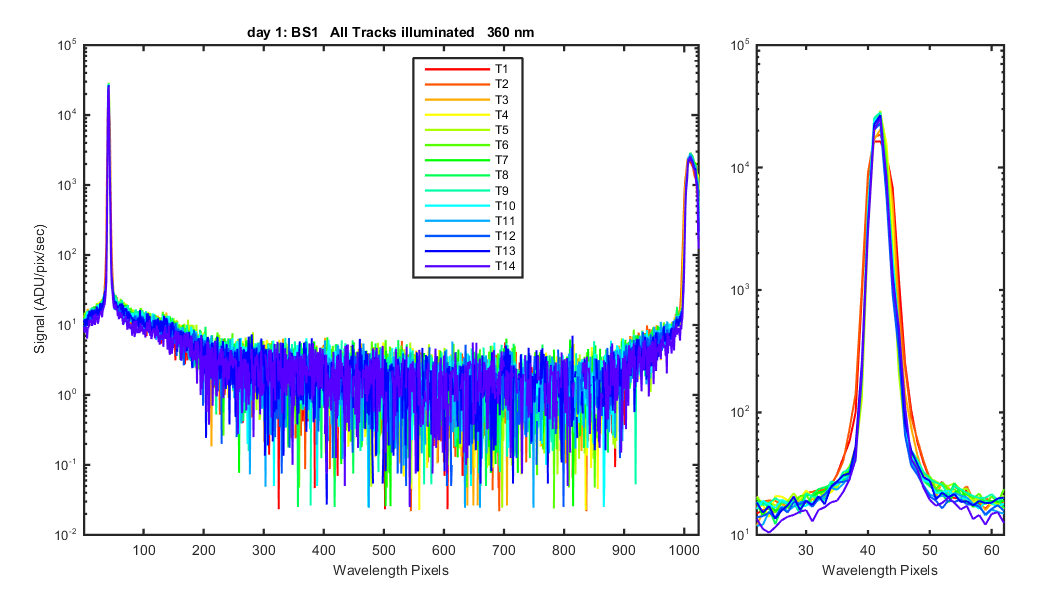
Figure 8
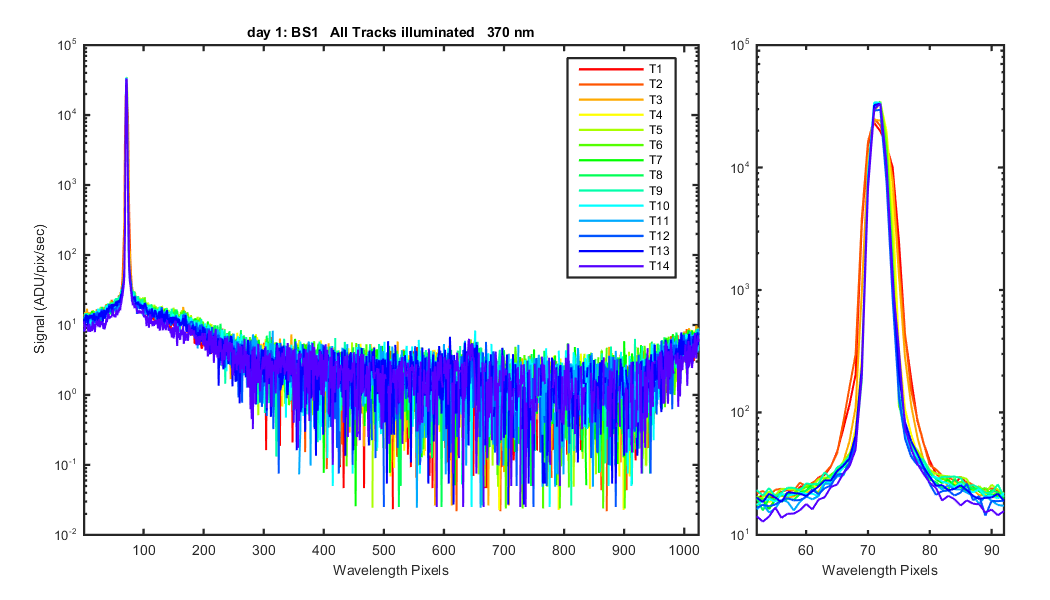
Figure 9
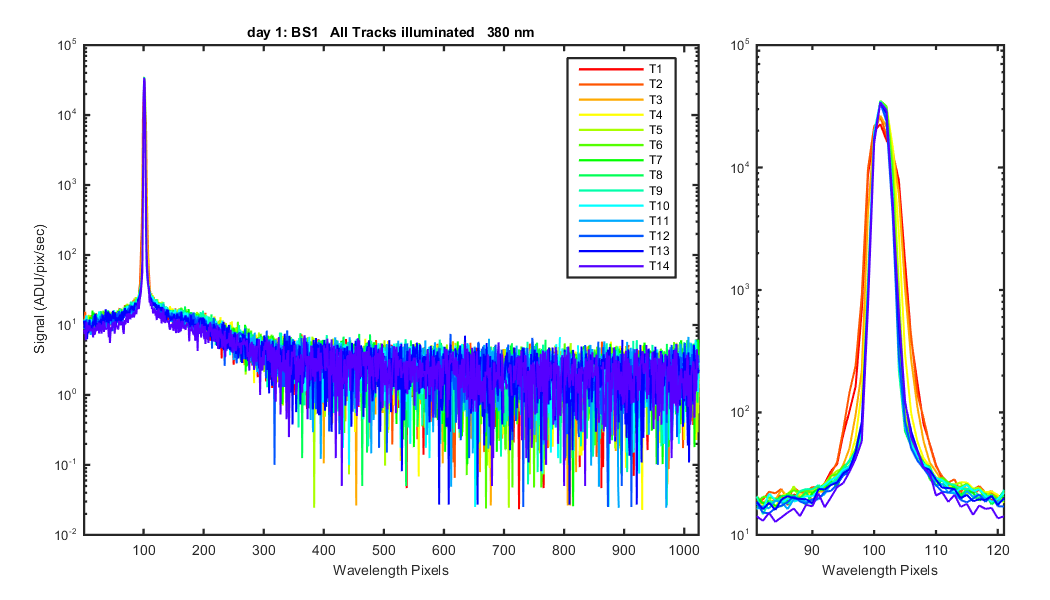
Figure 10
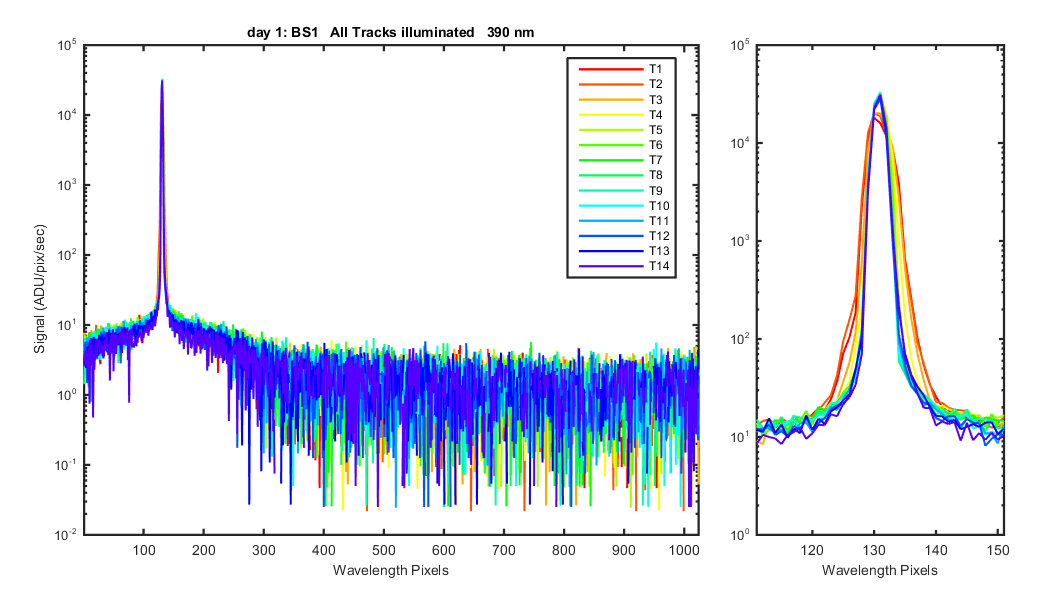
Figure 11
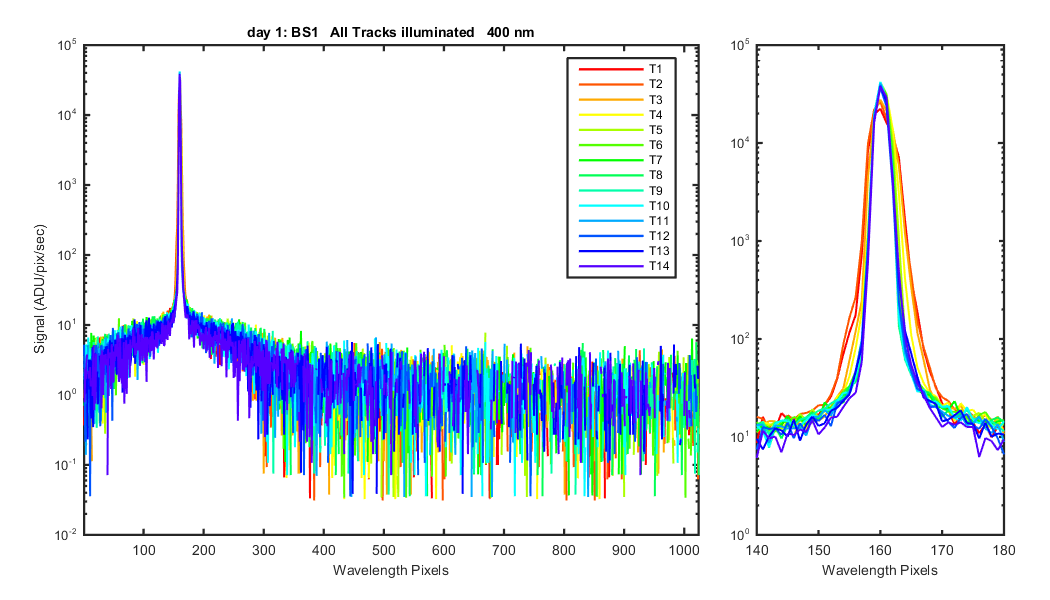
Figure 12
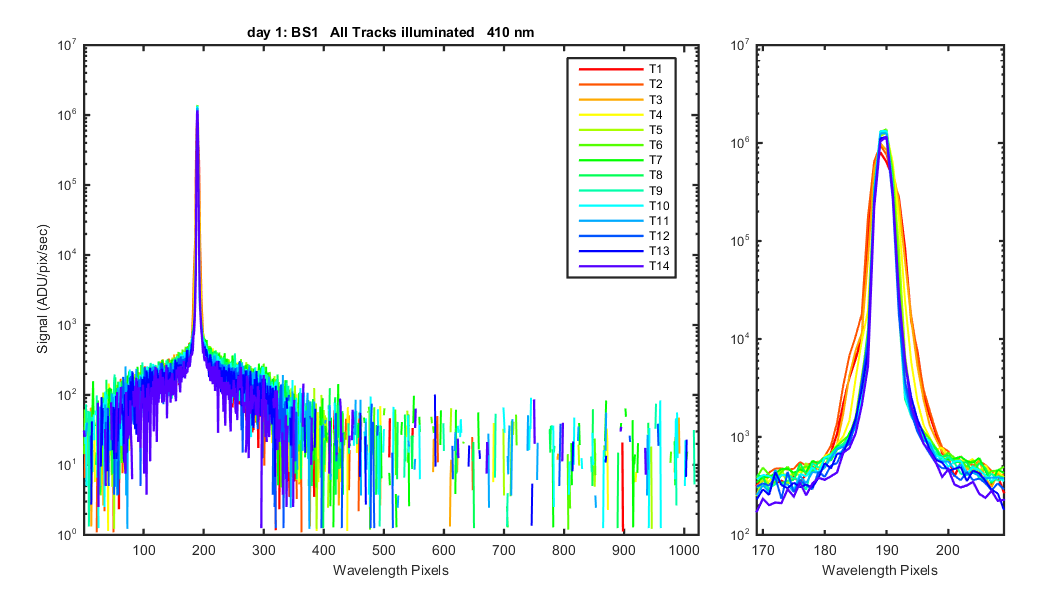
Figure 13
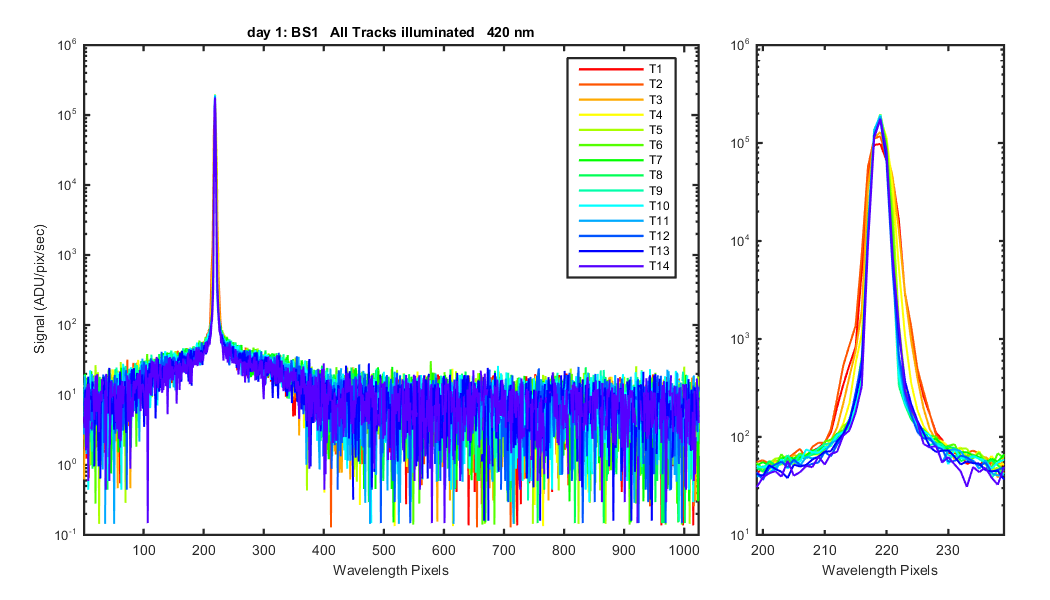
Figure 14
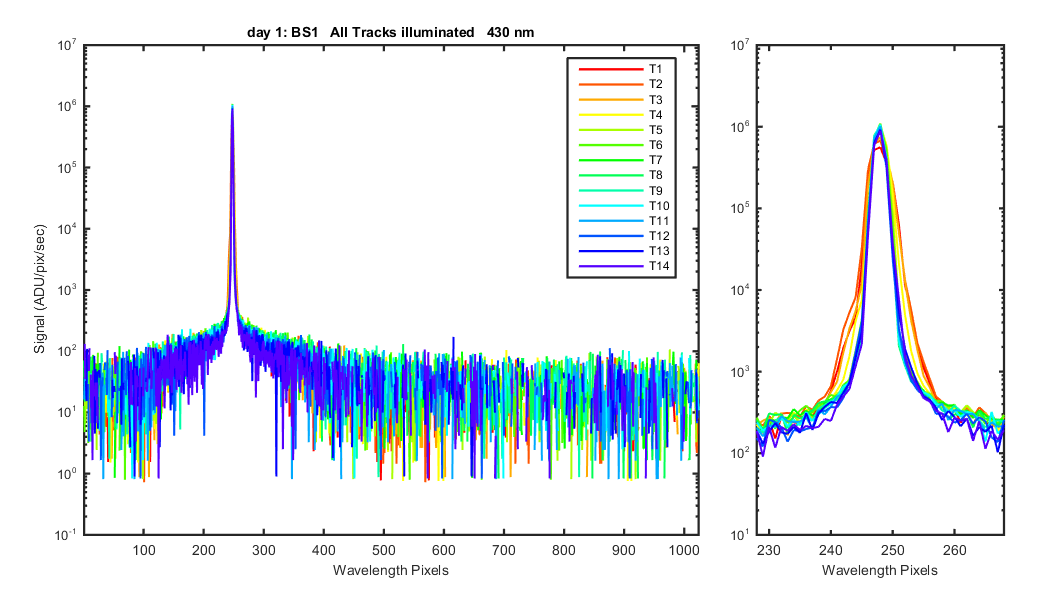
Figure 15
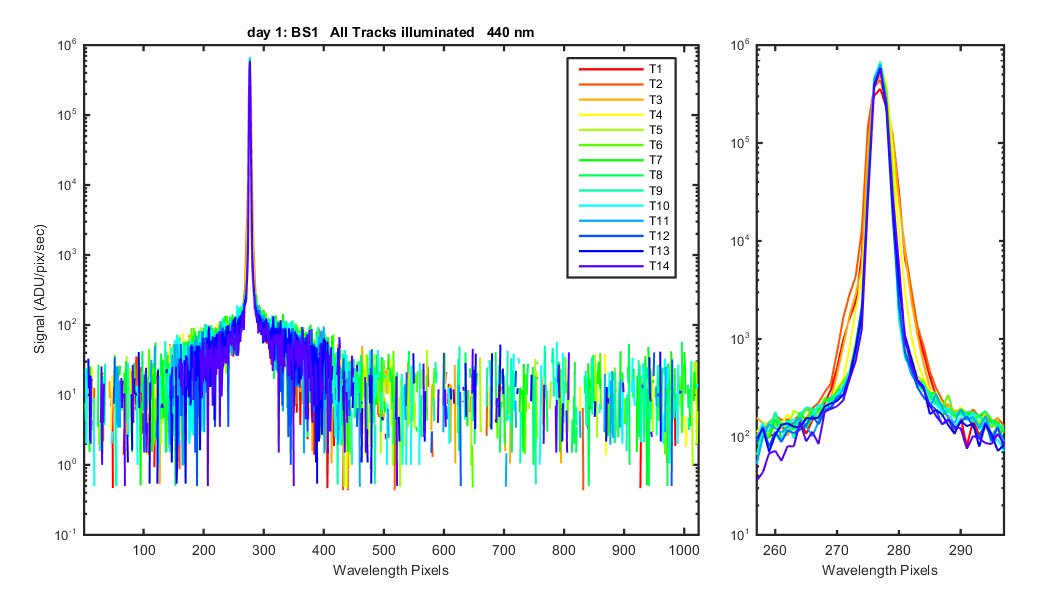
Figure 16
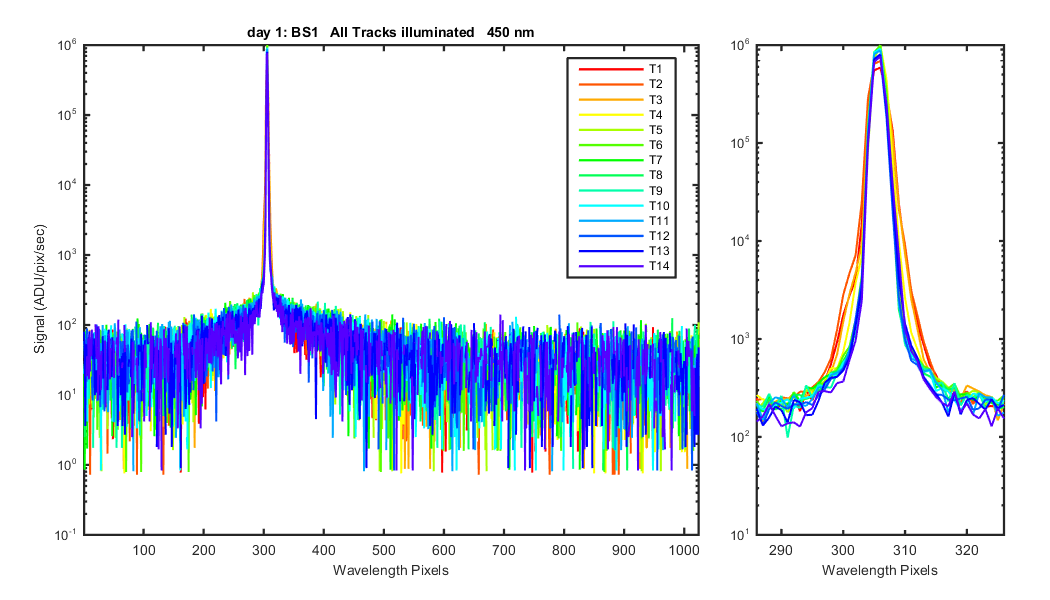
Figure 17
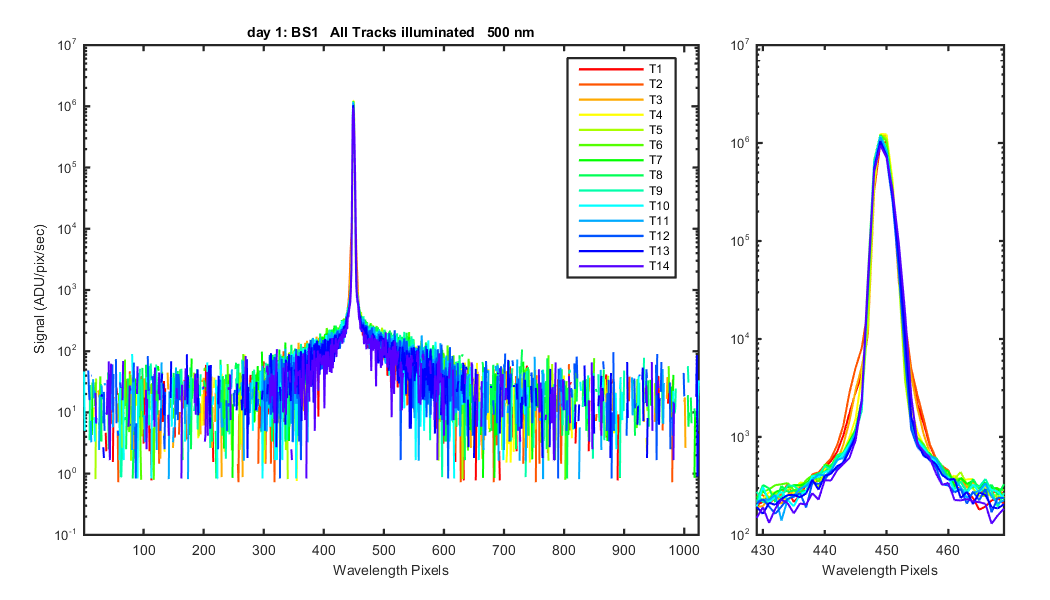
Figure 18
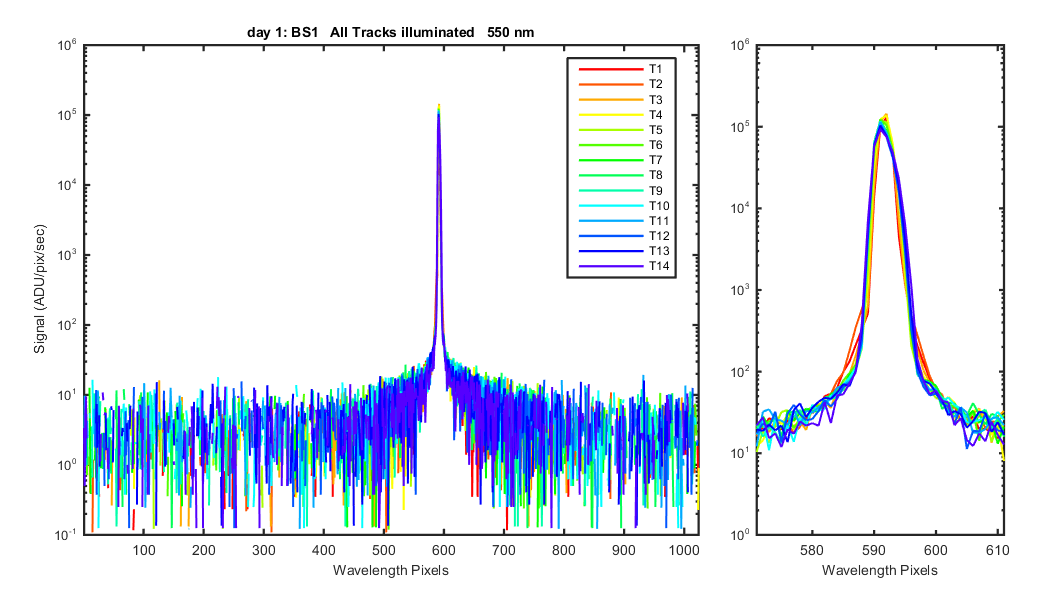
Figure 19
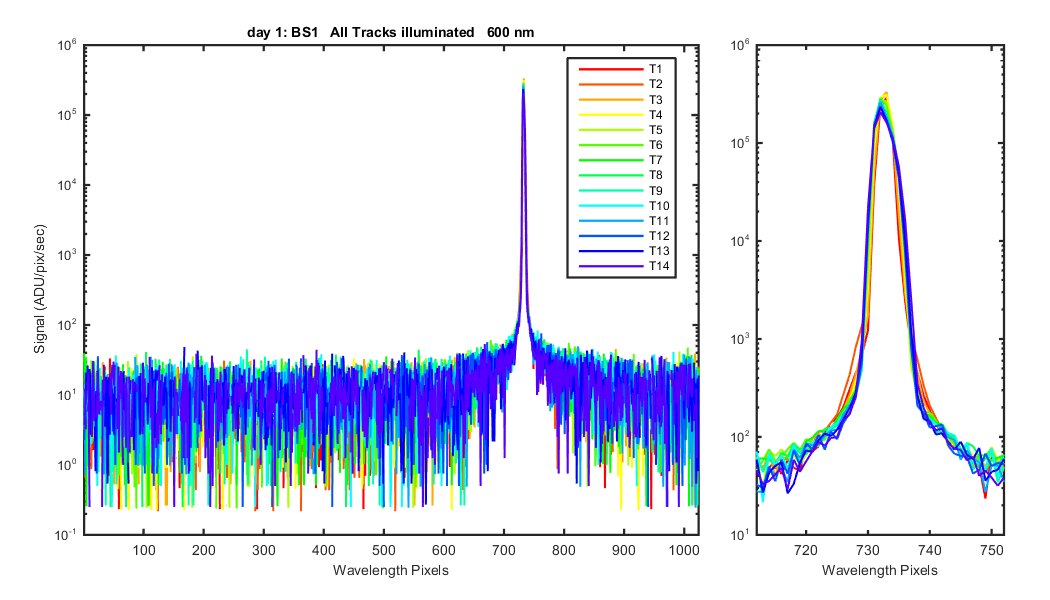
Figure 20
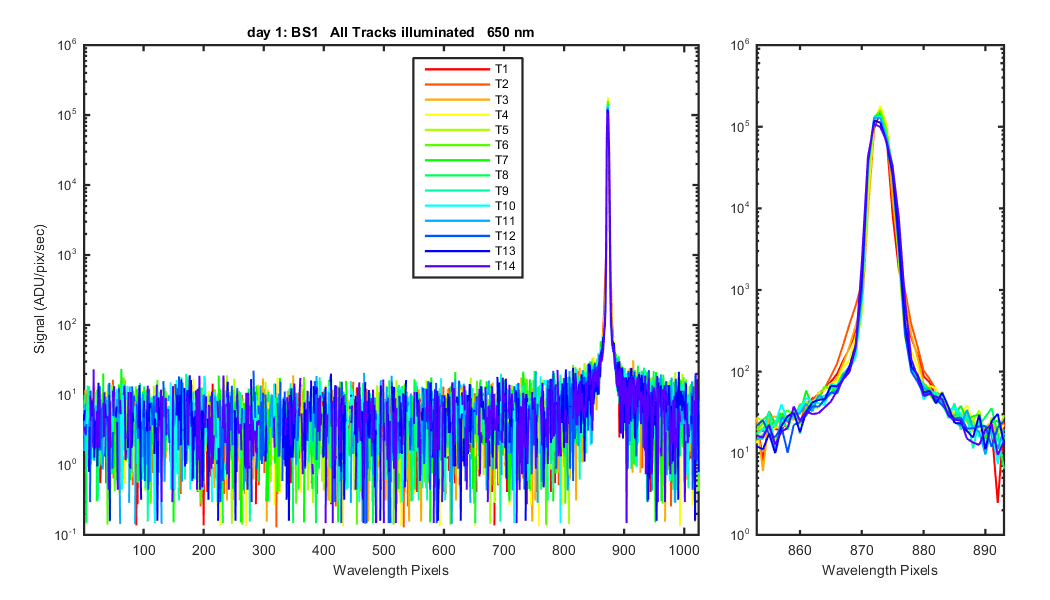
Figure 21
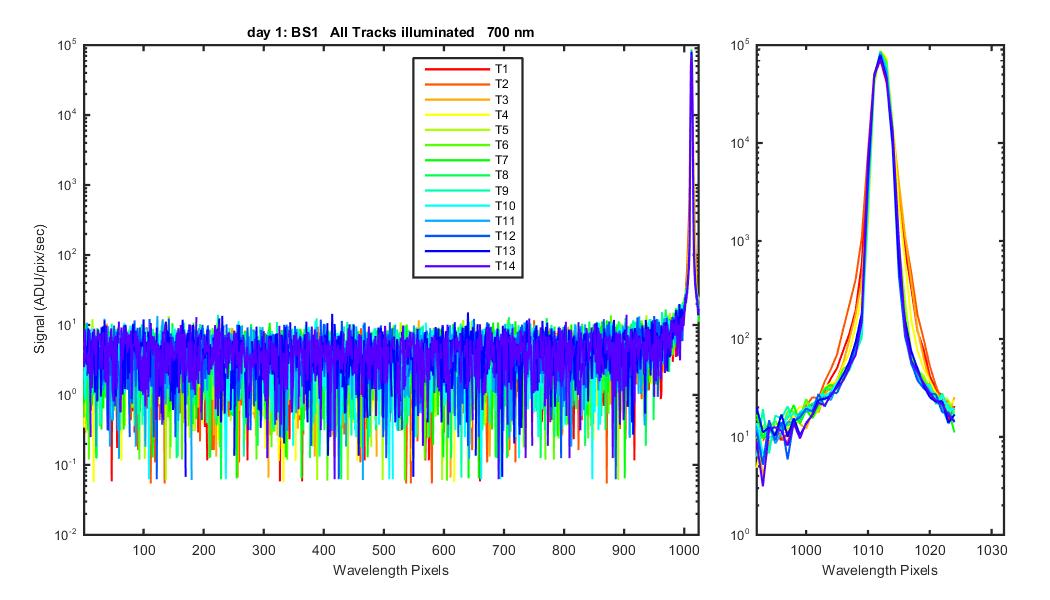
Figure 22