REVISION DATE: 29-Apr-2015 09:38:42
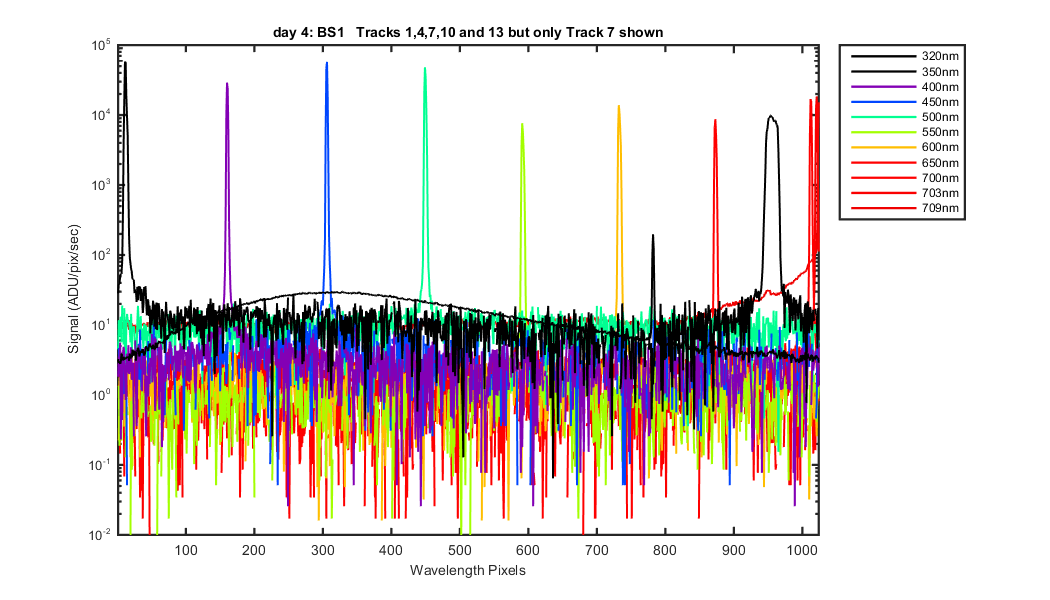
This shows the laser data collected by Mike on day 4. Data was collected with only one track on, those tracks are 1 , 7 and 13. It was also collected with tracks 1,4,7,10 and 13 on at the same time. Also note that this data was collected on Preamp gain 4 so there should be no saturation until the numbers are above 65000 ADU. The graphs below show the data for each individual track and track 7 when tracks 1,4,7,10 and 13 where on. The data where collected at a temp of -40C rather than -10C from day 1.
Looks at all the track data (track 7 only and all tracks on)Figure 1
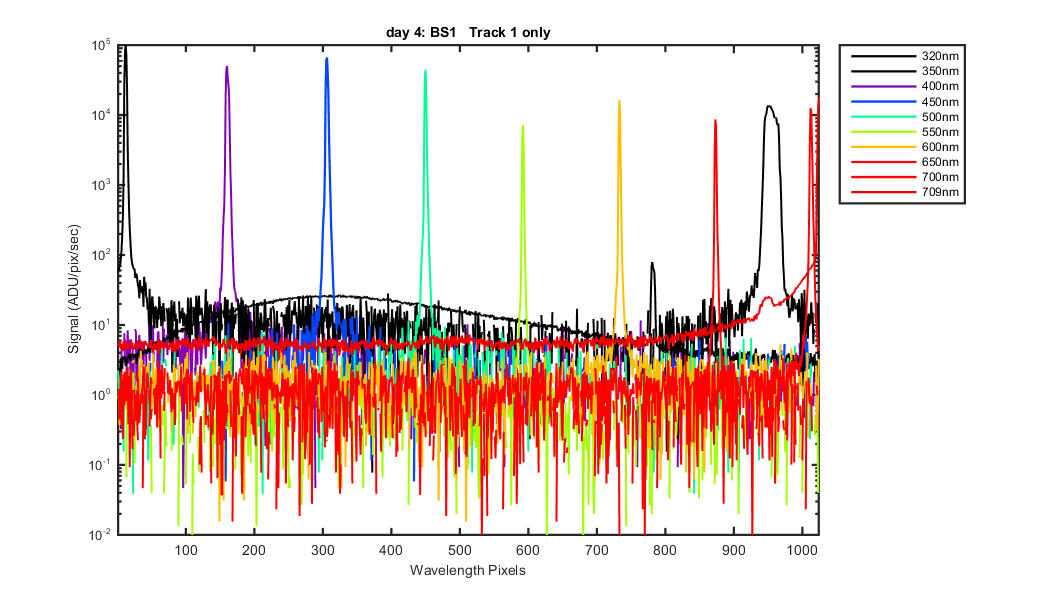
Figure 2
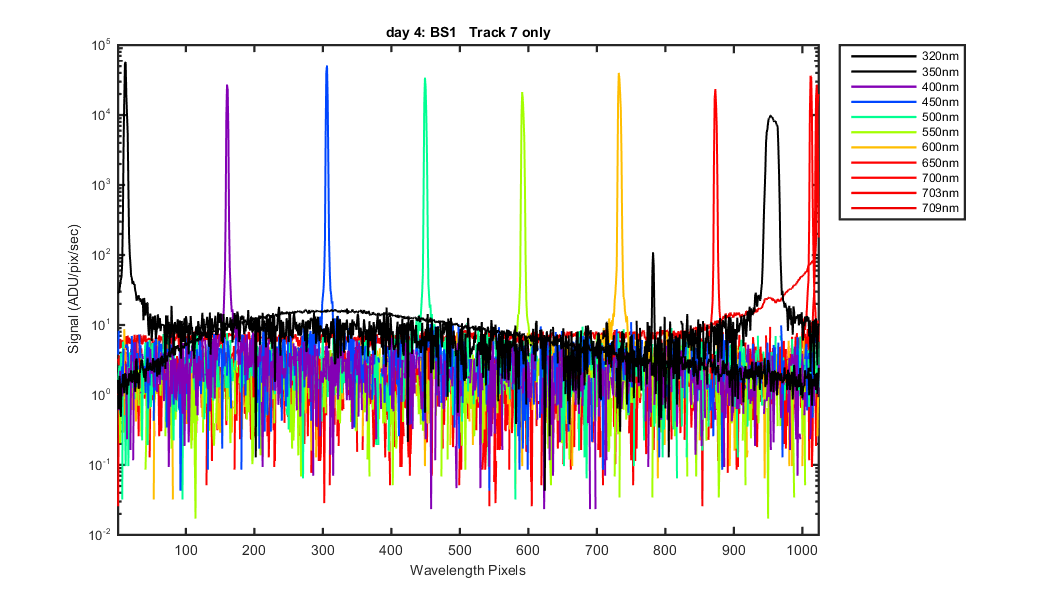
Figure 3
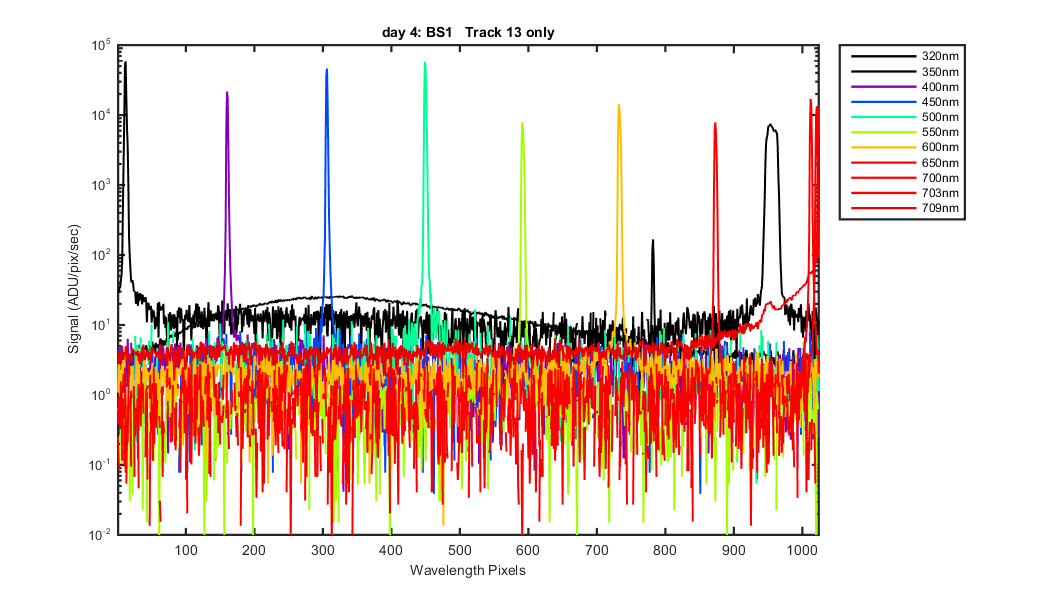
Figure 4