REVISION DATE: 29-Apr-2015 09:38:15
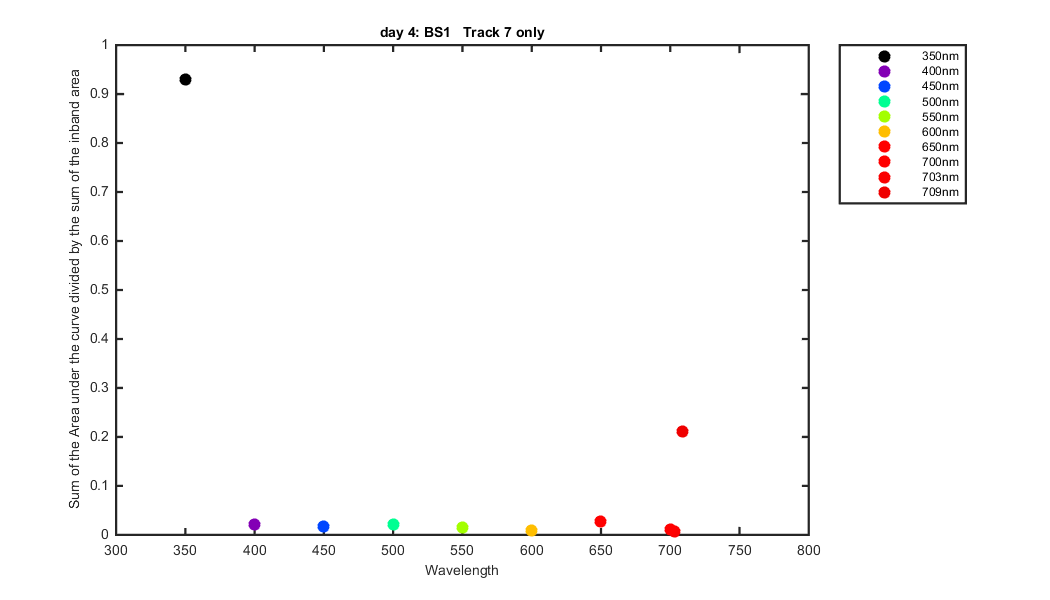
I wanted to look at the laser data as the peaks go off the CCD array on the UV side. We are seeing peaks that should not be there. The first graph shows the laser data. You can see there is a large secondary peak around pixel 950. Also for the 320 nm laser data which are off the array there is a small peak and a larger hump. What I did was find the max value for each laser data set and removed the peak by removing +- 12 pixels around the peak. This does a pretty good job as a first pass. The laser peaks on the edge of the array have more of a delta shape below the laser peak. I did not try to remove it. I then took the data with the peaks removed and summed the area under the curves. That is the second plot. I did not normalize the data because for the 320 nm peak there is no on array peak to normalize too. I also created a graph for the laser data with peaks on the array (I.E. I did not use the 320 nm data) and divided by the laser peak inband area. This normalizes the data relative to the amount of laser light coming in. You can see for the 350 nm data the about of out-of-band light is almost equal to the in-band area.
Figure 1
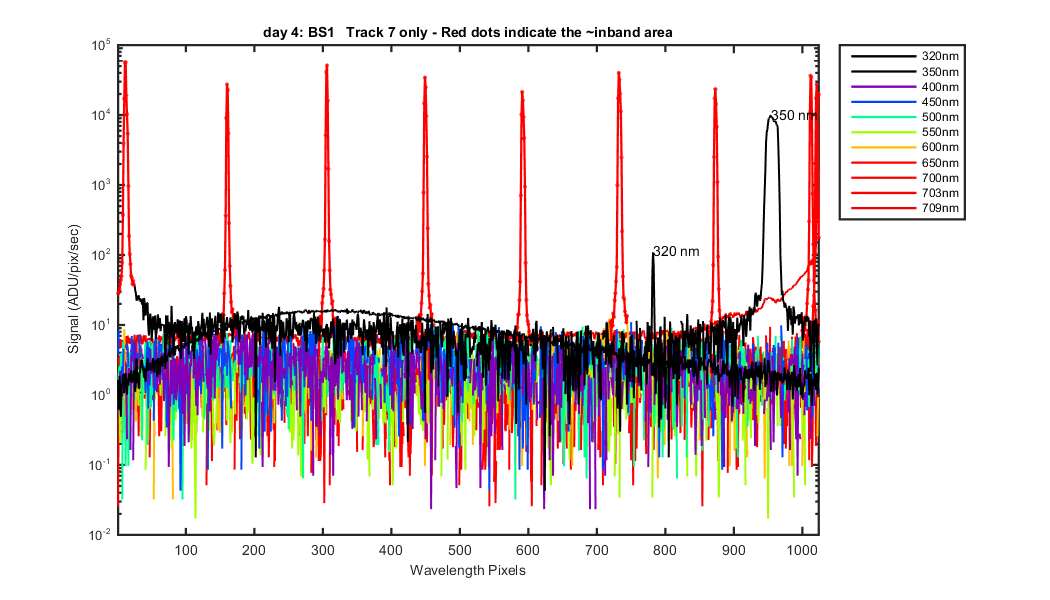
Figure 2
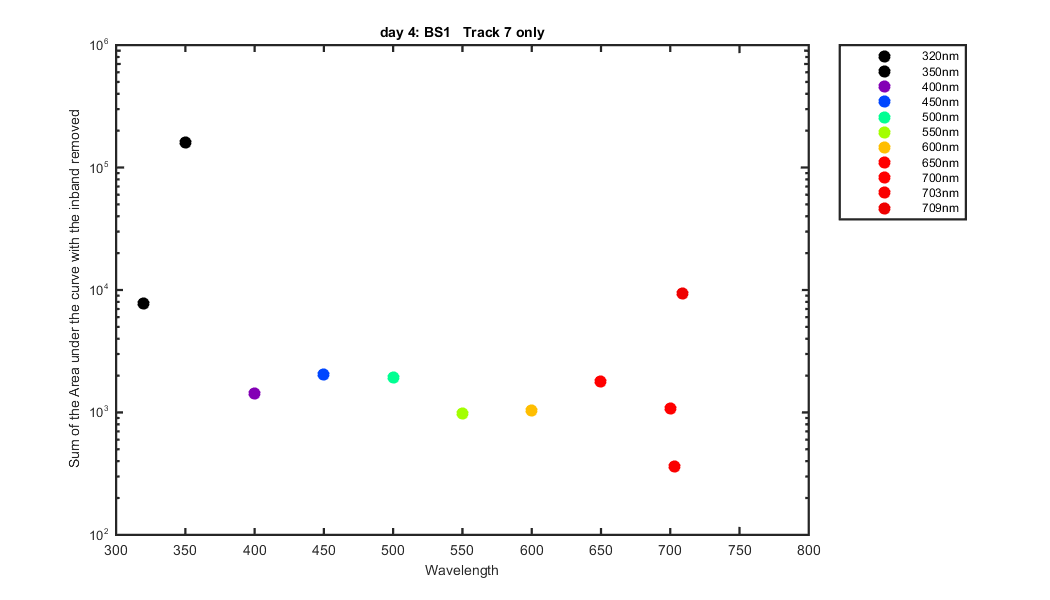
Figure 3