REVISION DATE: 15-Apr-2015 10:59:14
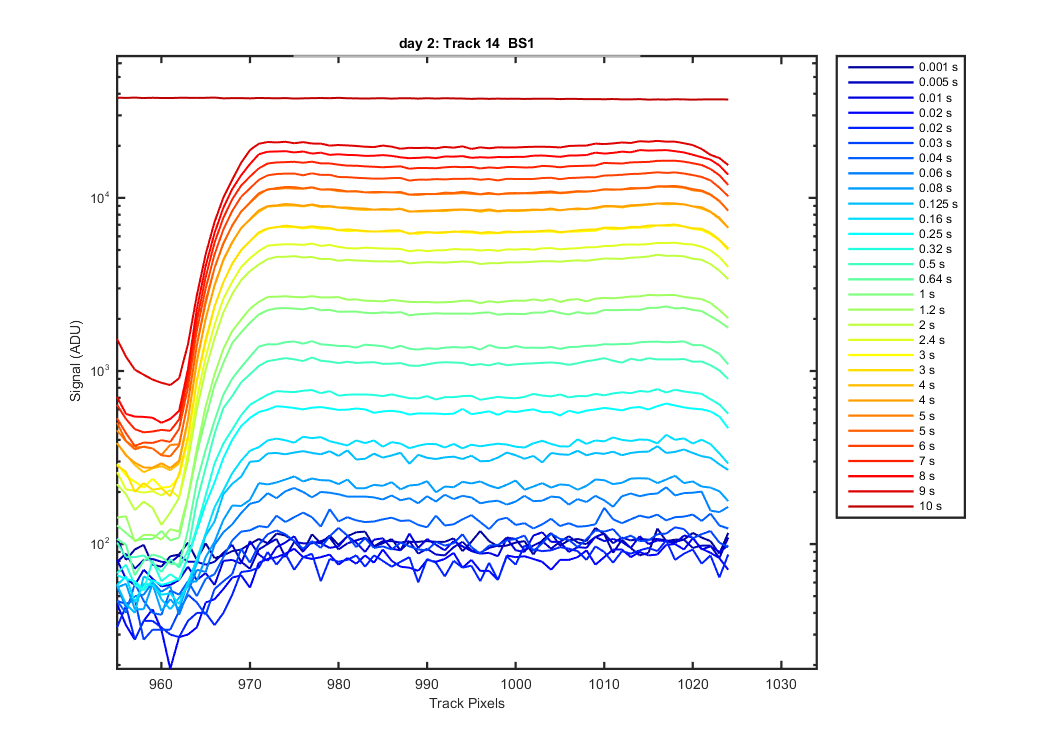
Mike did a saturation check after seeing the laser data from the previous day saturating at ~35,000 ADU rather than over 65,000 ADU. The data are collected at PreAmp Gain 1. The first set of graphs show the along track saturation and the next two sets show the cross track saturation linear and logged. Not that at low integration times Track on has a curve added to it so that its saddle shape become more pointed on one side.
Looks at each tracks data (all tracks on)Figure 1
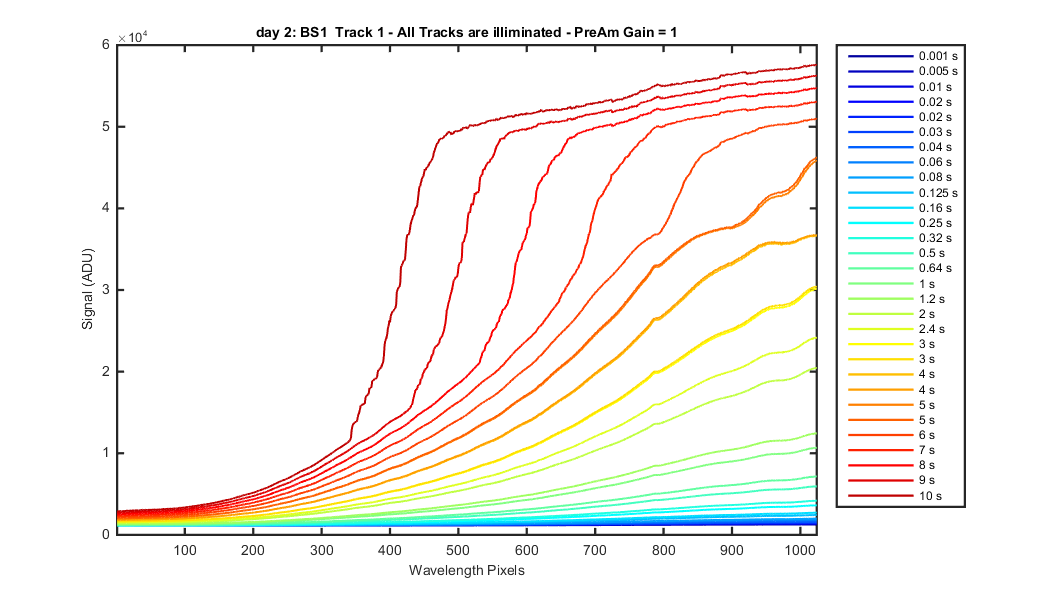
Figure 2
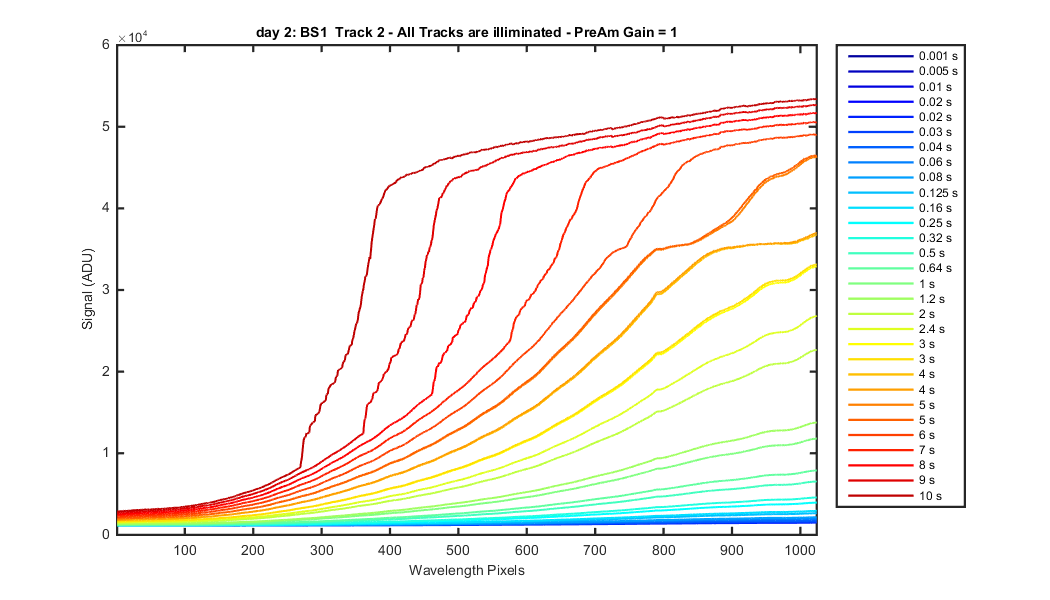
Figure 3

Figure 4
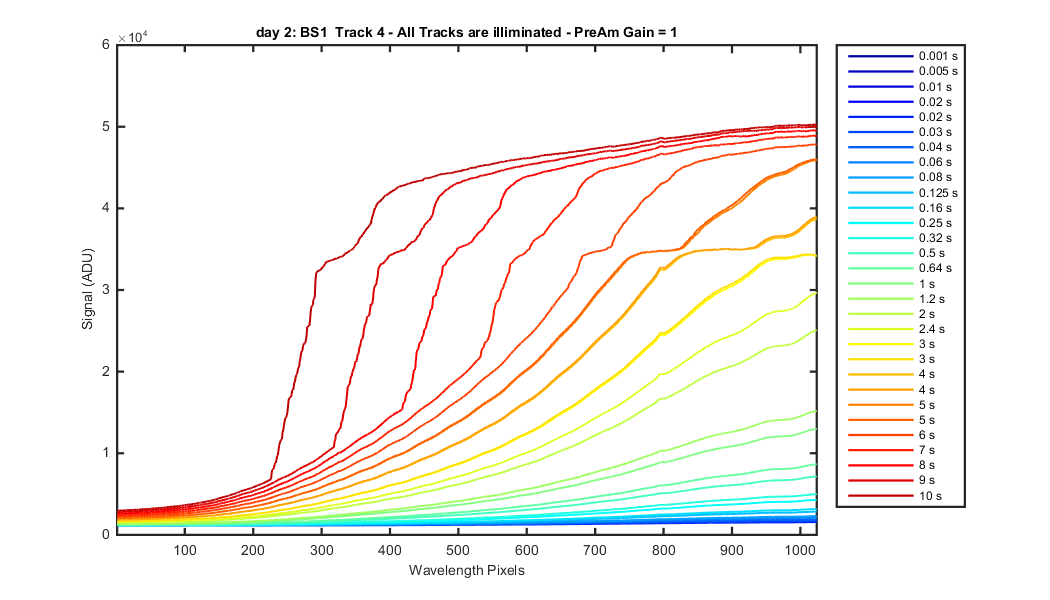
Figure 5
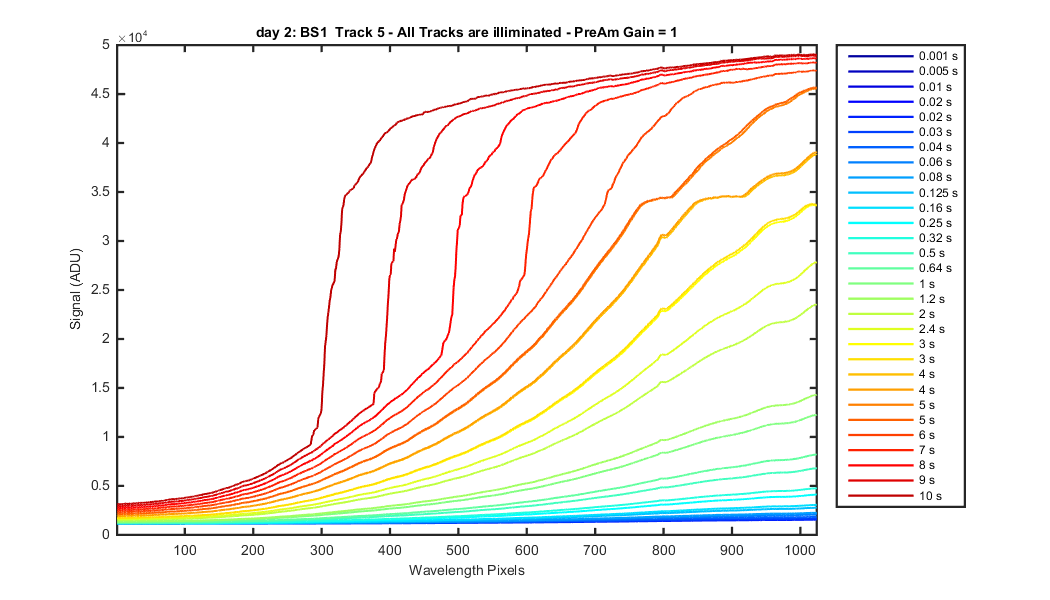
Figure 6

Figure 7

Figure 8
Figure 9
Figure 10

Figure 11

Figure 12
Figure 13

Figure 14
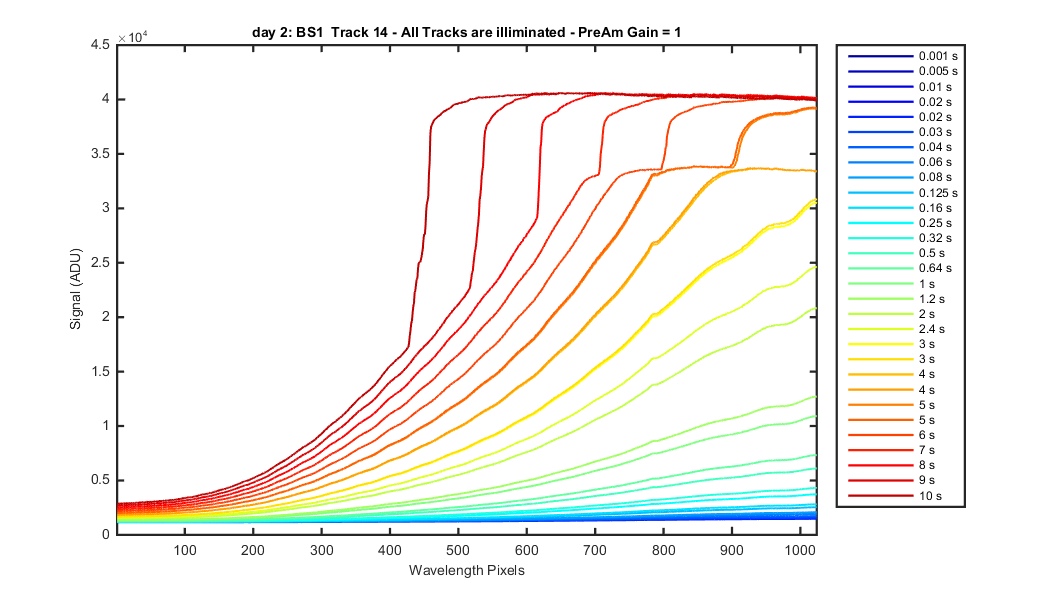
Figure 15
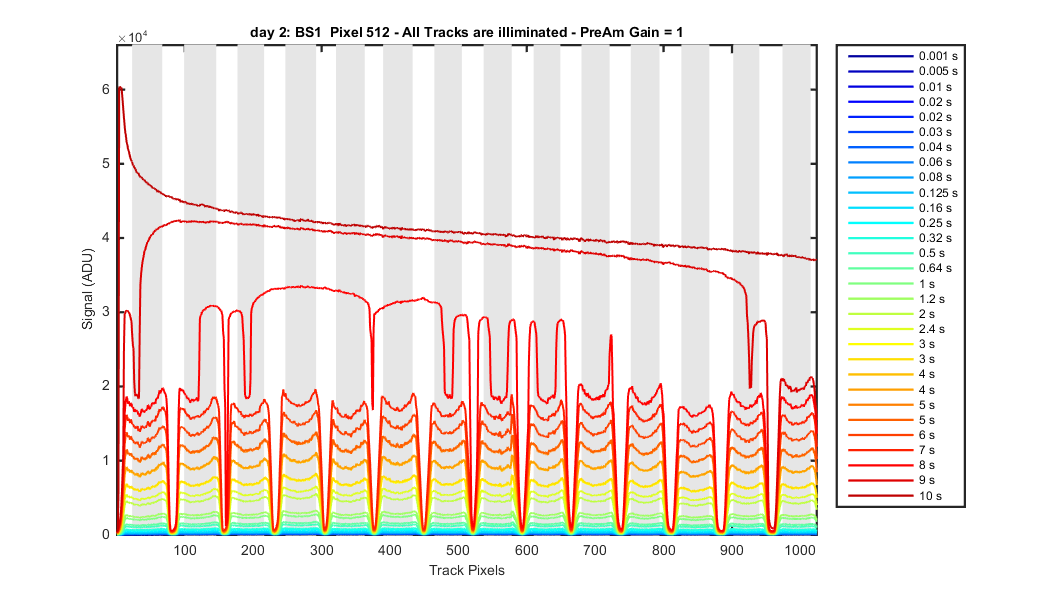
Figure 16
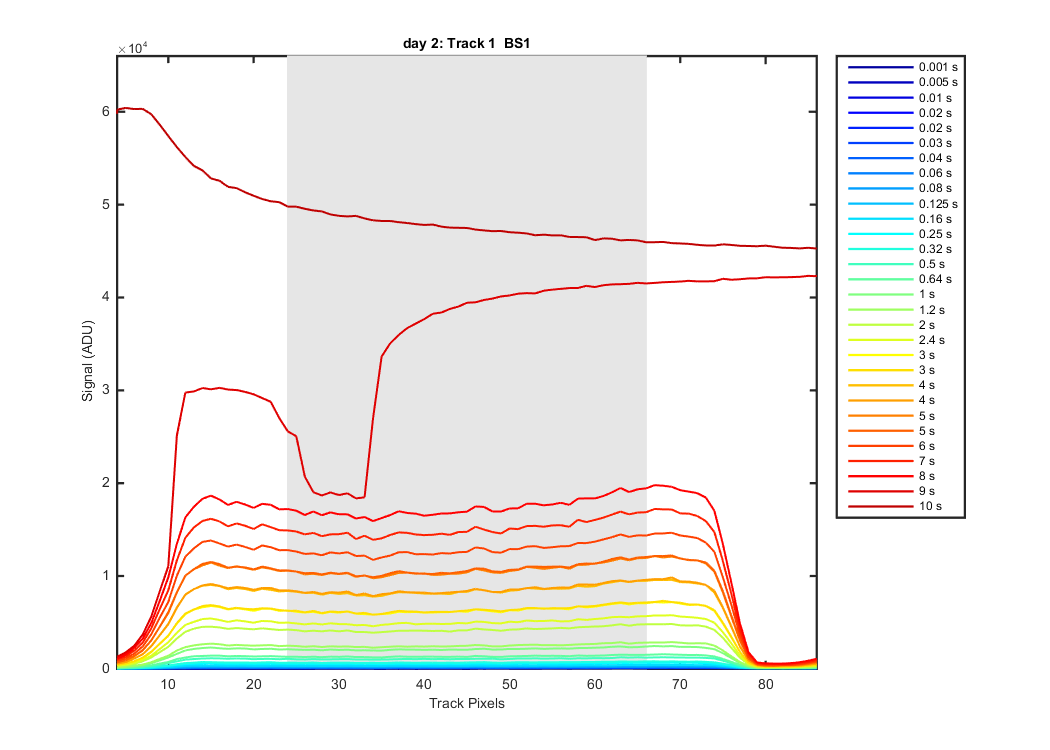
Figure 17
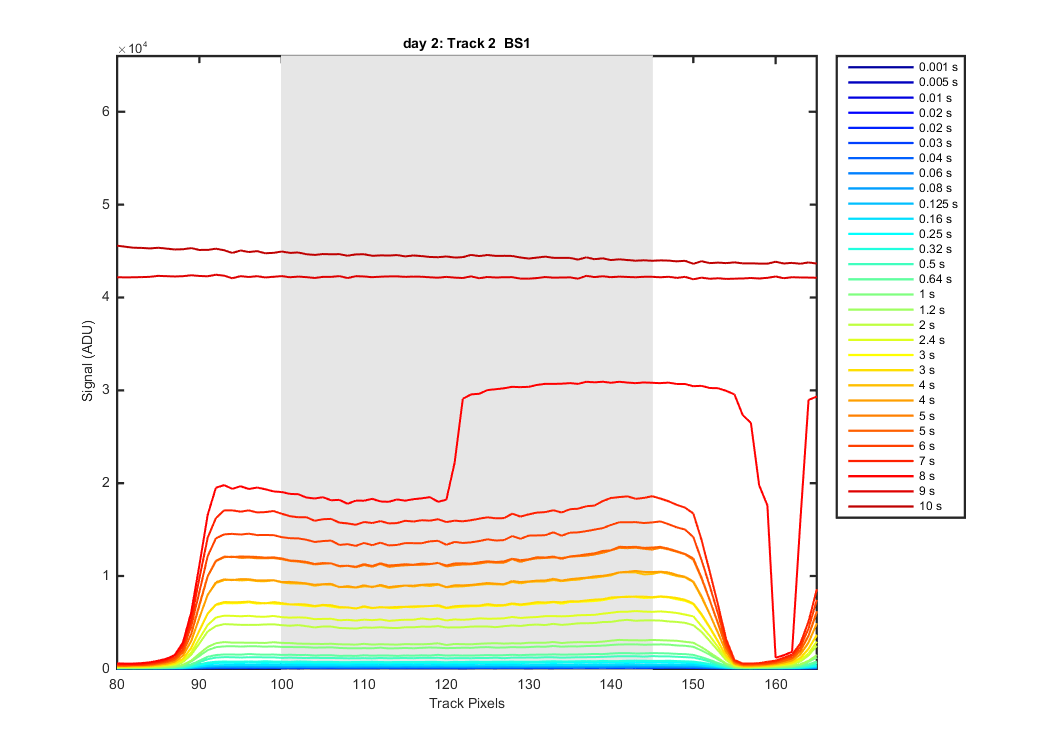
Figure 18
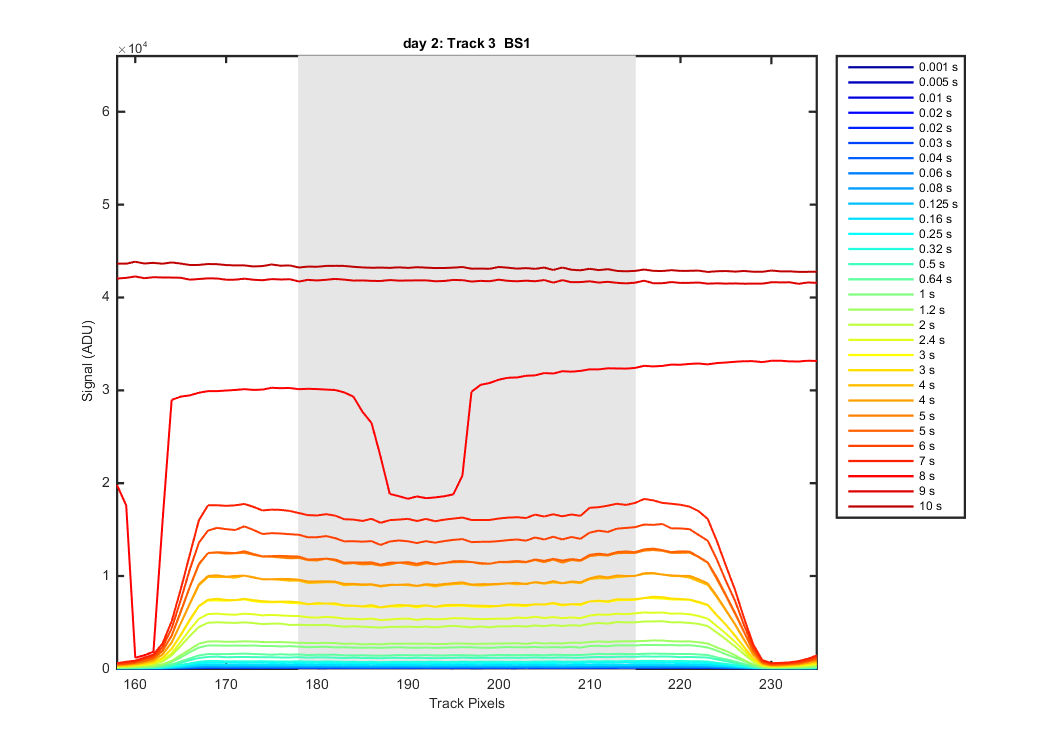
Figure 19
Figure 20
Figure 21
Figure 22
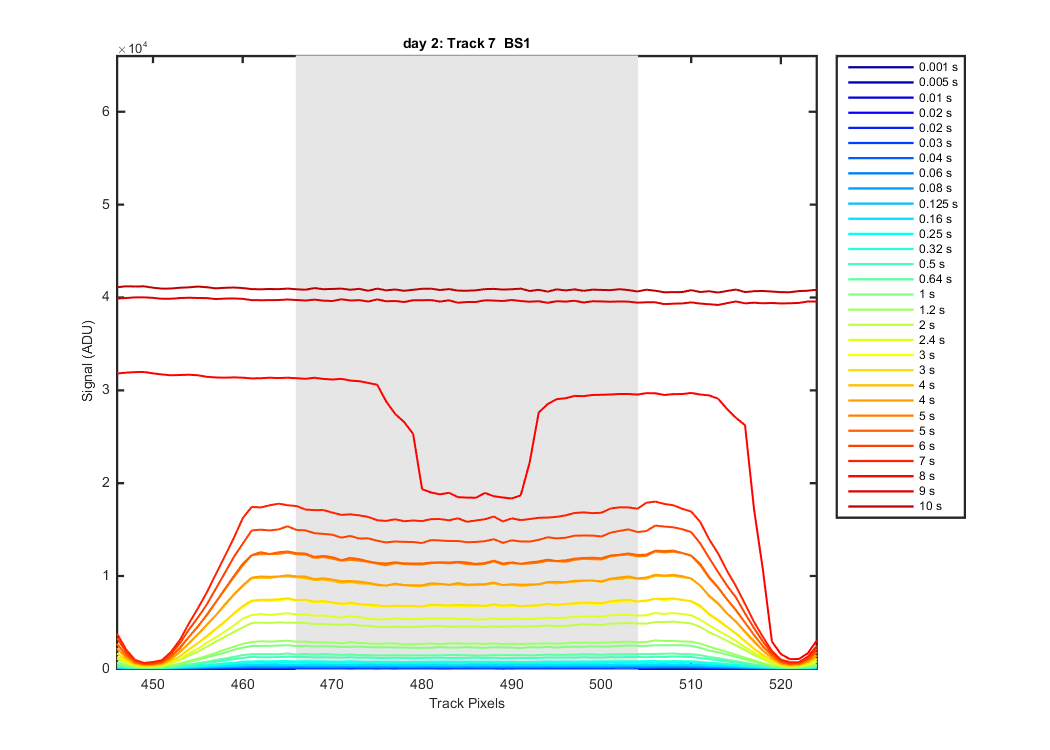
Figure 23
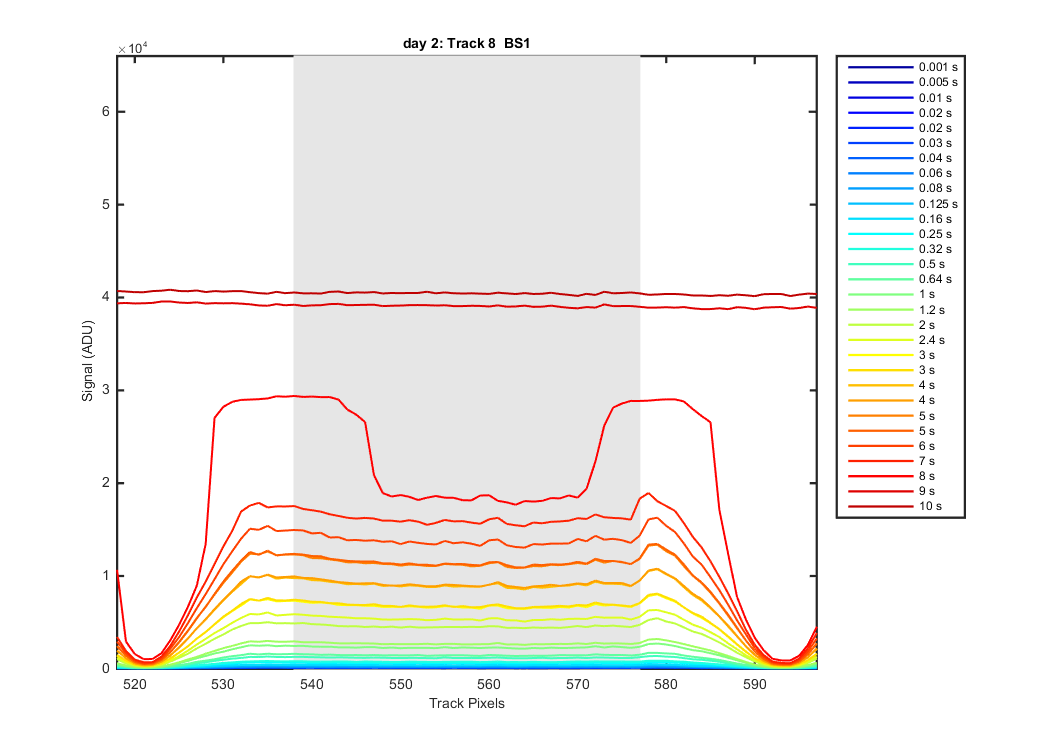
Figure 24
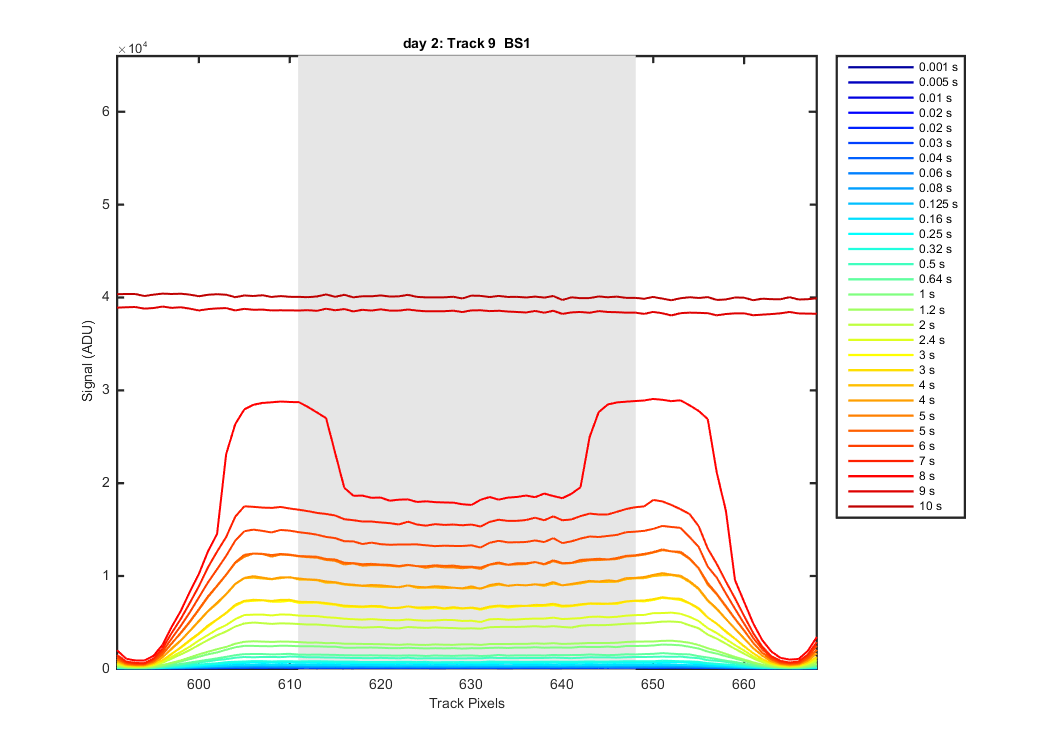
Figure 25
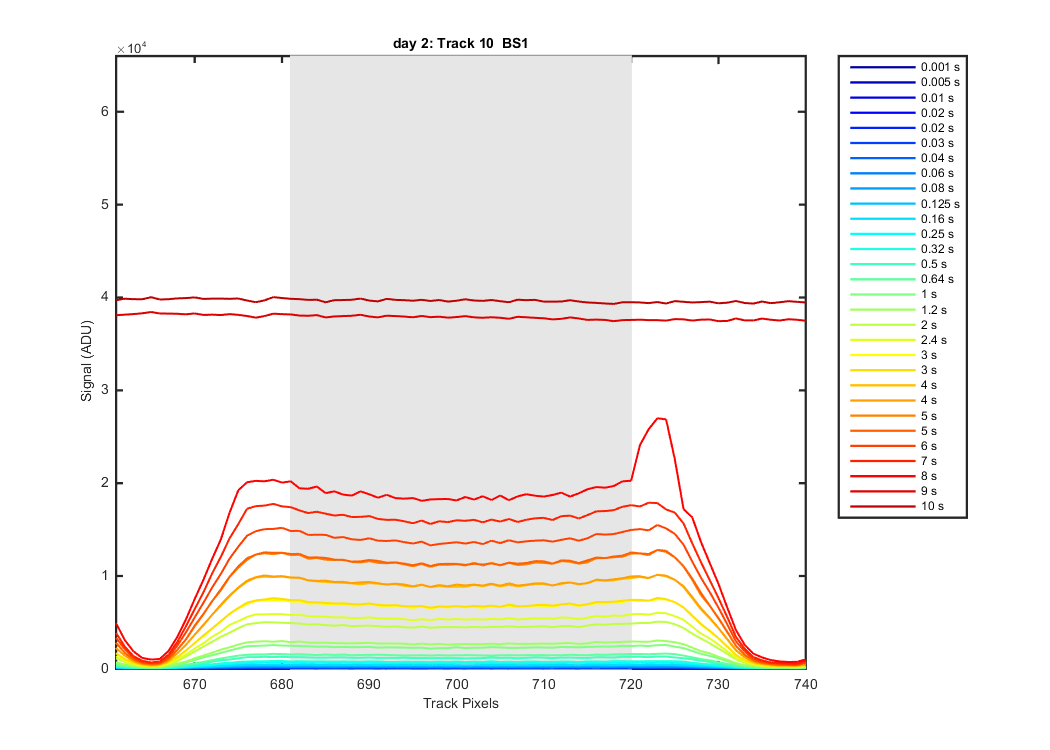
Figure 26
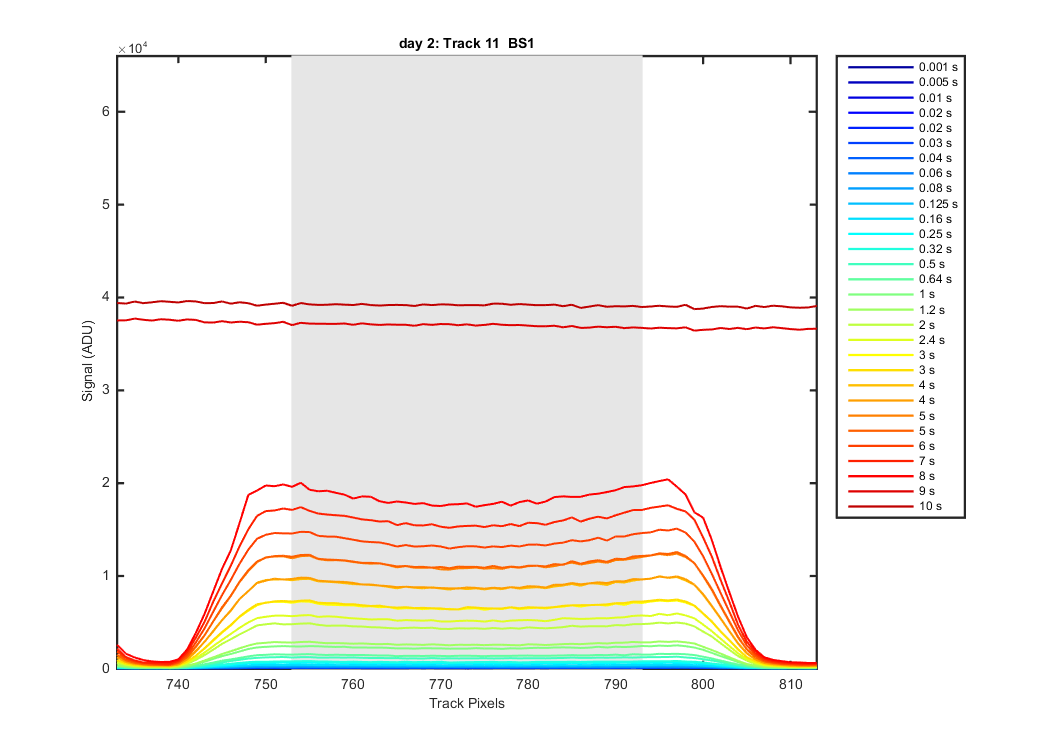
Figure 27
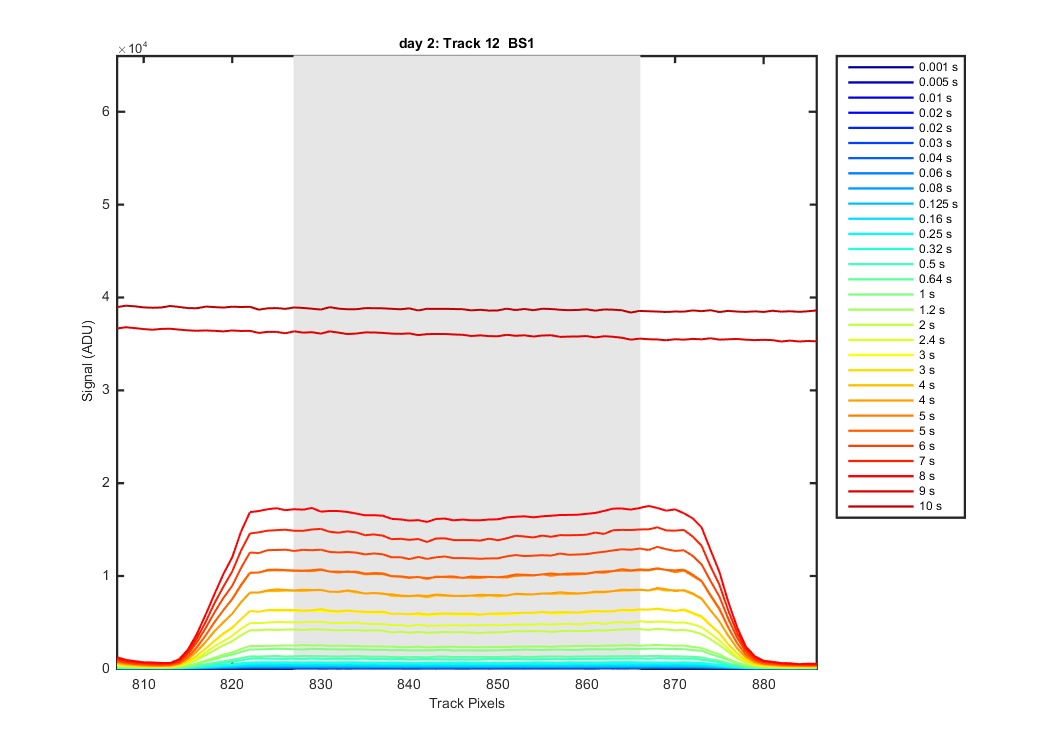
Figure 28
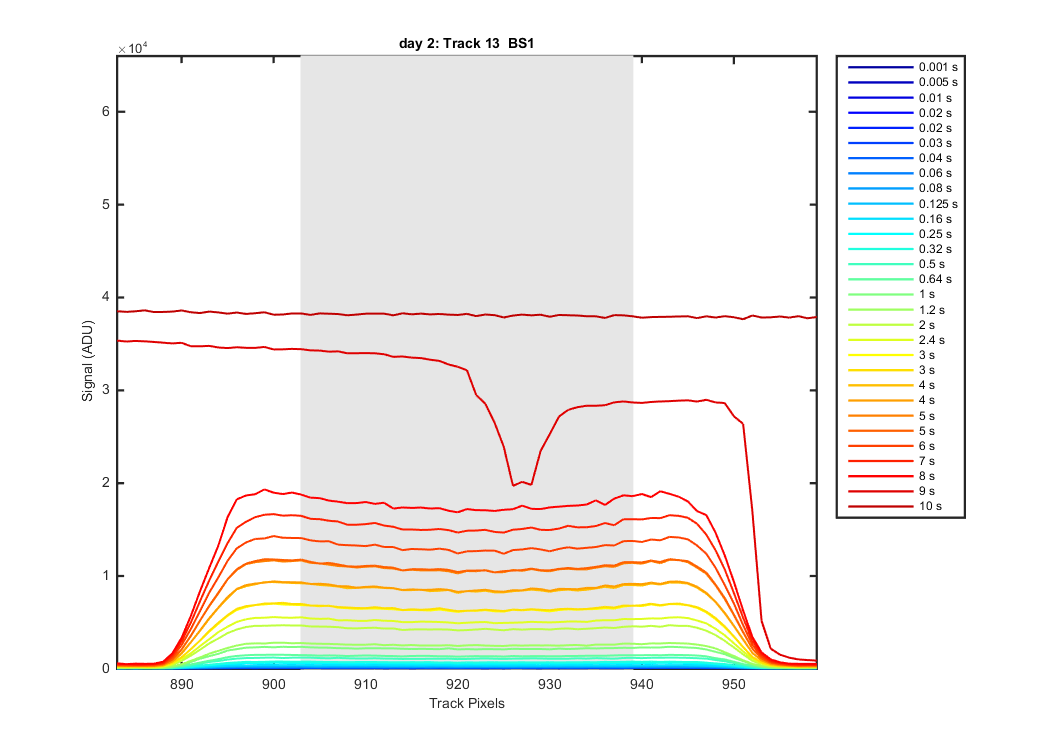
Figure 29
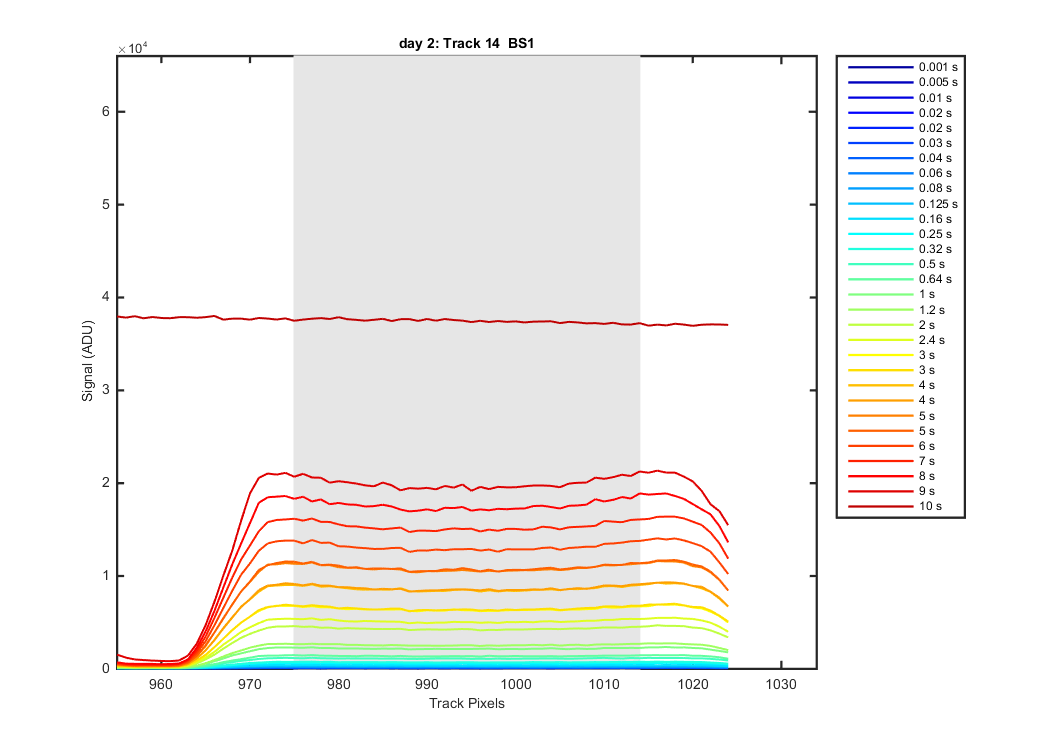
Figure 30
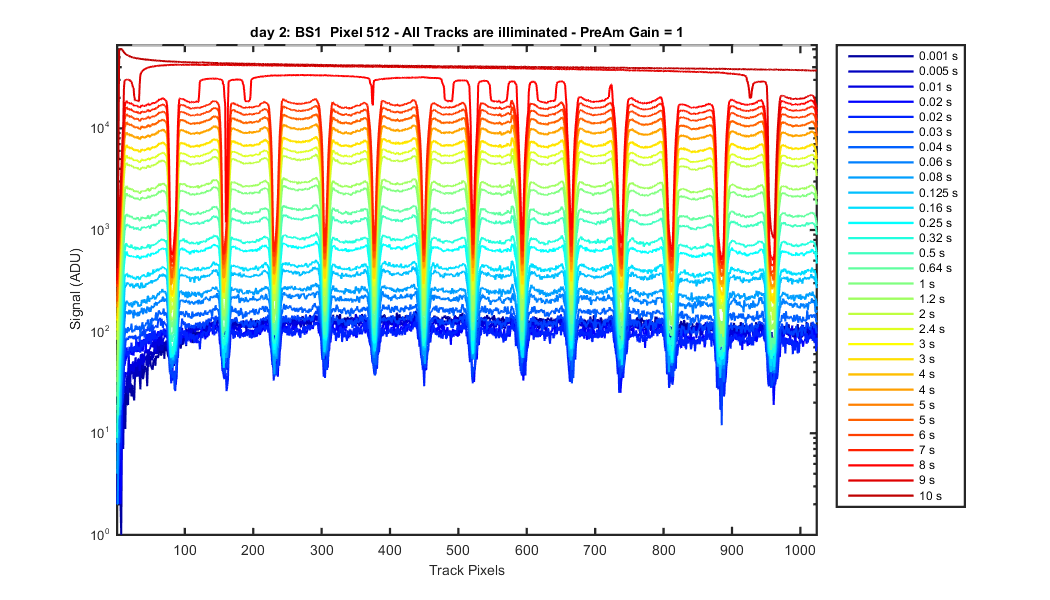
Figure 31
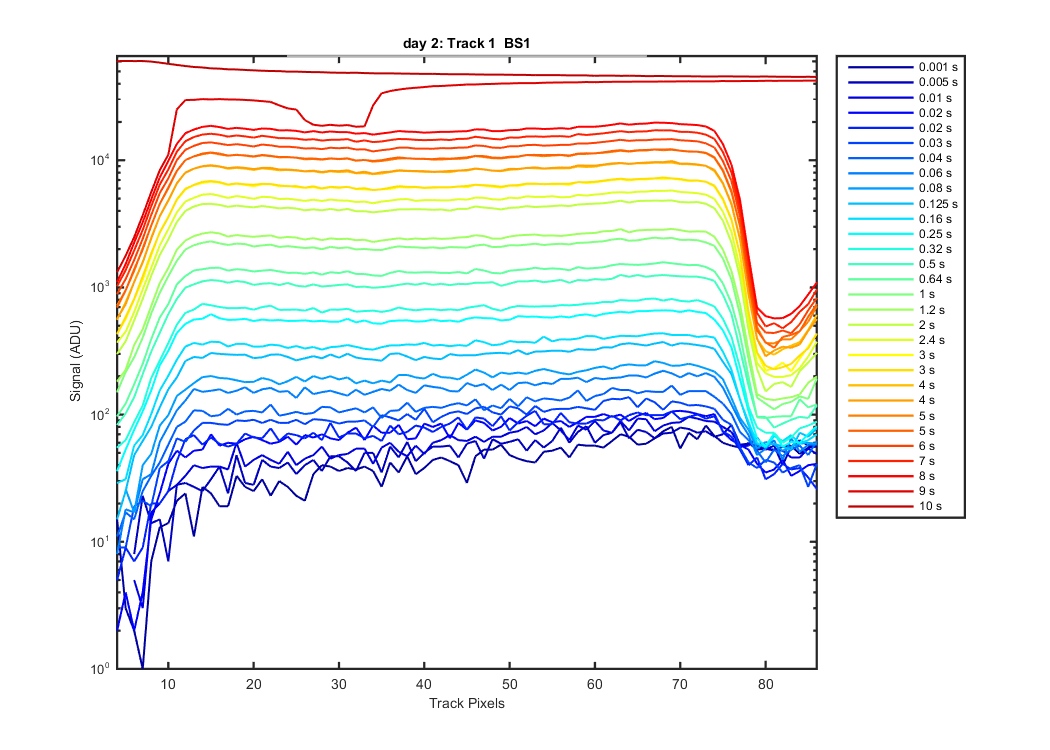
Figure 32
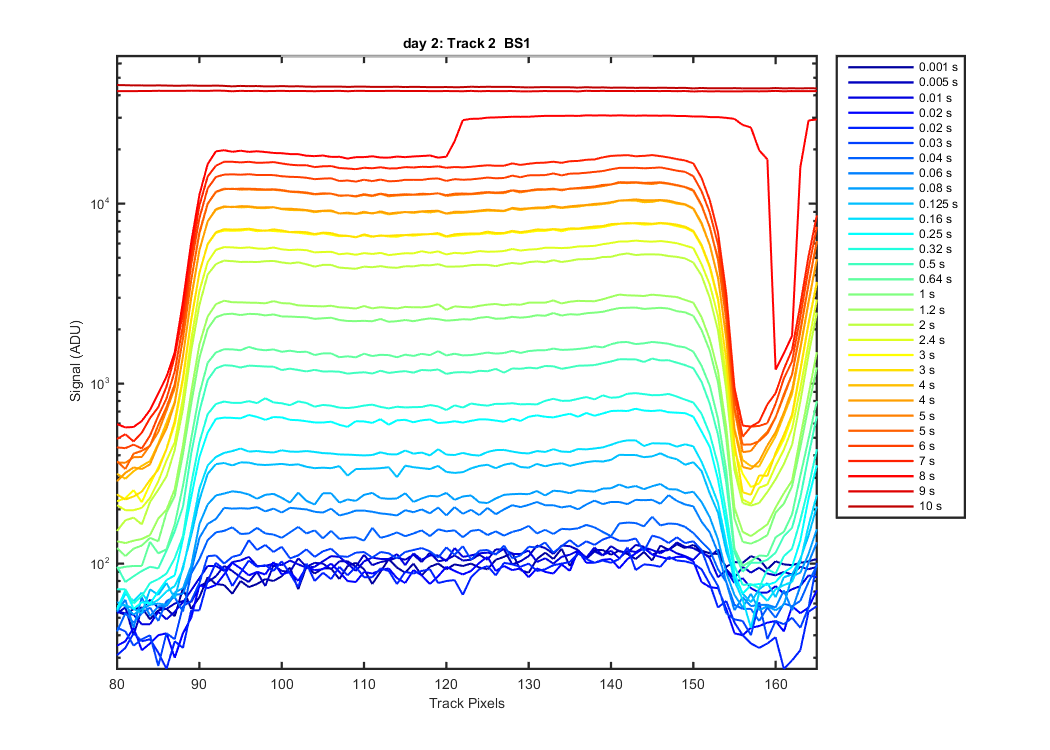
Figure 33
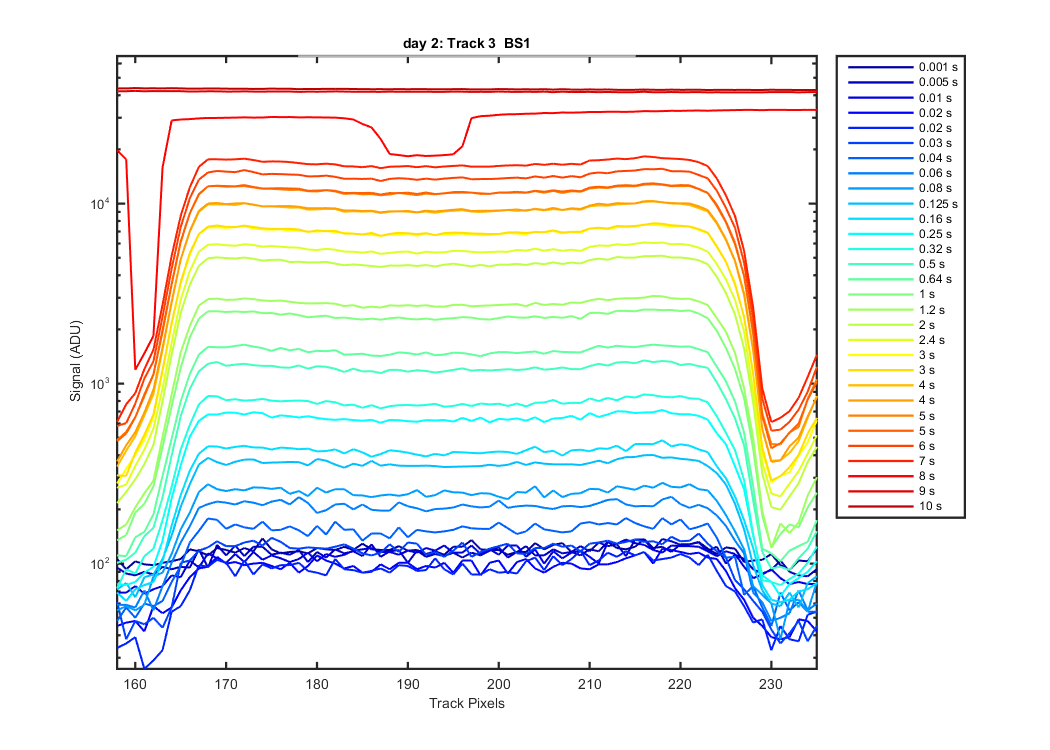
Figure 34
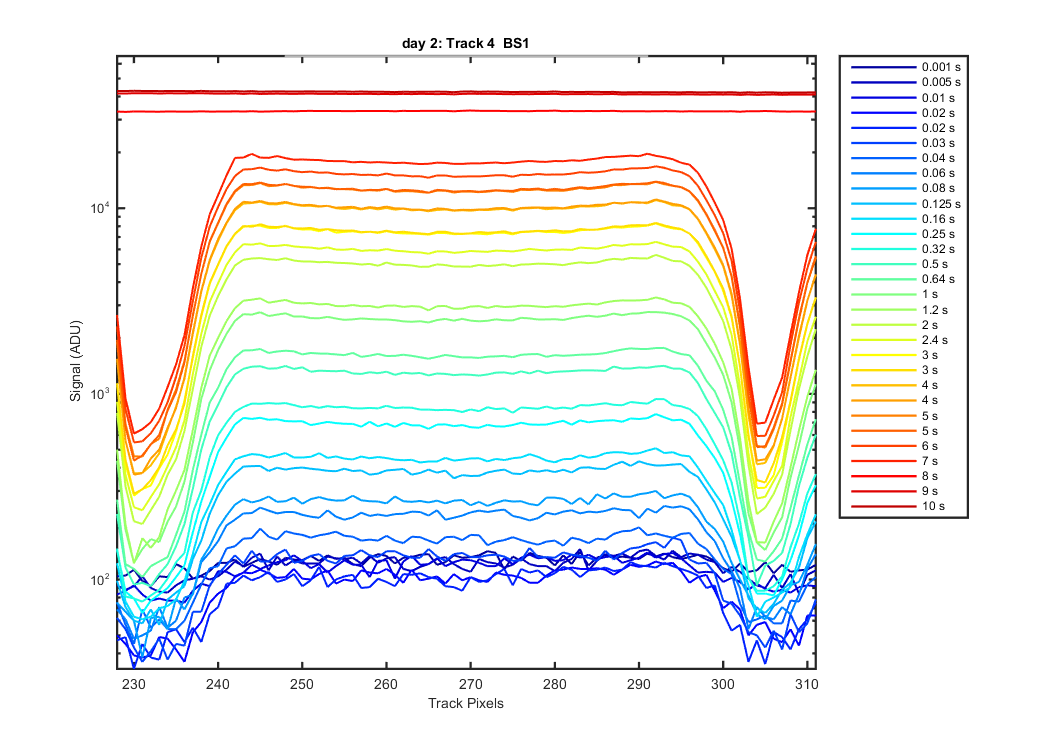
Figure 35
Figure 36
Figure 37
Figure 38
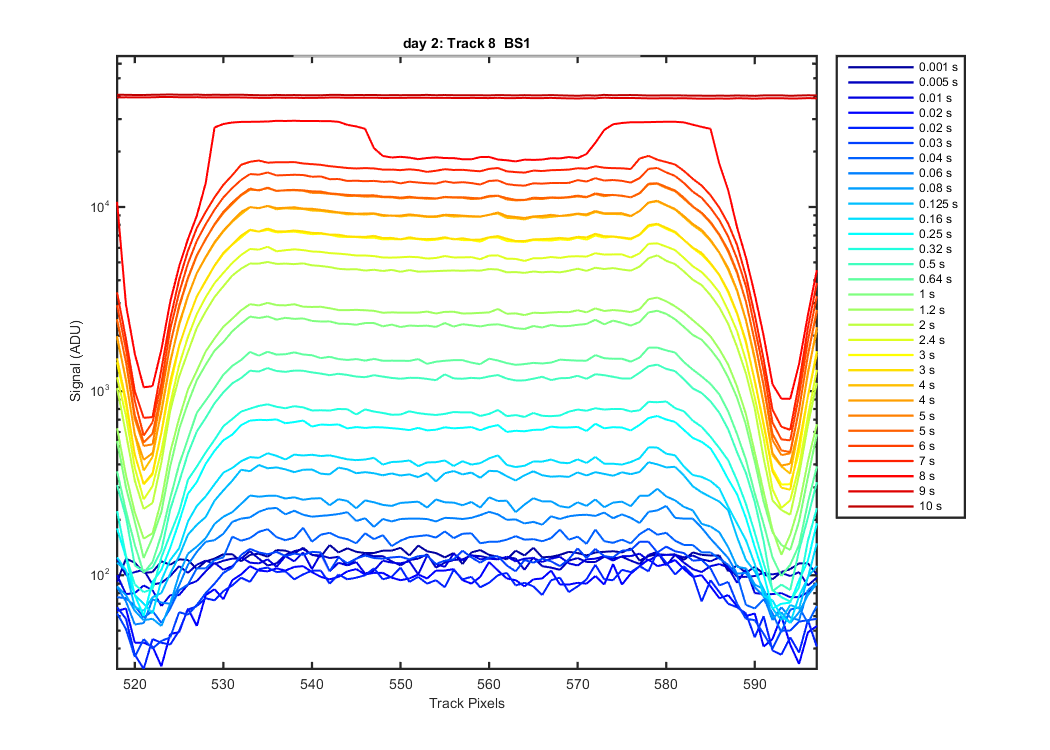
Figure 39
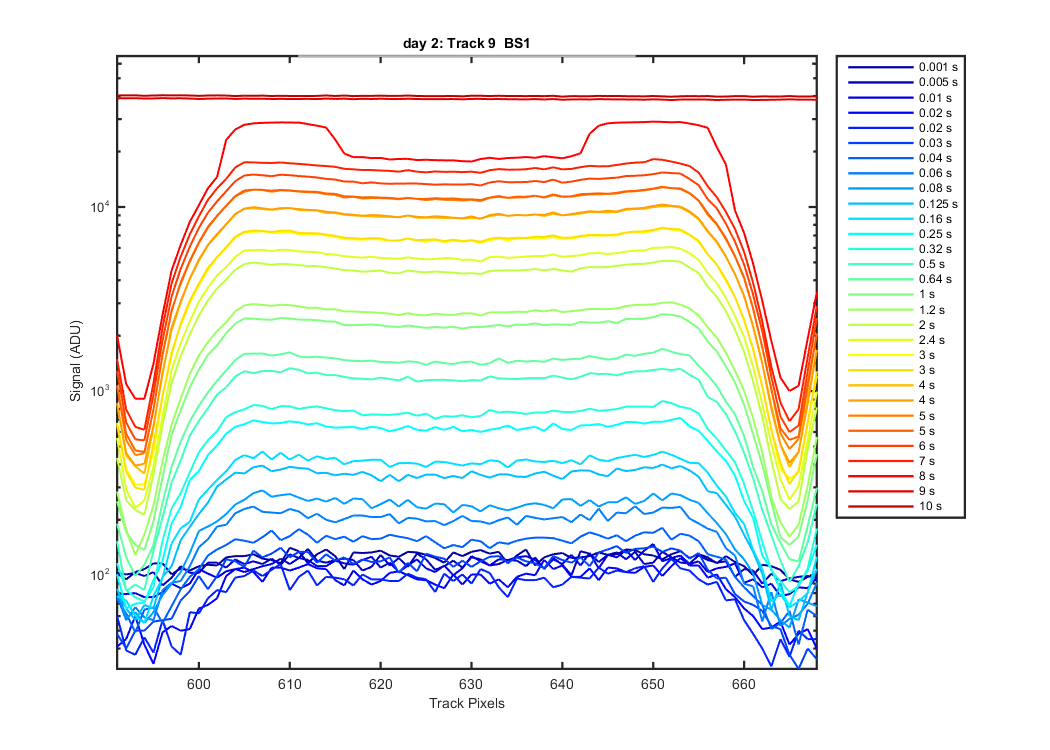
Figure 40
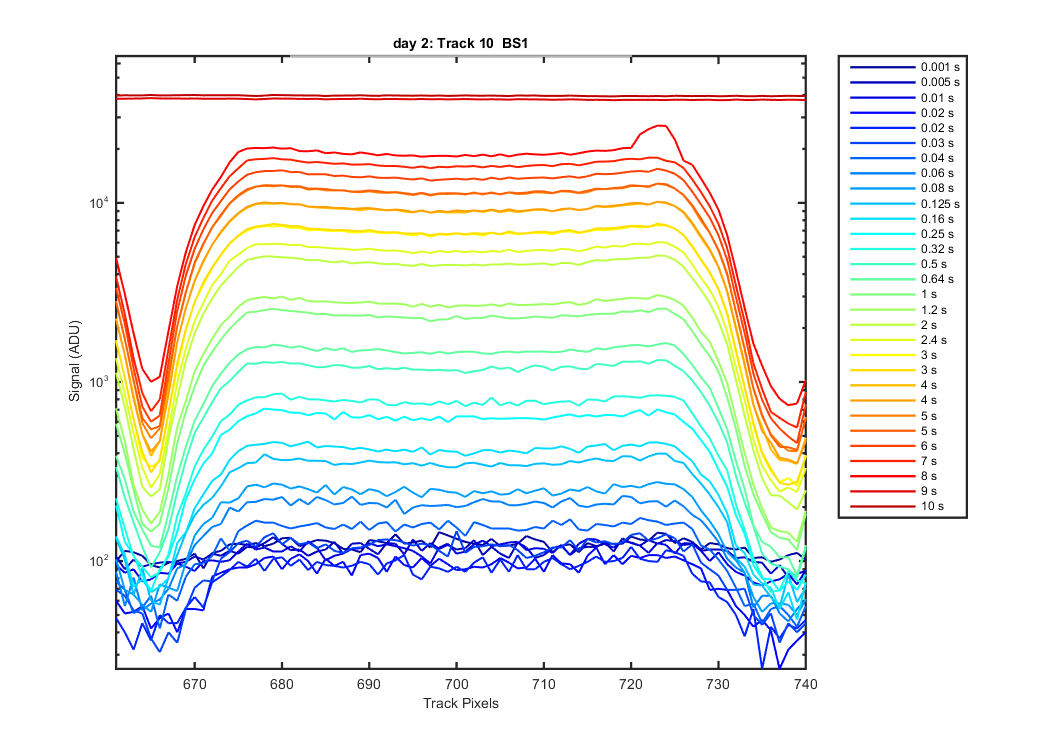
Figure 41
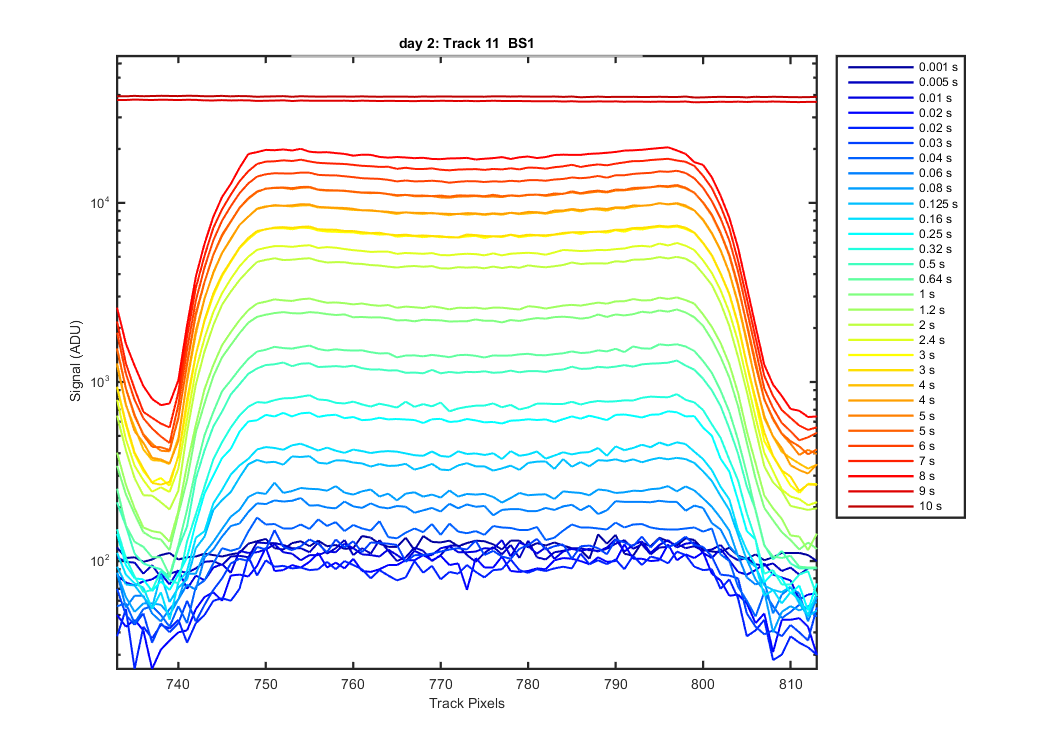
Figure 42
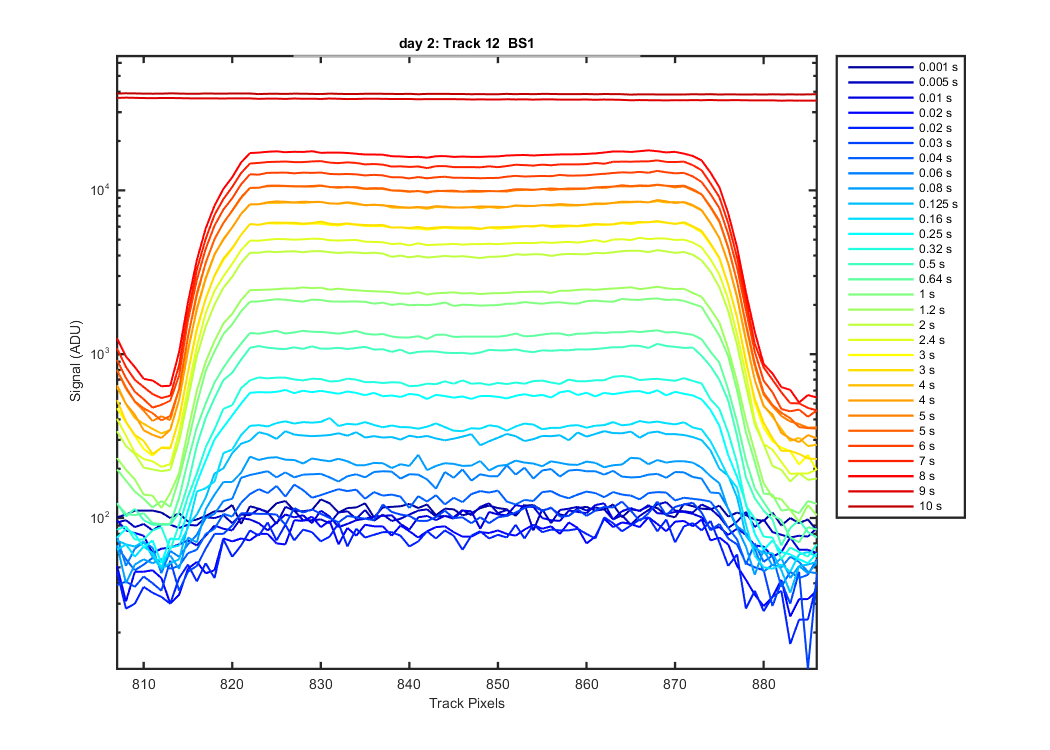
Figure 43
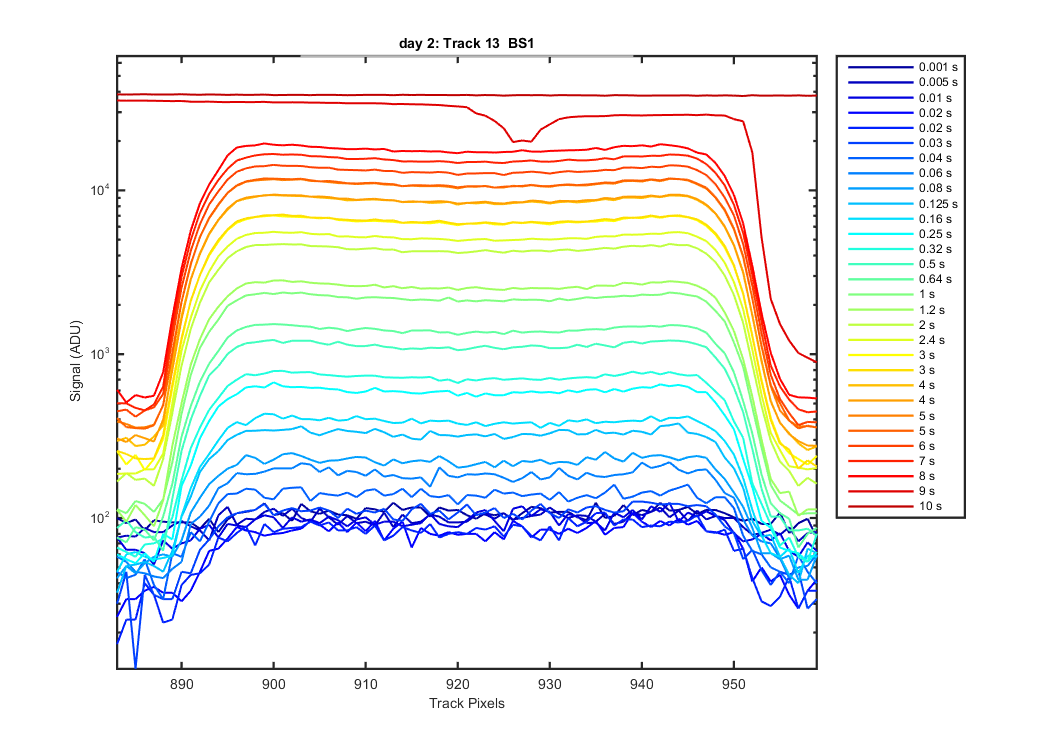
Figure 44