REVISION DATE: 07-Jul-2015 10:20:51
Es data collected by Mike using a MOBY Ed head, this is track 7 only. Here I have plotted the data verses a very basic wavelength cal using the 350, 450 and 680 nm laser data collected on day 1.
Mikes email: The first 4 scans had Ed pointing straight up, sitting next to the tent. Then I thought it might be nice not to "see" the tent, so the next 4 had the Ed mounted on a tripod, pointed towards the (lower) sun.
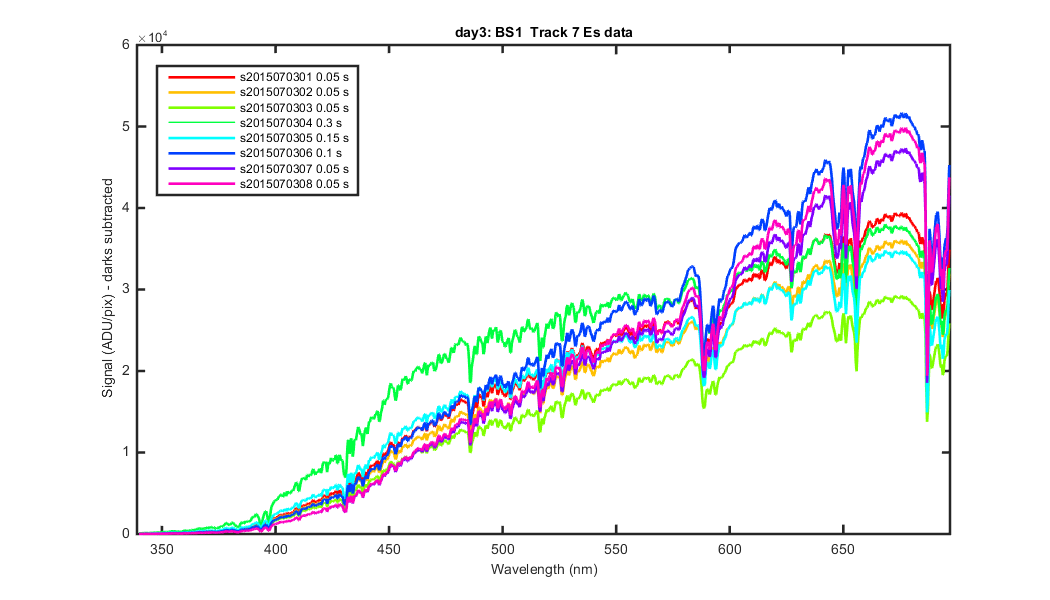
8 sets of Es data. The data plotted are the track mean (hence the /pix) but is not divided by integration time. Darks are subtracted.
Figure 1
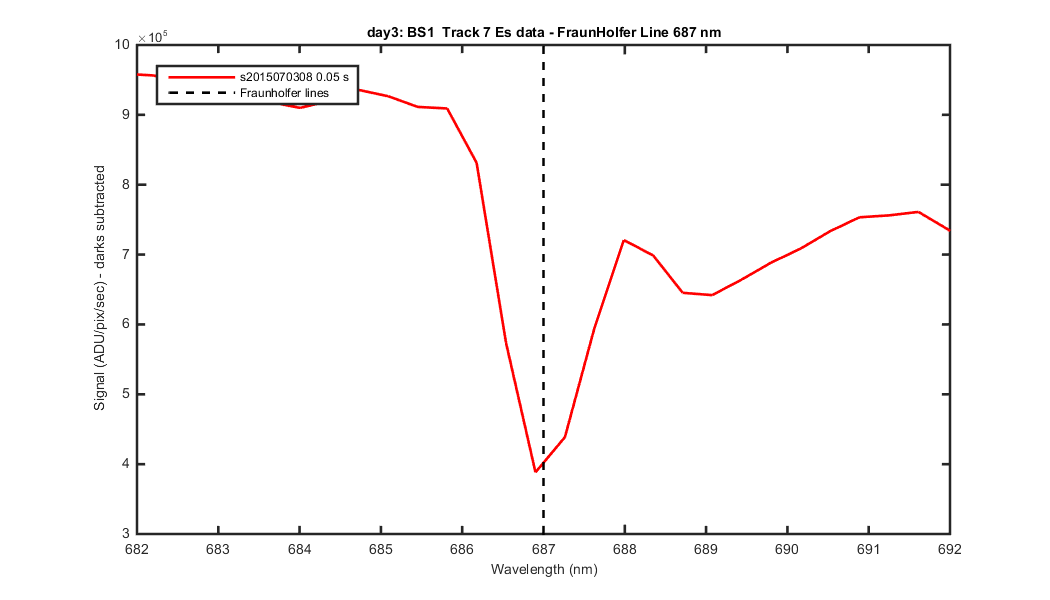
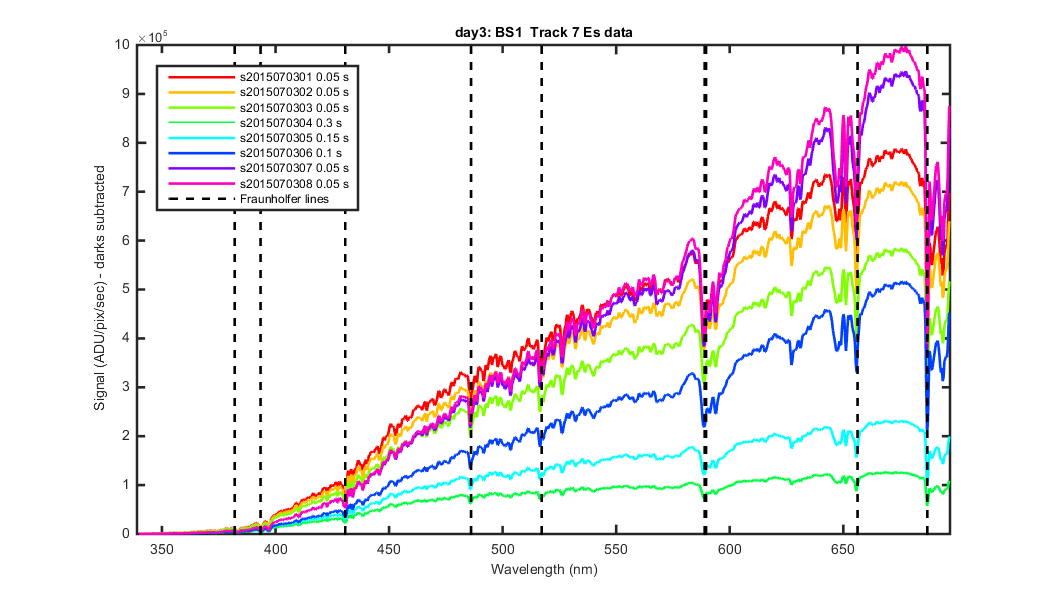
Same as above but divided by integration time.
Figure 2
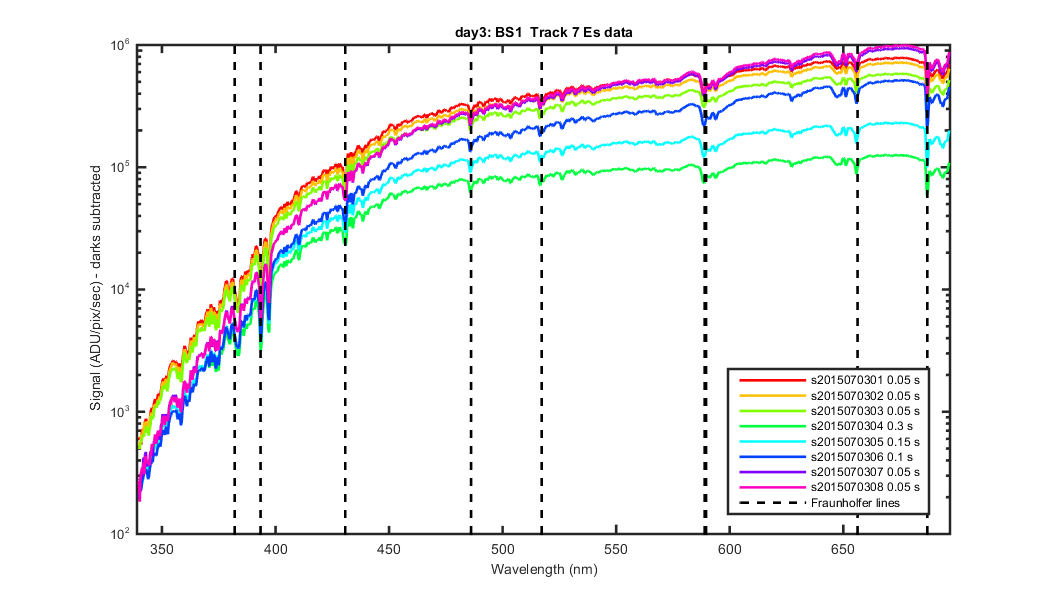
Same as above but logged.
Figure 3
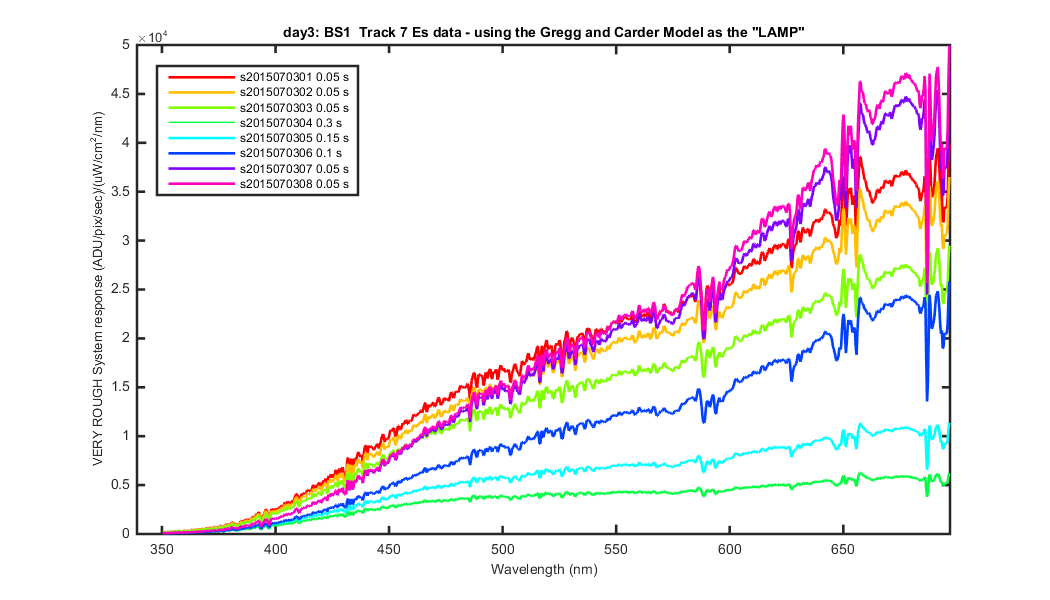
If you used the gregg and carder 1990 model to get and Es and then divide the signal but the Es you get a VERY ROUGH idea ow what a system response might look like.
Figure 4
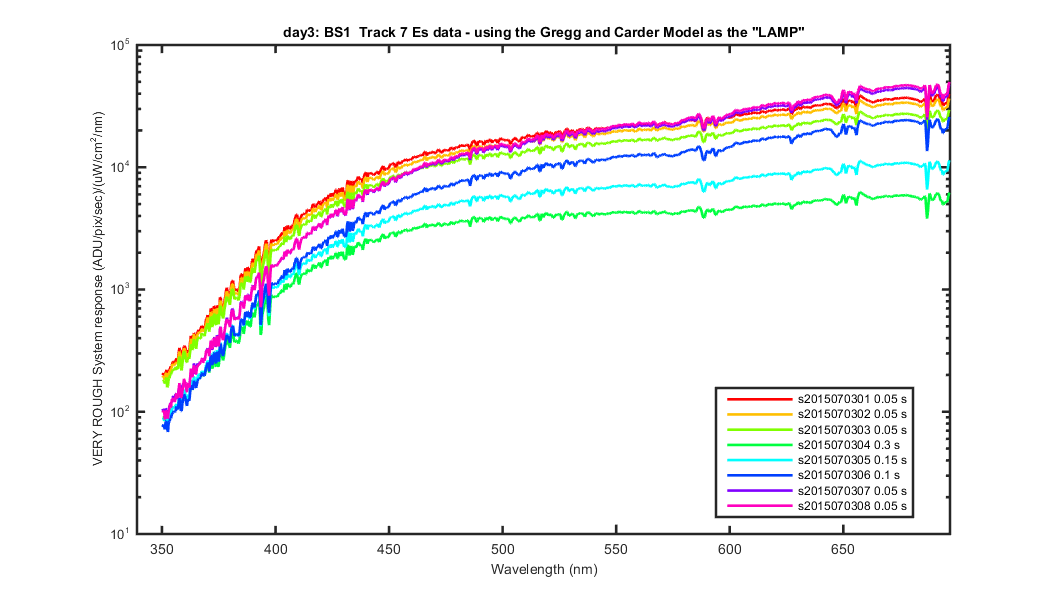
Same as above but logged.
Figure 5
With the MOBY258 system response added for comparison.
Figure 6
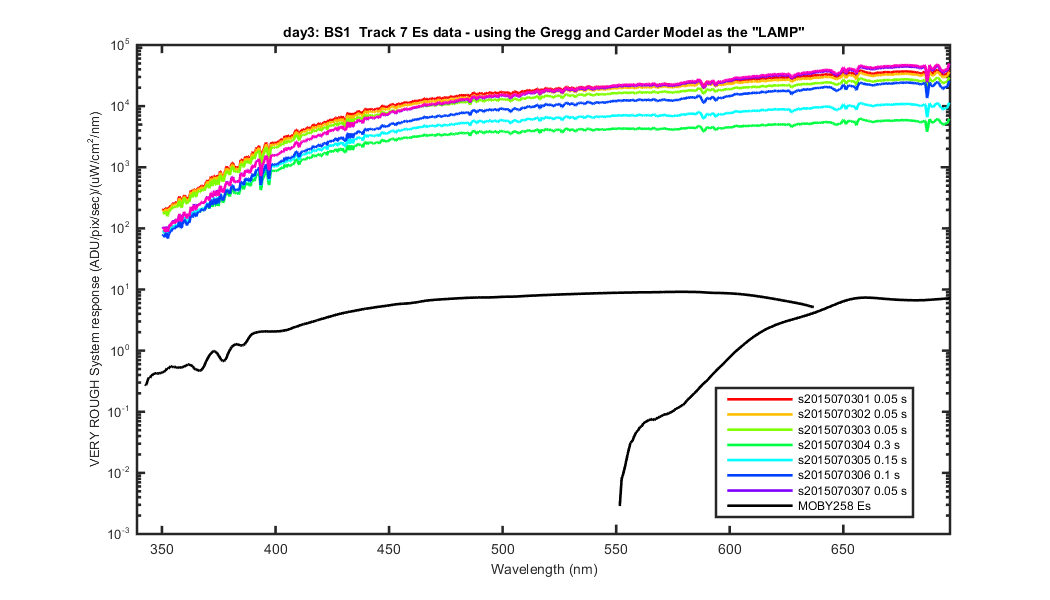
Figure 7
Figure 8
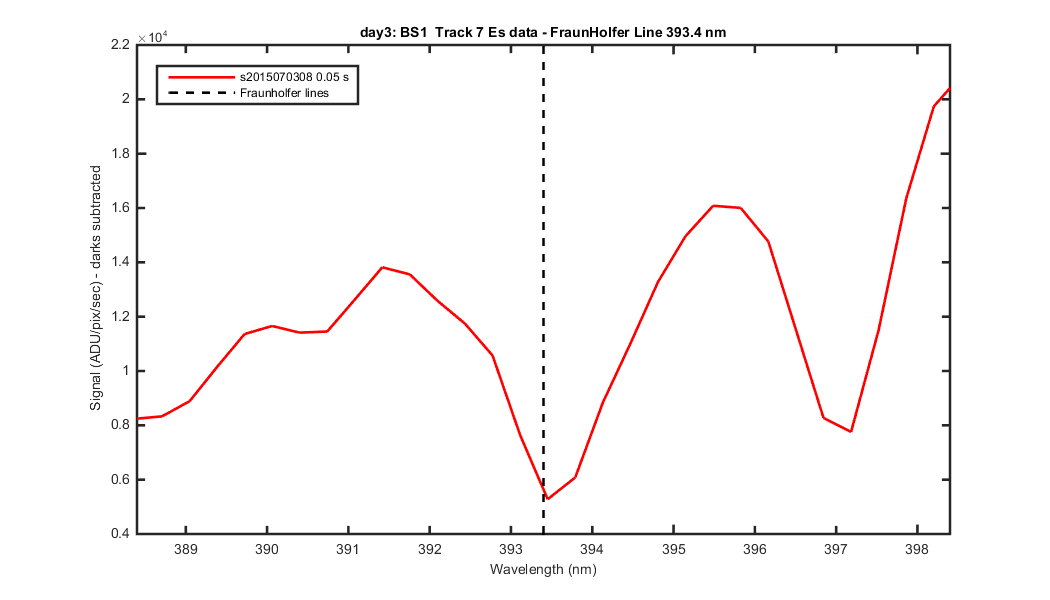
Figure 9
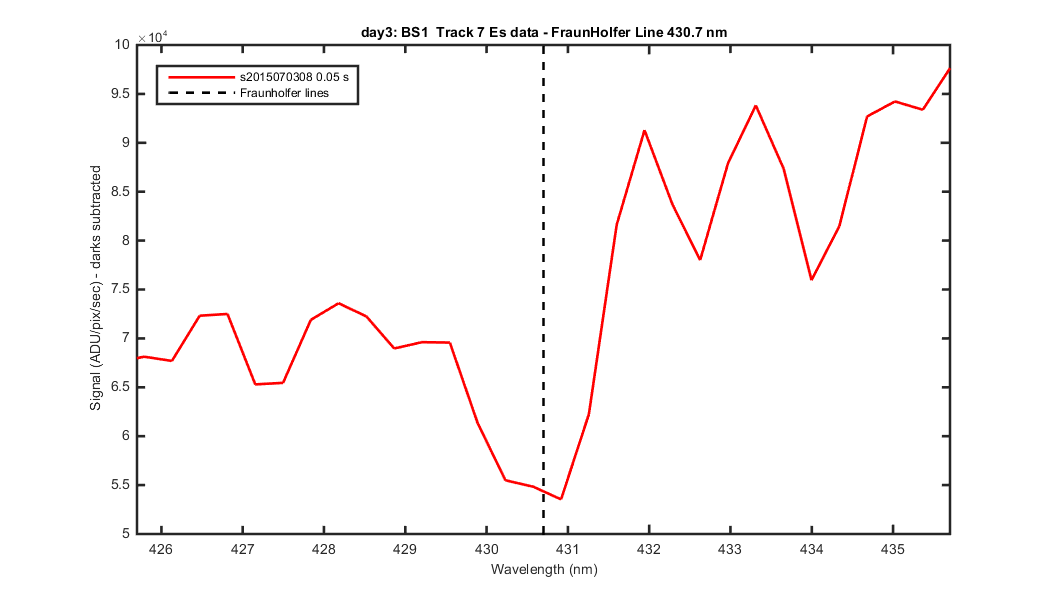
Figure 10
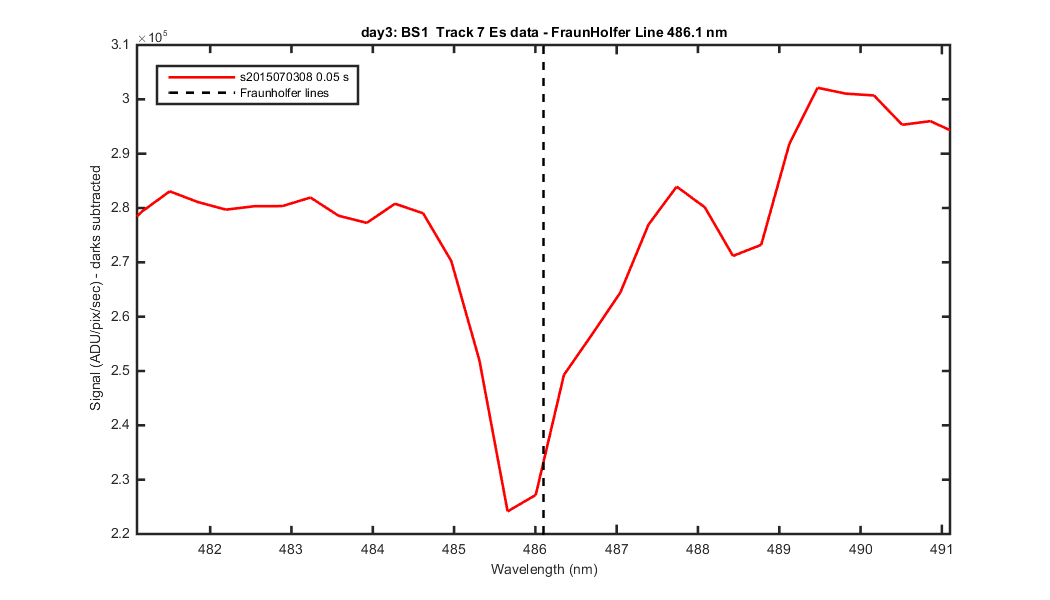
Figure 11
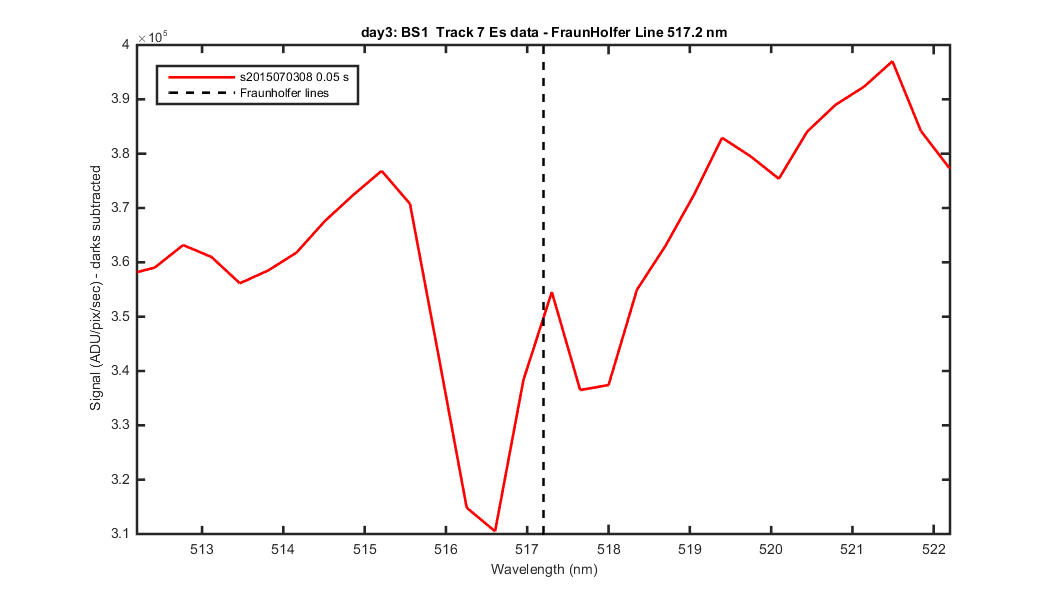
Figure 12
Figure 13
Figure 14
Figure 15