REVISION DATE: 19-Aug-2015 15:26:58
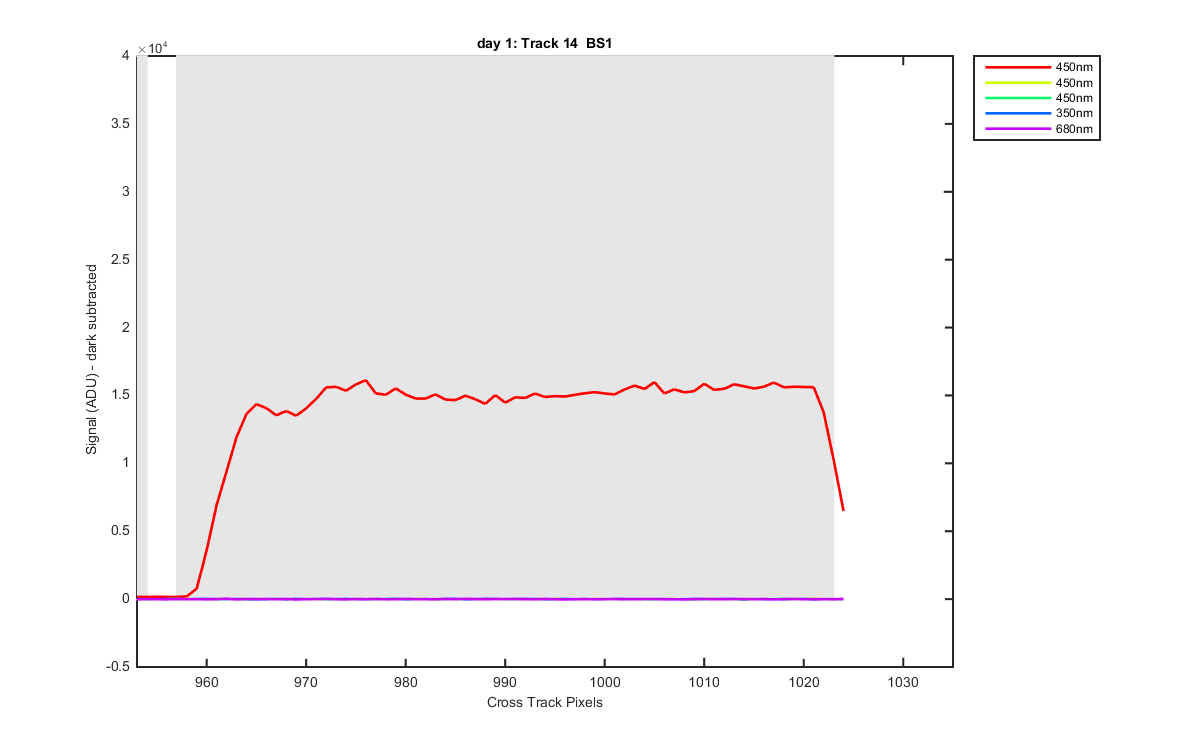
The graphs below show how I defined the tracks. Grey patches are what is averaged for each track. These are created from laser lines, there where 3 450 nm laser lines and 1 each of the 350 and 680 nm lines. The red 450 nm lines was collected with all tracks on, the yellow-ish lines has only track 7 on and the green 450 nm line has tracks 4,7 and 10 on. The blue line is the 350 nm lines with only track 4,7 and 10 on and the purple line is the 680 laser line with the same tracks on. The 450 and 680 nm data where collected at 1 sec the 350 nm data was collected at 0.25 sec.
Interesting to note that the cross track is larger when there are fewer tracks on, which is counter intuitive. Also there is a difference in the shoulders by wavelength.
Track pixels:
Track:  1       2       3       4       5       6       7       8       9      10      11      12      13      14
Left:   3      83     159     232     305     378     451     521     593     664     737     809     883     957
Right:  80     155     229     303     375     446     518     589     660     733     805     879     954    1023
Figure 1
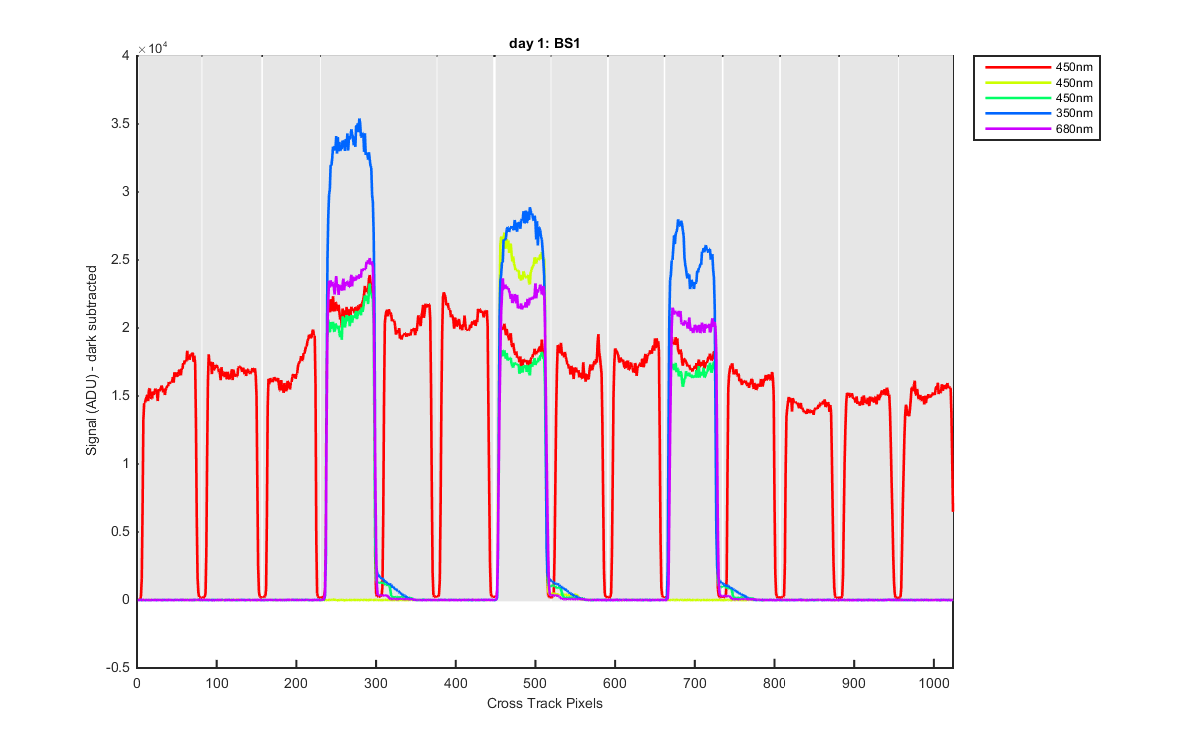
Figure 2
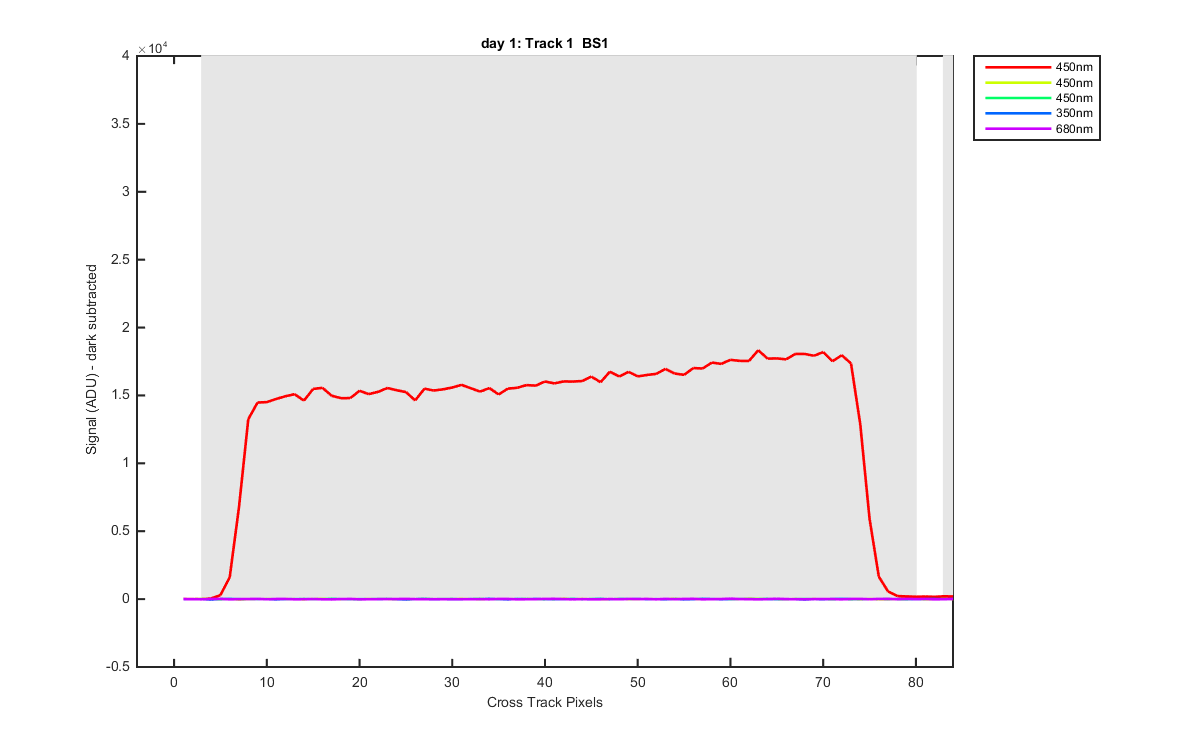
Figure 3
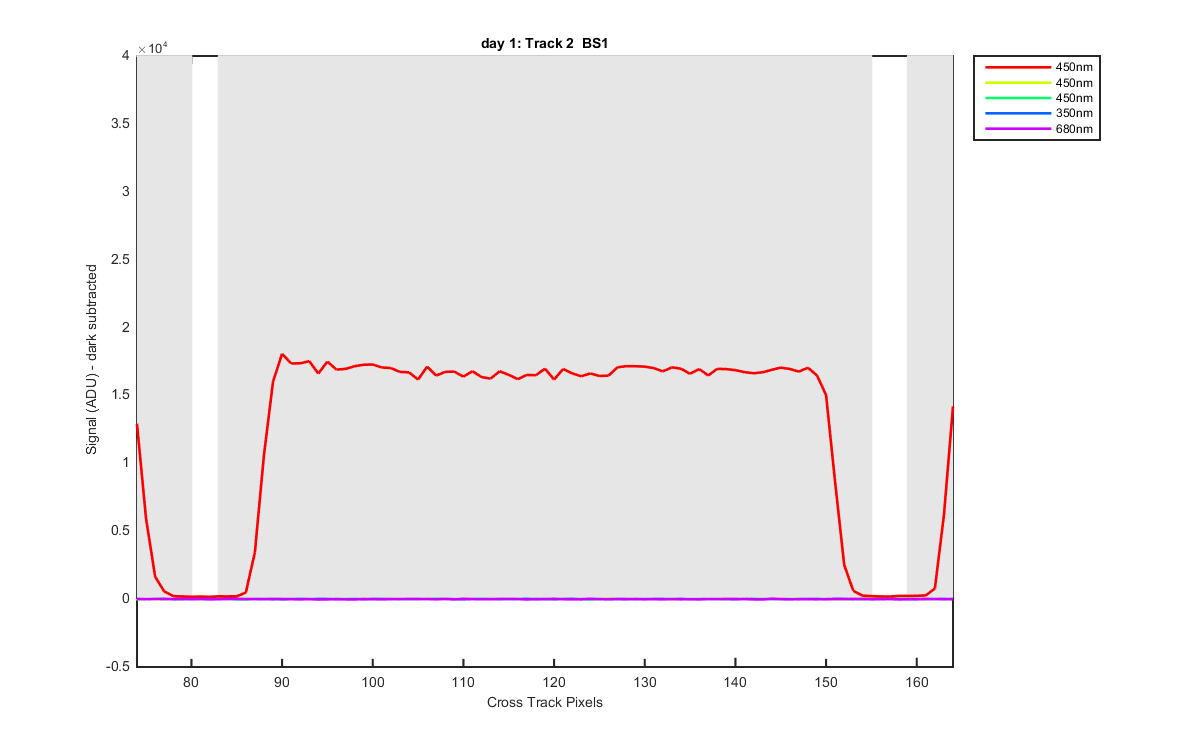
Figure 4
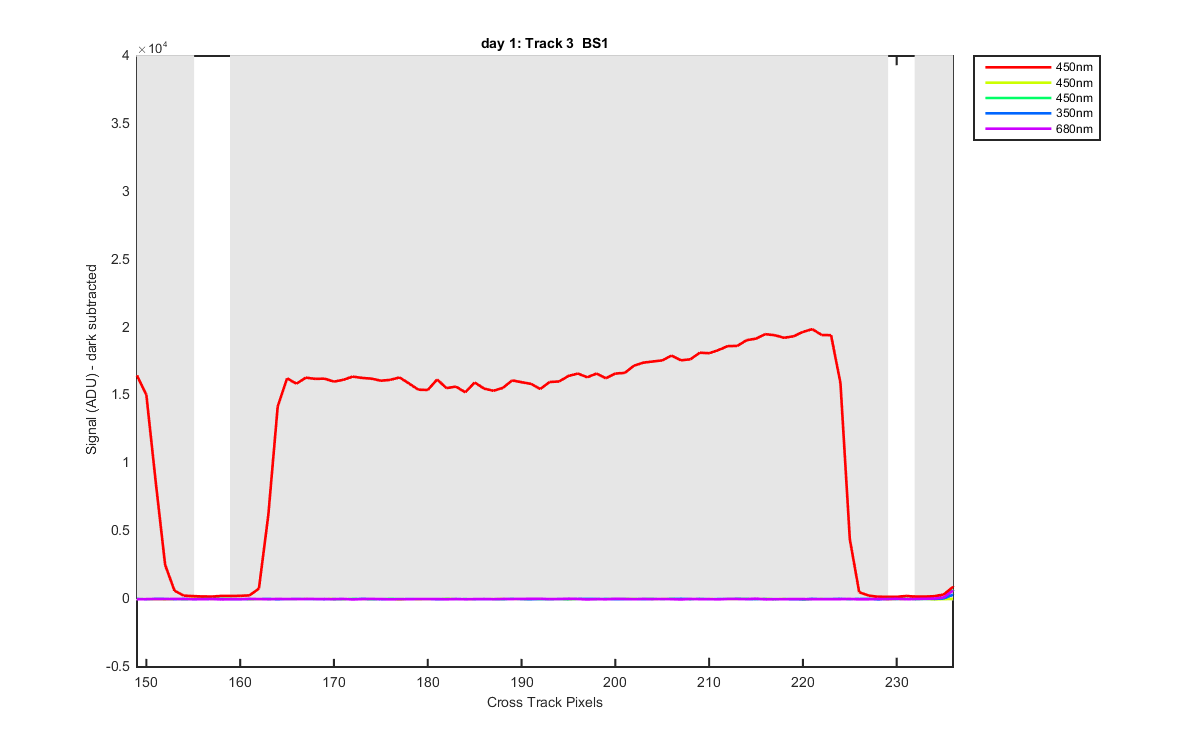
Figure 5
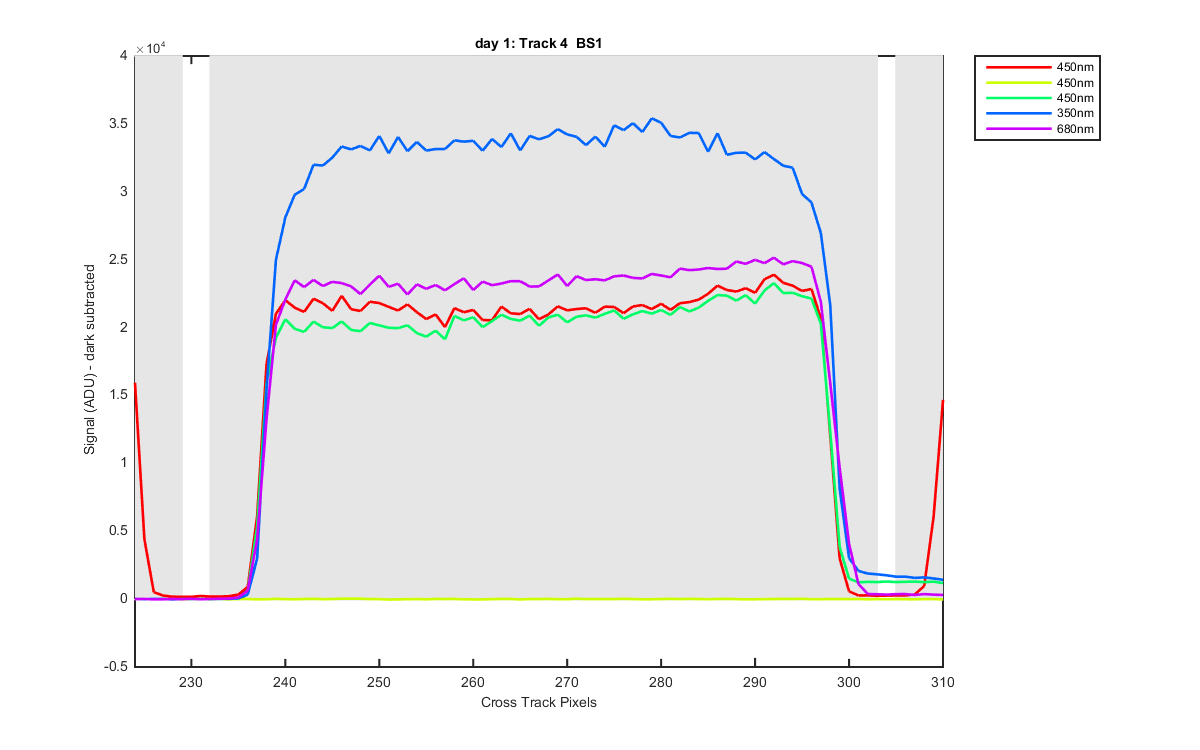
Figure 6
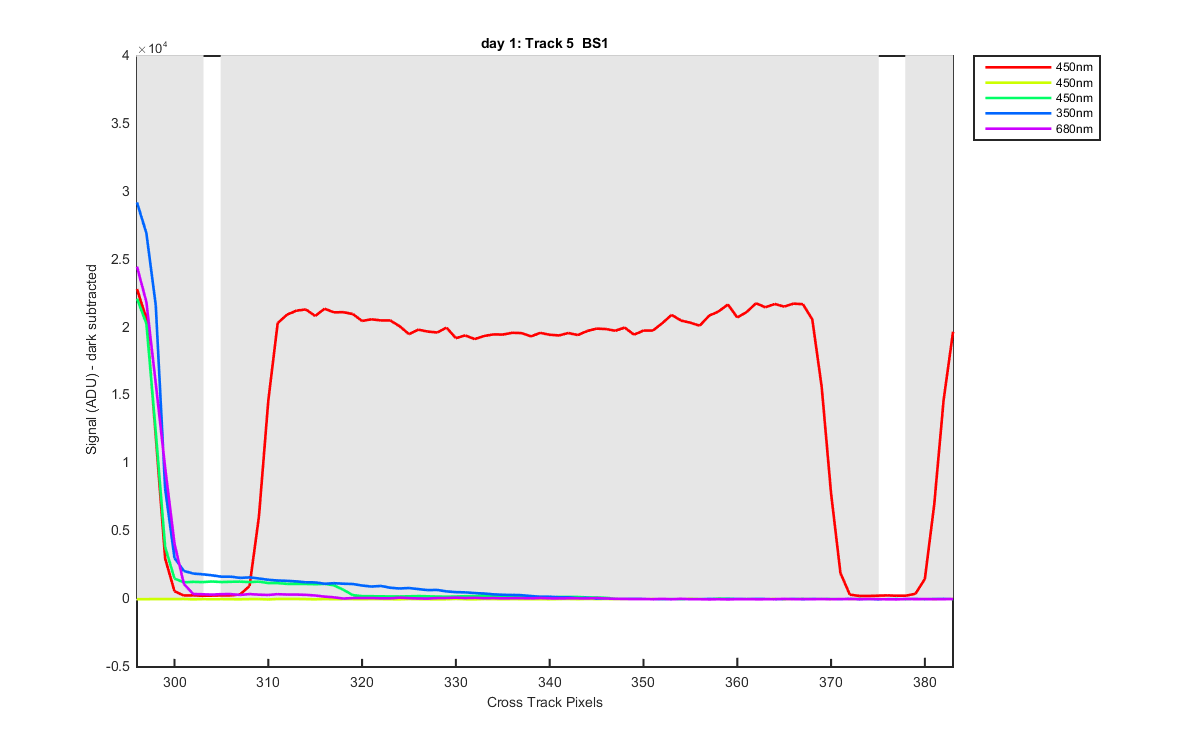
Figure 7
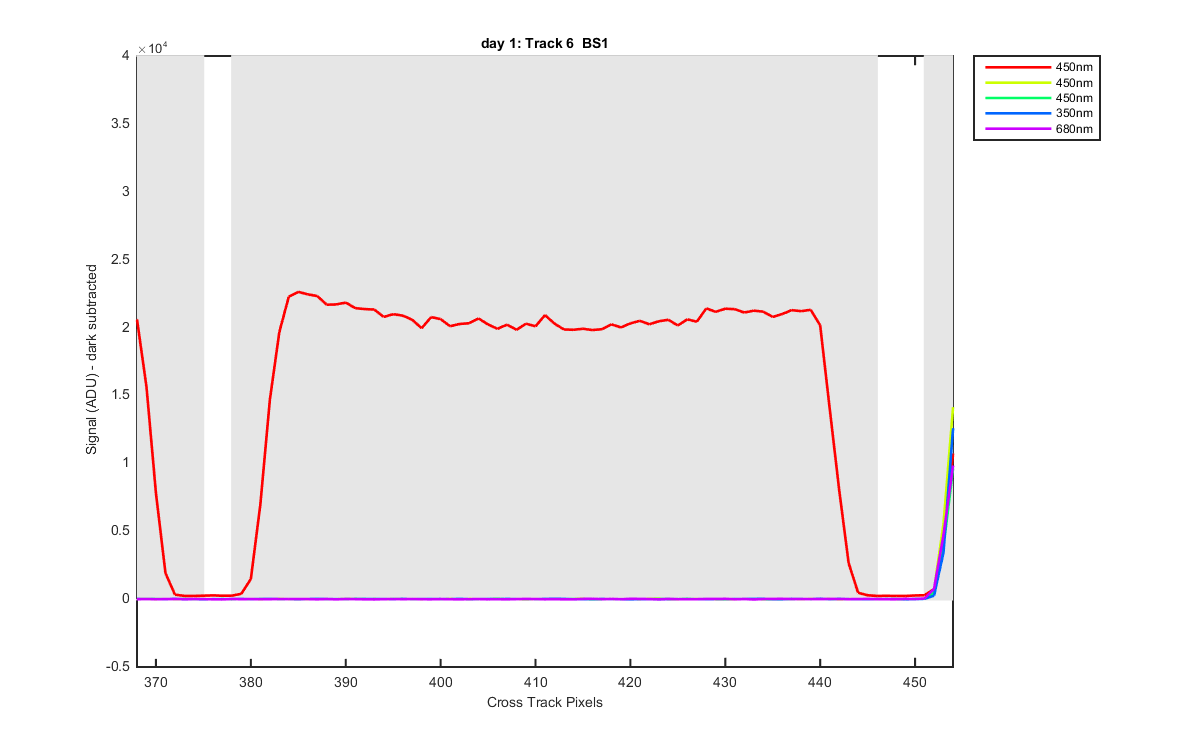
Figure 8
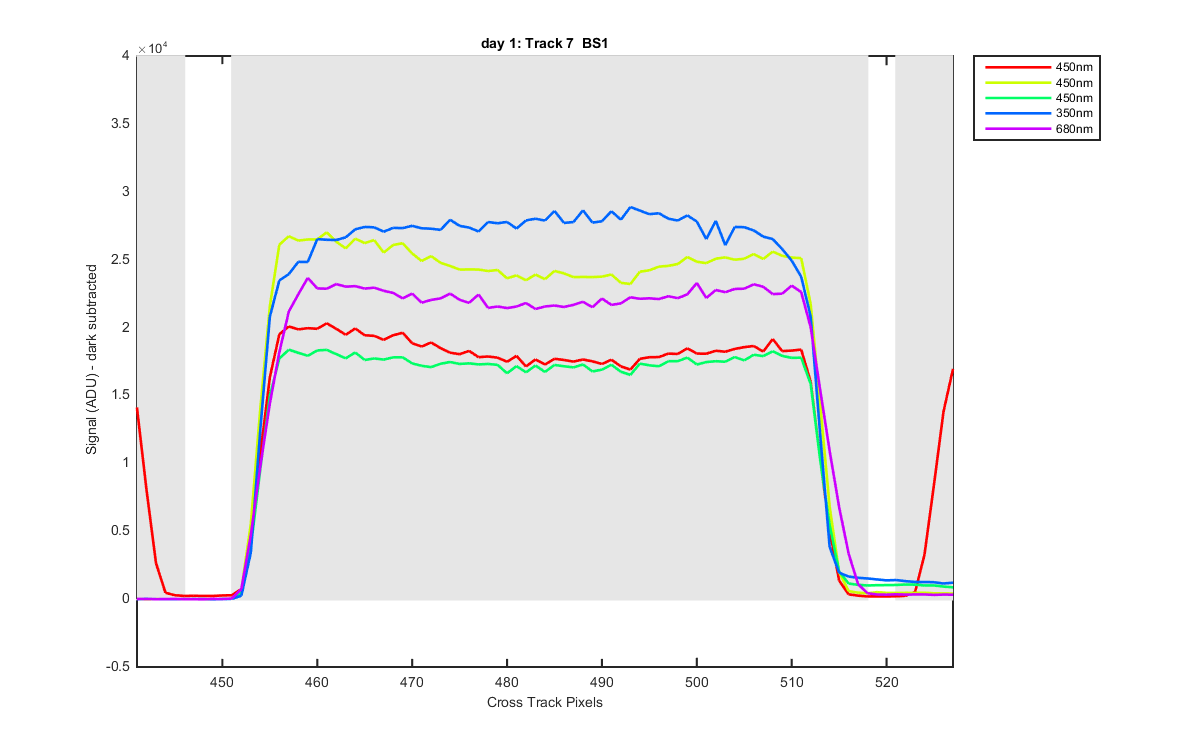
Figure 9
Figure 10
Figure 11
Figure 12
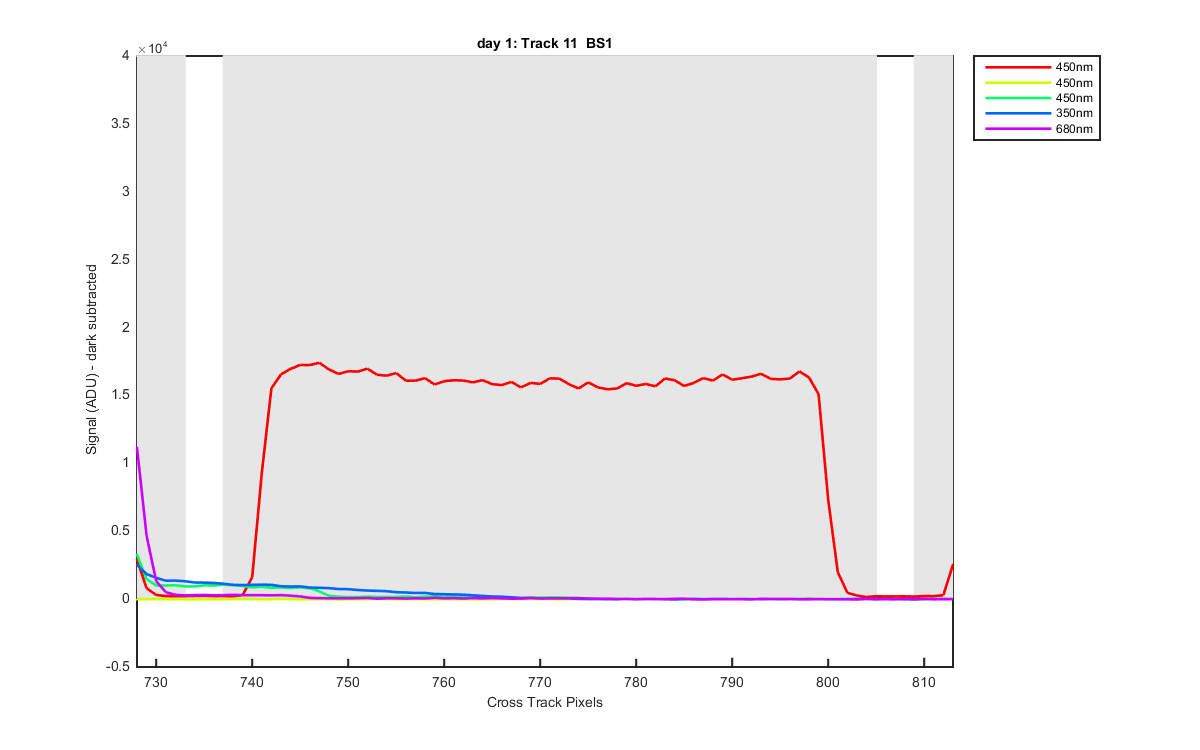
Figure 13
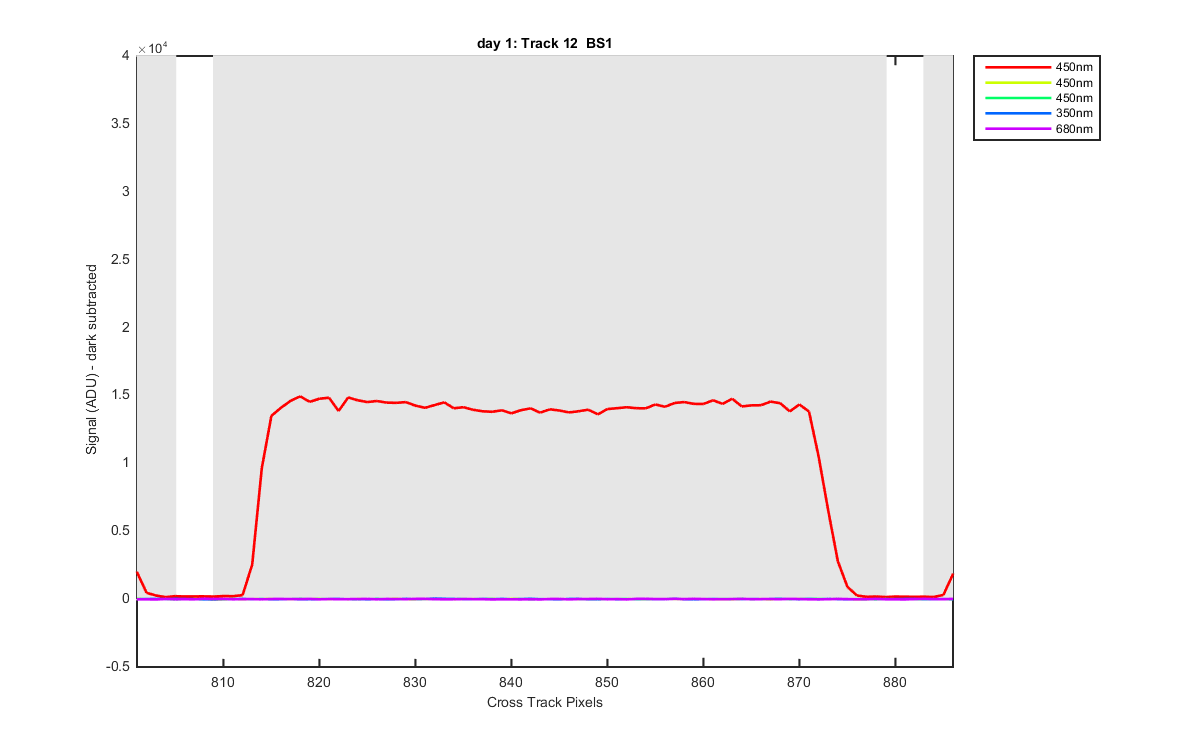
Figure 14
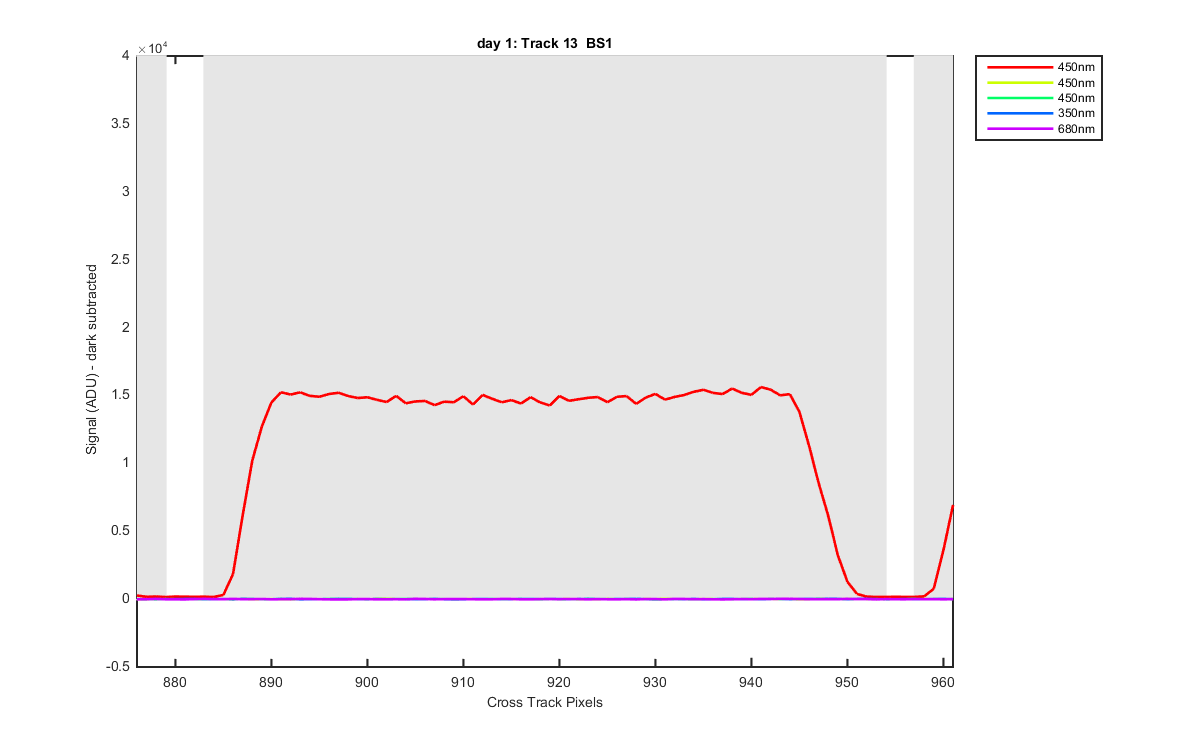
Figure 15