REVISION DATE: 26-May-2016 14:36:33
So Mikes email, below, is the beginning of this page. I tried to find a way to replicate his equations and fit the data in Matlab. Which was an exersize in its felt. Below the graphs show my fit and Mikes fit for the equations with a 5th order polynomial fit.
Hi Steph,
I took the data you sent in a 18-May-2016 "day06" email and tried some fitting approaches,
( which I am not sure what track this is from, and/or if it is from day06 ? )
% Int times and exposure time ratios (x and yx)
x = [0.035 0.04 0.05 0.075 0.1 0.15 0.25 0.3 0.4 0.5 0.65 0.75 0.85 1 1.25 1.5 2.5 3 5 6 7.5 10 15 20 30 45 60 80 100]
yx = [2.58643 2.36259 2.1646 1.66374 1.48963 1.33076 1.1697 1.12076 1.07573 1.05813 1.03118 1.01919 1.01118 1.00237 0.988999 0.980758 0.966631 0.961622 0.956838 0.956841 0.956975 0.959166 0.959634 0.958697 0.958609 0.959177 0.960607 0.962001 0.962718]
but first, the 1sec "yx" was not == 1, but rather = 1.00237
so I re-normalized yx = yx ./ 1.00237
I got these data in to TableCurve 2D v5.01
to fit the Habauzit eqn. Y = (X*a) / (X-b)
but it was not such a good fit
( i.e. it was #19 down on a list of "Simple Equations", ranked by either r^2 or SE)
r2 Coef Det DF Adj r2 Fit Std Err F-value
0.9431350090 0.9387607789 0.1077455413 447.80883275
Parm Value Std Error t-value 95% Confidence Limits P>|t|
a 1.015412582 0.020584983 49.32783098 0.973175685 1.057649480 0.00000
b 0.022188849 0.000525075 42.25841331 0.021111483 0.023266214 0.00000
TableCurve rank #1 was "Power(a,b,b)"
which is Y = a + b*X^c
r2 Coef Det DF Adj r2 Fit Std Err F-value
0.9984286557 0.9982400944 0.0182518841 8260.1710955
Parm Value Std Error t-value 95% Confidence Limits P>|t|
a 0.950793664 0.004783146 198.7799947 0.940961767 0.960625560 0.00000
b 0.050054414 0.003215615 15.56604879 0.043444623 0.056664204 0.00000
c -1.04137721 0.019823869 -52.5314810 -1.08212576 -1.00062867 0.000
And, TableCurve #2 ranking was "y=a+b/x"
which is SIMPLE to get coefficients for via Dr Bs regress.m !
Polynomial Regression: Order = 1
-------------------------------------------
i B(i) Sb(i) F(i)
0 9.4465e-001 4.1376e-003 5.2124e+004
1 5.7172e-002 4.7409e-004 1.4542e+004
r^2 0.9981
Std Error of Estimate 0.0195
N 29
Degrees of Freedom 27
Geometric Mean B(0) = 9.4443e-001
B(1) = 5.7225e-002
Last, I was trying to get regress.m to run Habauzit via "regression type 4=user",
but the closest I could figure out was a "2 term function": y=a+bx+c/x
which turned out only slightly better than y=a+b/x (see the low F-value for "b" coef):
User-defined Regression:
User Function: 1 = xdata(1,h)
User Function: 2 = 1./xdata(1,h)
-------------------------------------------
i B(i) Sb(i) F(i)
0 9.3990e-001 4.6931e-003 4.0109e+004
1 2.6942e-004 1.4304e-004 3.5477e+000
2 5.7434e-002 4.7412e-004 1.4674e+004
r^2 0.9984
Std Error of Estimate 0.0186
N 29
Degrees of Freedom 26
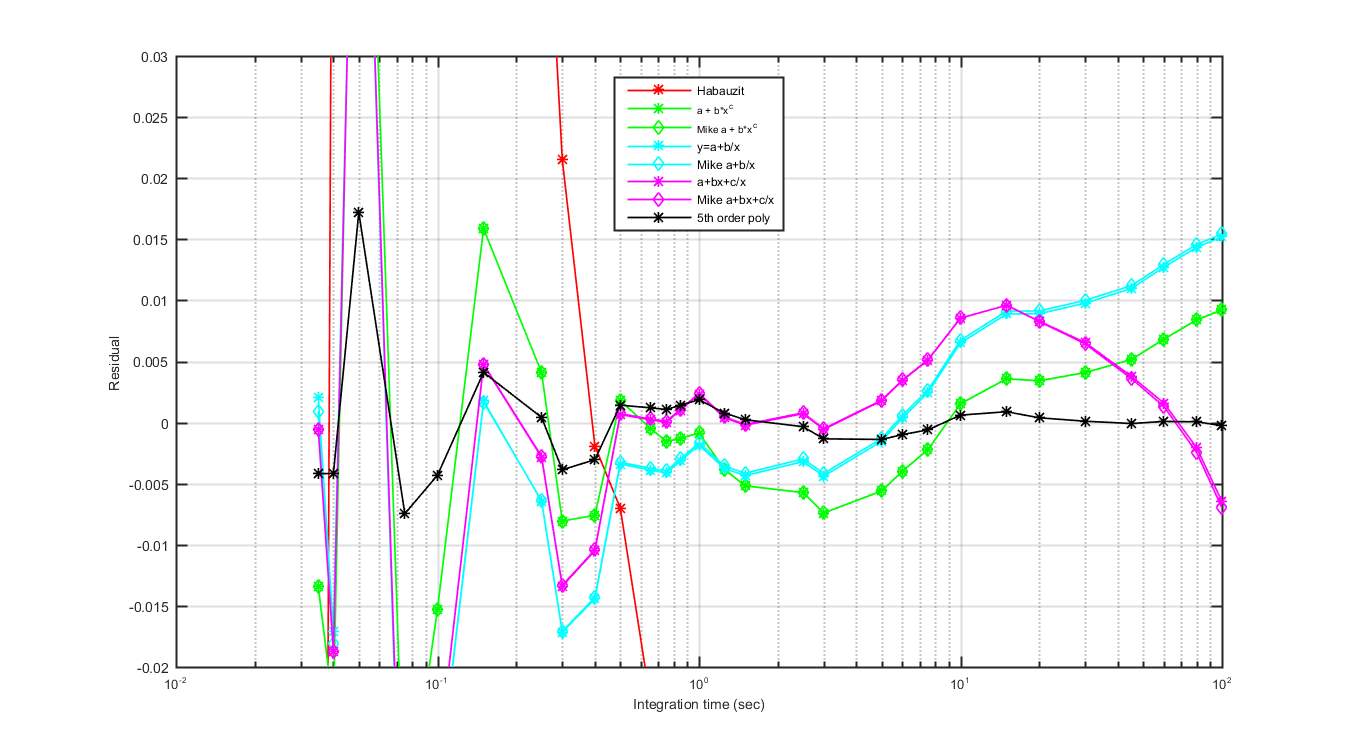
Here is my plot of the above results,
I have two conclusions:
1.) we need to make certain the "Correction Factor" (Habauzit terminology) == 1 at 1 sec
2.) the easiest (and ~best) fit for the data you sent me might be y=a+b/x
So, Maybe we can put the repeats together for Trk7-only scans and run this fit thru all T7 data ?
Then we can compare that fit with the data for T1 & T14 only=on day09,
and also compare that fit with T1 & T7 & T14 from all-trk=on day6 ?
Or something...
I am giving up for the weekend! MF
Figure 1
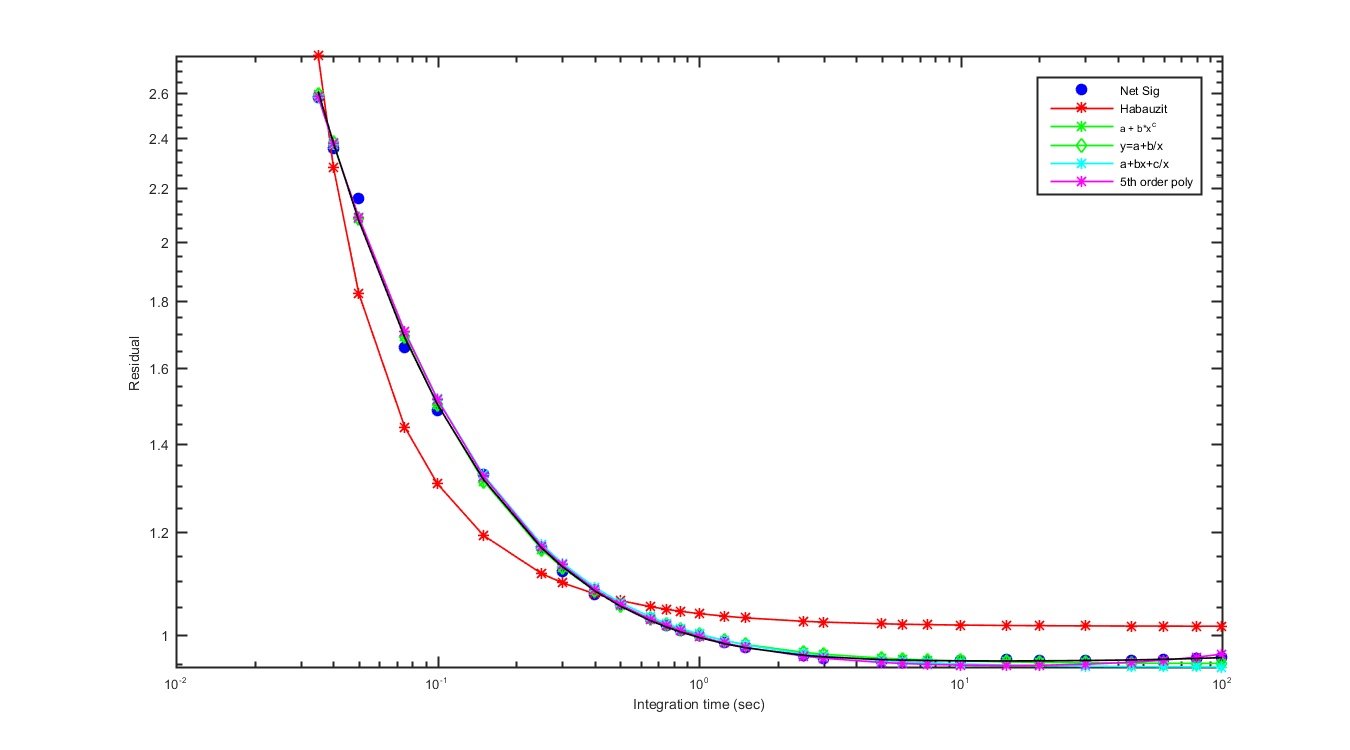
Figure 2
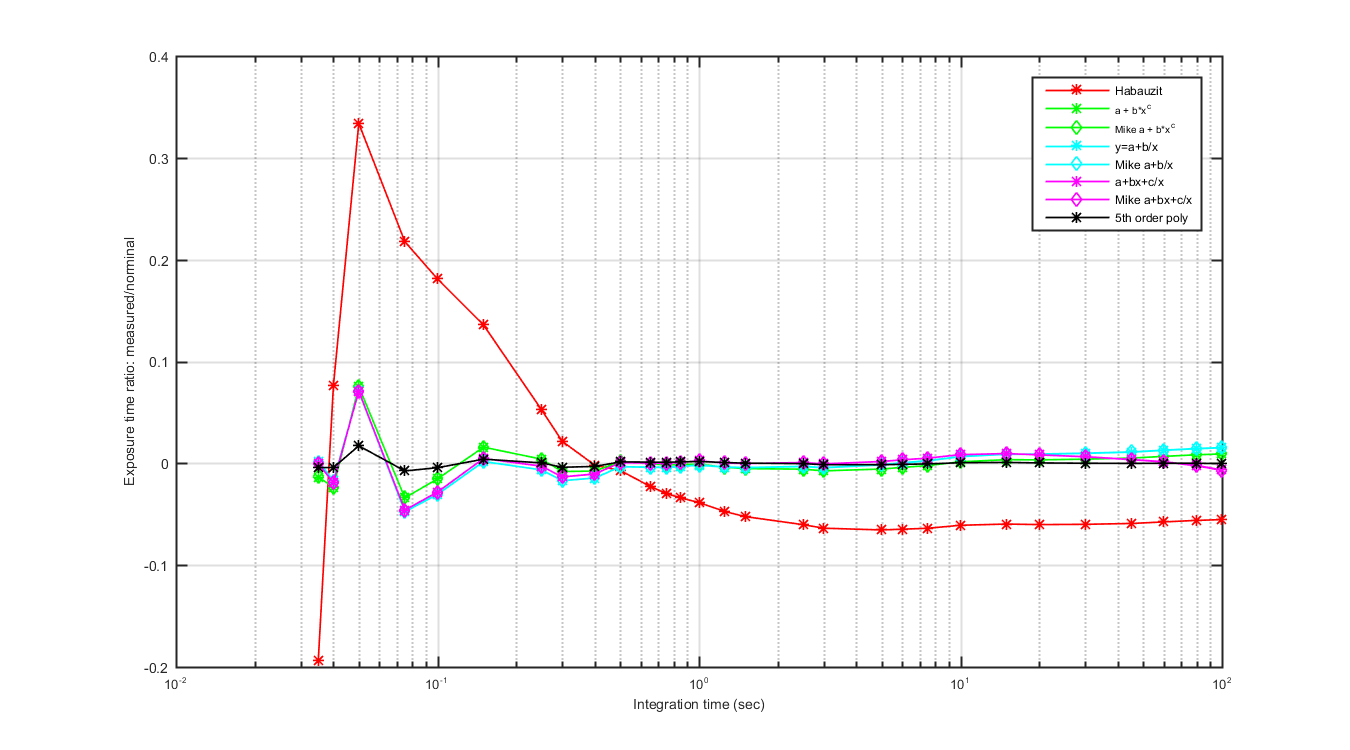
Figure 3