REVISION DATE: 26-May-2016 16:10:30
The data for this page all NET signals (lite-dark)
The Day 10 data was Mike doing the int cal a different way. As Mike said in his Day 10 email ... I tried to repeat the Trk7 exposure time cal by the Habauzit 2003 method: "The radiance was changed along with the exposure time to keep the number of counts approximately constant in order to eliminate any possible nonlinear effects." So we should follow their data processing description for Fig.6: "The averaged number of counts, normalized to the monitor signal, was divided by the exposure time. This result was then normalized by the count rate at 1 s to get a value y(t) for each exposure time"
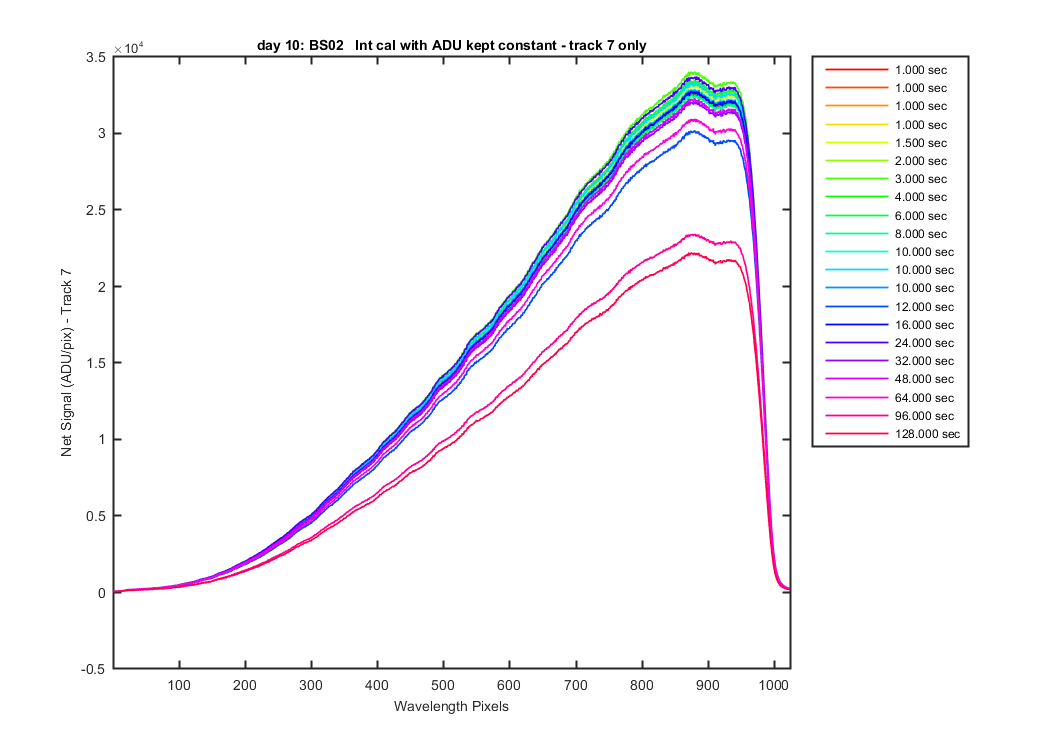
The Net signals for the day 10 data.
Figure 1
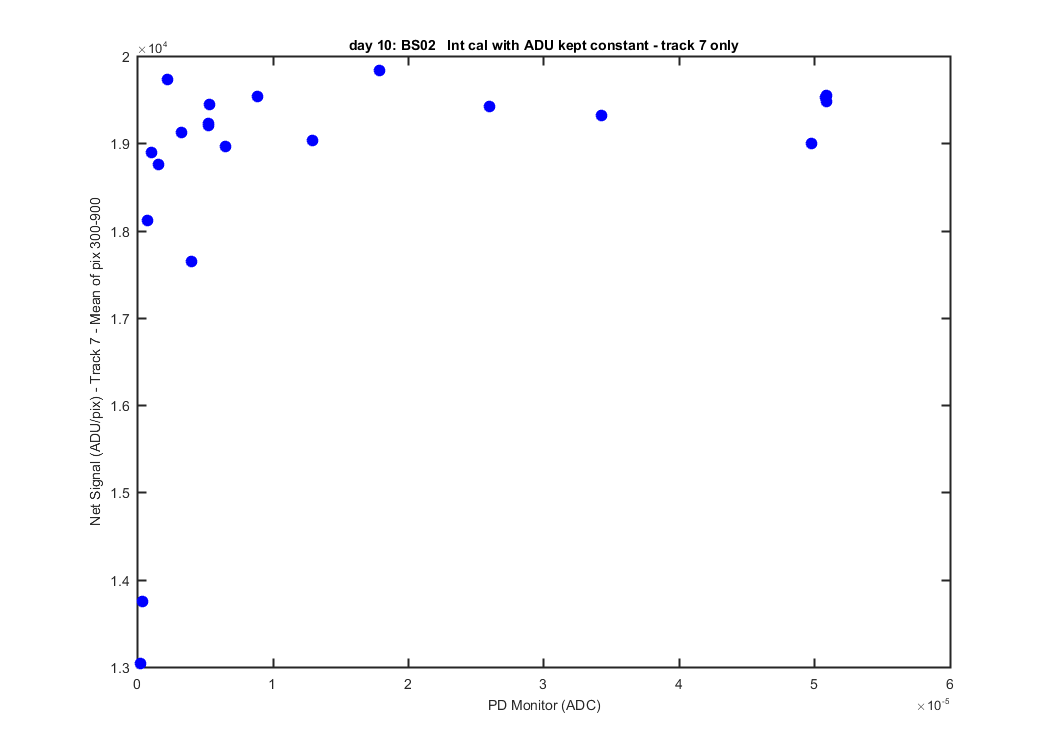
The mean of each net signal verses PD monitor showing the ADU does not change much at the lamp levels change.
Figure 2
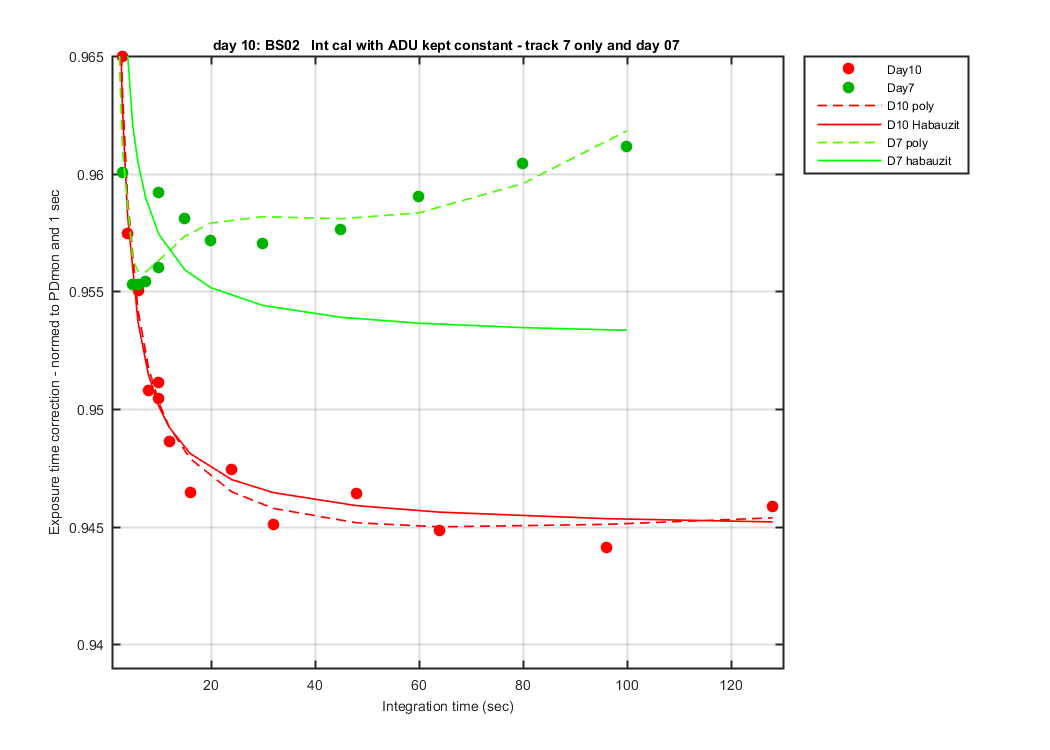
The mean of pixels 300-900 are for day 10 are plotted, they were divided by int time, then normalized by PD monitor and then to the 1 sec data. As outlined in Habauzit 2003. I have also plotted the day 7 data (also uncontaminated by cross track straylight) for reference. I have also plotted for both the 5th order polyfit and the Habauzit equation fitted. Her method definately work better with the data collected using her method.
Figure 3
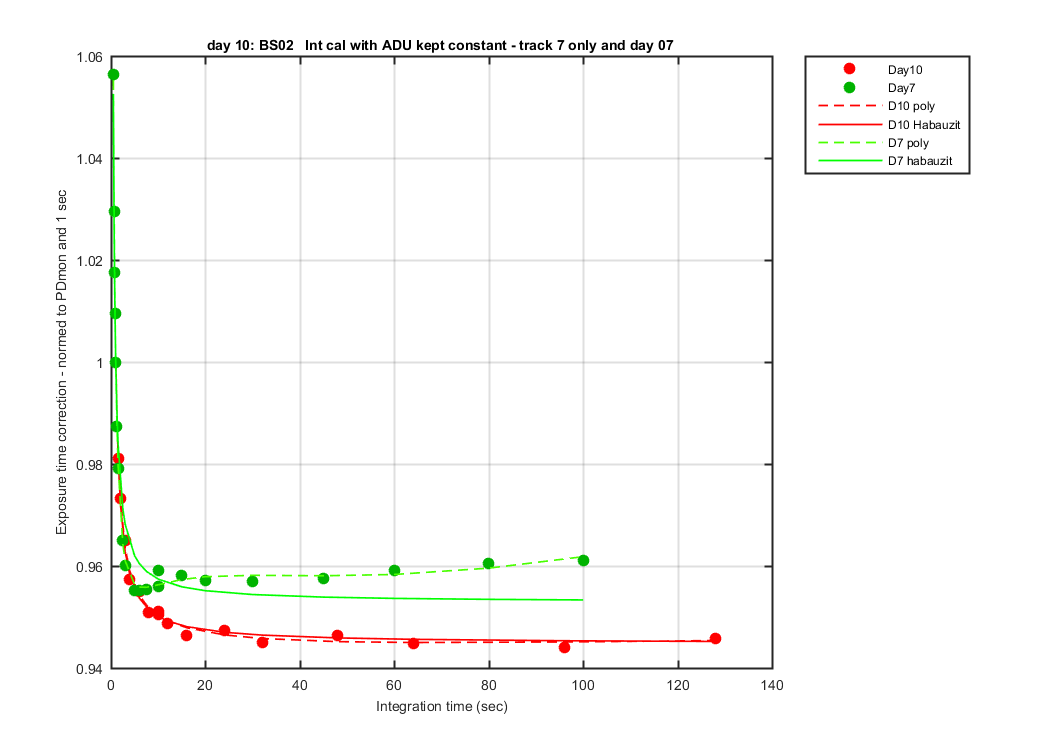
A zoomed view of the previous graph.
Figure 4