REVISION DATE: 17-May-2016 14:36:13
Day 5 data were collected at different lamp levels but the levels where changes by reducing the lamp volatge which changes the lamps color temperature so this data should not be used as part of the int time cal experiment. But the high lamp level data can be used to compare all the tracks on to track 7 only to get an idea of the stray light effect. The data were divided by the PD montitor values as well.
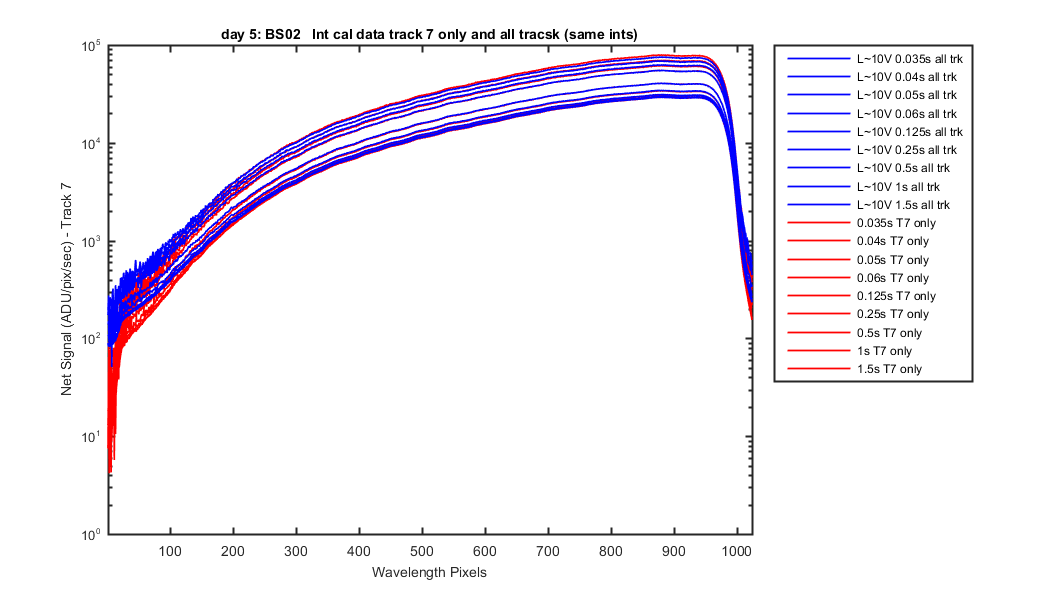
All the "All tracks on" and "Track 7 only". You can see the difference in the cross track light best in the UV area.
Figure 1
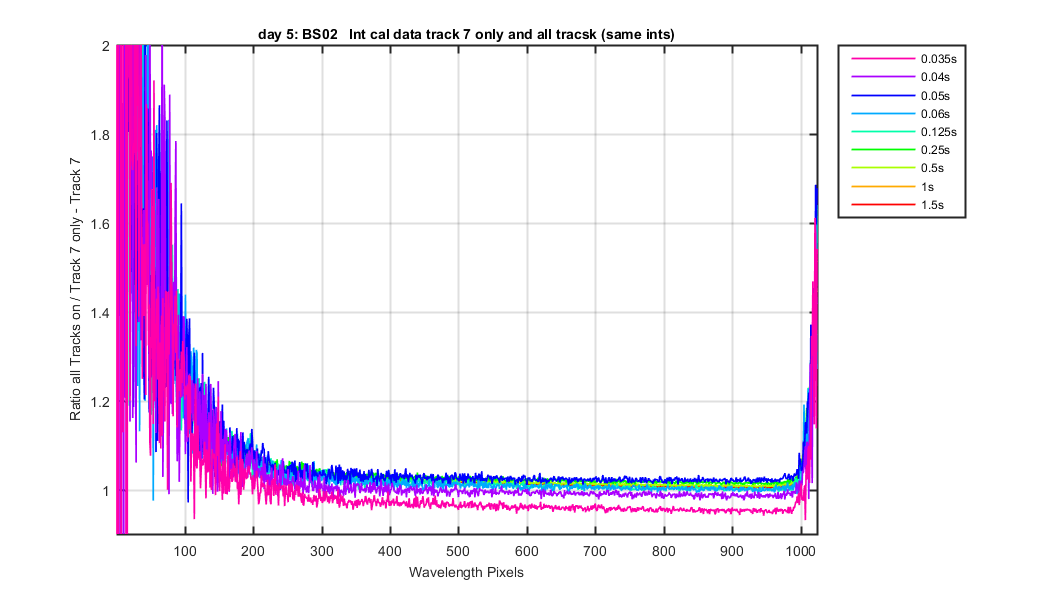
The ratio of all the int times for track 7 (all tracks on) and track 7 (track 7 only). The lower int times are pretty noisy at the UV end
Figure 2
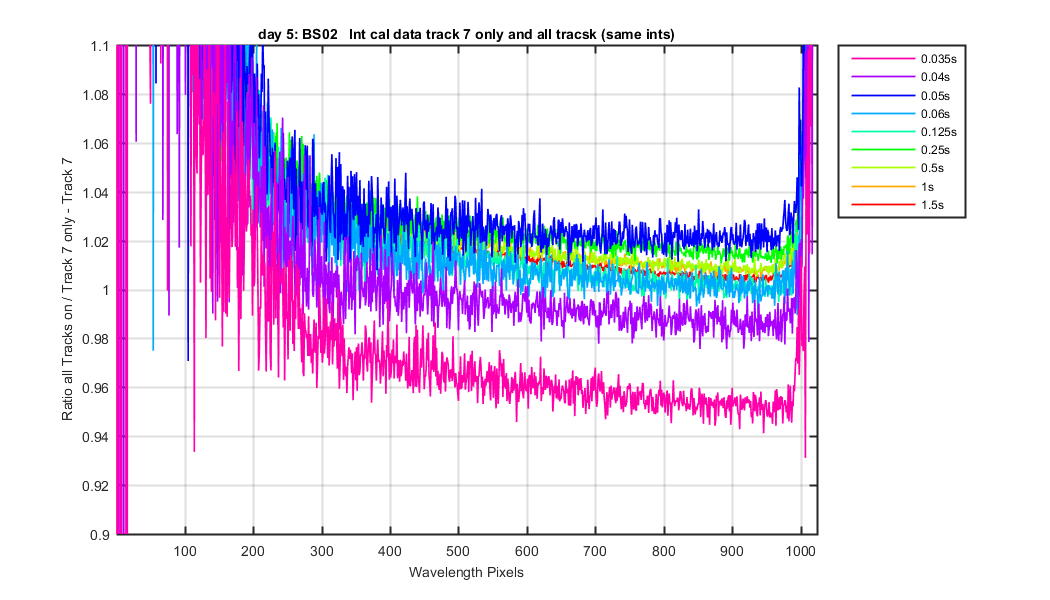
Same as previous but zoomed to the lower end of the ratio
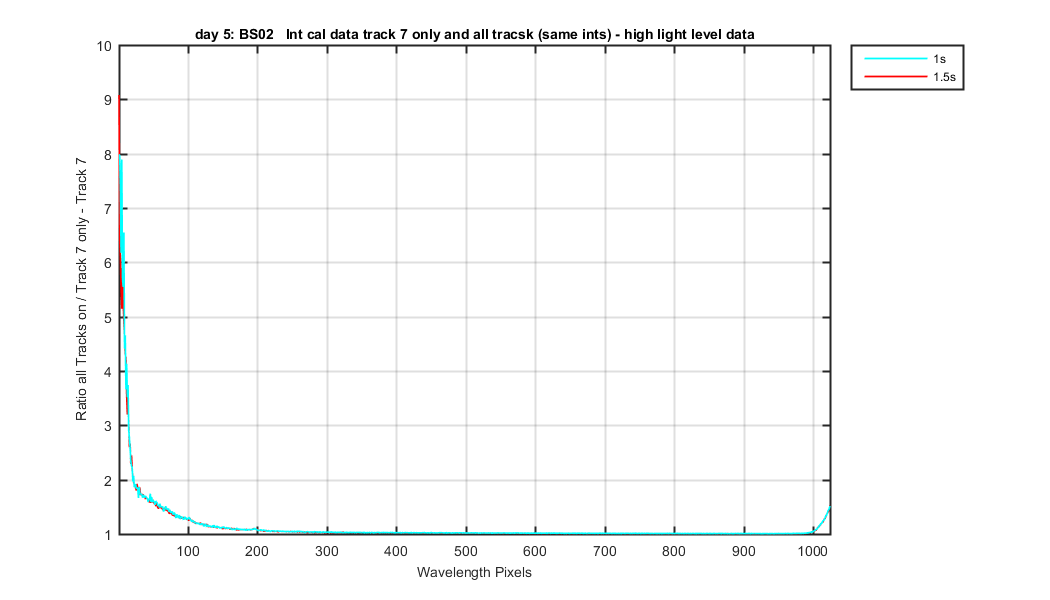
Figure 3
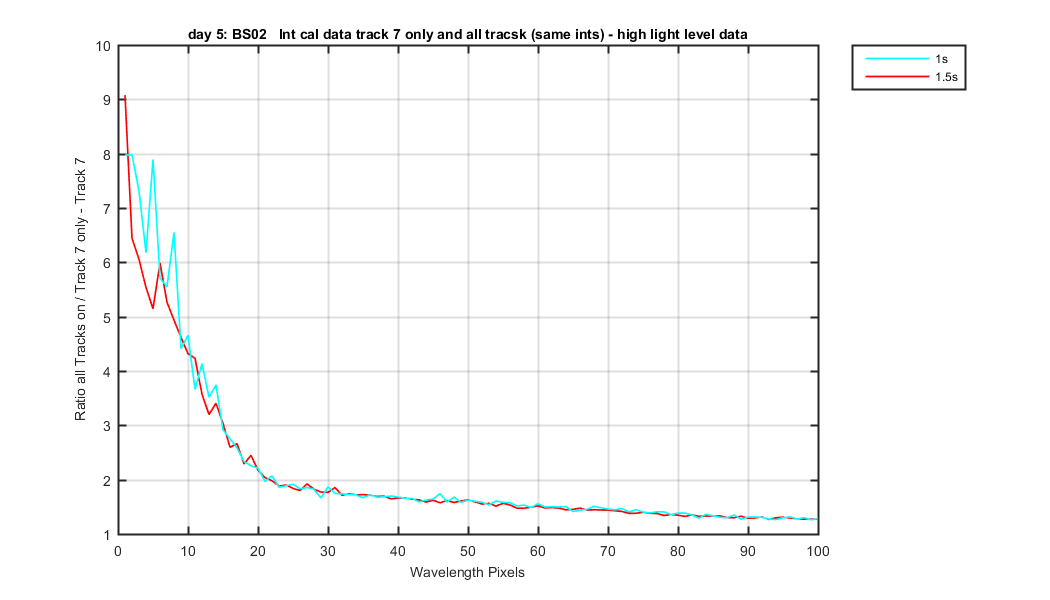
Only the two highest int times, were the UV is not as noisy because there is more signal.
Figure 4
Same at previous graph but zoomed into the UV end
Figure 5